Scalp Long – FET🚀 Scalp Long – FET
Price has successfully broken out of the downtrend and continues to show strong upward momentum. Buying volume is surging, and RSI confirms dominant bullish strength — signaling continuation potential.
🎯 Trade Setup:
Take Profit (TP): 0.3921
Stop Loss (SL): 0.2772
Risk/Reward Ratio (RR): 1 : 2.19
A solid long setup riding post-breakout momentum, supported by strong volume and clear bullish confirmation from RSI.
Longsetup

Scalp Long – TUT🚀 Scalp Long – TUT
Buying volume is rising sharply as price holds above a strong support zone. Price action suggests a potential move to retest the local high, while RSI has re-entered the buying region — indicating renewed bullish strength.
🎯 Trade Setup:
Take Profit (TP): 0.02201
Stop Loss (SL): 0.01901
Risk/Reward Ratio (RR): 1 : 3.48
A clean long setup supported by increasing volume, strong support defense, and bullish momentum confirmation from RSI.

“The Changing Wind” for the EuroEURUSD is showing signs of recovery after a prolonged downtrend — and this time, both fundamental and technical factors are aligning.
On the fundamental side , the ECB has made it clear: there’s no reason to cut rates further . In other words, Eurozone interest rates are sitting at a “golden balance” — tight enough to keep inflation in check, yet not restrictive enough to hurt growth.
This has boosted confidence in the Euro , especially as trade tensions between the EU and the US have eased over the past six months. With market sentiment improving, investors are gradually rotating back into EUR.
On the technical side, the EURUSD H4 chart shows a short-term bottom forming around 1.1530 , followed by a rebound approaching the key resistance zone near 1.1630, which aligns with the descending trendline and Ichimoku cloud.
The price action suggests a likely minor pullback before another push upward , potentially breaking the downtrend that’s been in place since October.
In summary:
As long as the price holds above 1.1530, this recovery phase still has room to grow — and the Euro might just be catching a real tailwind.

Joby Aviation - Breakout Complete - ABC Correction Underway
After a strong impulse wave up, the chart is now tracing a predictable ABC corrective pattern.
My suite of Fibonacci tools—especially the critical 0.786 retracement level—points to a likely downside target near $8 for the completion of wave C.
This is a healthy pullback within the larger bullish trend, offering a potential entry for the next leg up.
Tools used Fib/ Anchored Vwap , volume profile and TPO Chart

When the Data Says EUR/USD Is 89.5% Likely to Go Higher…Most traders stare at price.
We measure the behavior driving it.
What happens when you data-mine market structure itself?
You stop guessing — and start seeing probabilities behind every move.
Structure Lab’s data shows an 89.5% probability that EUR/USD reaches the 50% retracement (EQ) of the prior internal leg — sitting above current price.
Here’s what the data says:
– Swing structure remains bullish (last BOS to the upside)
– Internal structure turned bearish to form the pullback, bottoming Nov 5 in a Phase C configuration (Counter Swing + Pro Internal)
– Now in Phase B (Pro Swing + Counter Internal), pushing higher
Monday printed an inside day — full range inside Friday’s high-low.
Price is drifting lower, stacking buy-side liquidity with descending highs — the kind of structure that often fuels the next impulse.
Three high-probability statistical levels rest above:
1.21%
1.65%
1.78%
(measured from the recent internal low)
Here’s the kicker — 80% of Phase B legs take 5–9 days to complete.
We’re only 2 days in.
The math leans higher.
📊 1-hour timeframe — price as behavior, not noise.
More high-probability setups dropping every week—follow for statistical edges you won't find anywhere else.
Want the full breakdown? Entry trigger, invalidation, and scaling strategy? Drop a "📊" in the comments and I'll share the complete game plan.
Let me know what you want to see more of. 👇

Gold Is Back – As the Fed Weakens, the Metal RisesGold has just surged over 2%, reaching its two-week high, and the reason behind this rally is clear: U.S. economic data is showing signs of weakness, fueling expectations that the Federal Reserve may cut interest rates sooner than expected.
As bond yields decline, demand for non-yielding assets like gold rises sharply. Smart money is once again rotating toward safe havens.
On the technical side, XAUUSD has been moving steadily within an ascending channel over the past several sessions.
Each pullback has been quickly absorbed by buyers, showing that bullish momentum remains in control.
Currently, price is testing the resistance zone around 4170, and if it breaks successfully, the rally could extend toward the 4200 – 4230 area.

Has the price of gold really recovered and increased?⭐️GOLDEN INFORMATION:
Gold (XAU/USD) extends its bullish momentum above the $4,100 level on Tuesday, marking a third straight daily gain and reaching a two-and-a-half-week high near $4,142 during the Asian session. The metal remains supported by concerns over the prolonged US government shutdown and growing expectations of another Federal Reserve (Fed) rate cut in December, both of which continue to fuel demand for the safe-haven asset.
⭐️Personal comments NOVA:
Gold prices have increased above 4140, market excitement as the US government is about to reopen.
⭐️SET UP GOLD PRICE:
🔥SELL GOLD zone: 4198 - 4200 SL 4205
TP1: $4190
TP2: $4175
TP3: $4160
🔥BUY GOLD zone: 4072 - 4070 SL 4065
TP1: $4085
TP2: $4100
TP3: $4120
⭐️Technical analysis:
Based on technical indicators EMA 34, EMA89 and support resistance areas to set up a reasonable BUY order.
⭐️NOTE:
Note: Nova wishes traders to manage their capital well
- take the number of lots that match your capital
- Takeprofit equal to 4-6% of capital account
- Stoplose equal to 2-3% of capital account

GBP/USD – “The Resistance Wall Weighs Heavily on the Bulls”The GBP/USD market is under clear pressure as the U.S. dollar strengthens on expectations that the Federal Reserve will maintain a stable monetary policy stance, while the Bank of England (BoE) sends a more dovish signal amid easing inflation and rising rate-cut pressure. At the same time, the U.K. government’s plan to raise taxes is dampening investor sentiment toward the pound.
On the 4-hour chart, the technical structure reveals a weak rebound within a broader downtrend . Price is hovering around the 1.3150 – 1.3200 zone — a key resistance area aligned with the previous swing high. If the pair fails to break above this level, selling pressure may intensify, pushing prices back toward the 1.3030 support area.
Any short-term rallies in this region are likely to be bull traps, preceding a continuation of the dominant downtrend. Sellers remain firmly in control, especially as fundamentals continue to favor the USD.

EUR/USD Loses Momentum – Sellers Take Back Control!The market is beginning to show clear signs: the U.S. dollar is regaining strength , while EUR/USD faces strong correction pressure after a short-lived recovery. The latest news from the U.S. indicates that sentiment is shifting in favor of the greenback, as expectations for a government reopening and improving economic stability are boosting confidence in the USD.
On the 4H chart, EUR/USD remains in a long-term descending channel , with every pullback to resistance quickly rejected. Recently, price reacted to the upper boundary of the channel around 1.1580, forming a clear rejection signal.
If price fails to break above this zone, the bearish scenario will likely dominate, targeting the 1.1470 support area — a key confluence zone aligning with previous lows and the lower trendline. Sellers may look to add positions on minor retracements as the overall bearish structure remains intact.
In summary, with fundamentals supporting a stronger USD and technical patterns confirming a bearish setup , EUR/USD is expected to stay under downside pressure in the short term — unless a decisive breakout above 1.1580 occurs.

LAST BIT OF THE LEG TO THE UPSIDE THEN DUMPOANDA:XAUUSD
Currently, I have a pending long position waiting to trigger at 4090.250. This level represents the 50% retracement between the recent Higher High (HH) and Higher Low (HL) — a zone where price often finds strong support during a healthy uptrend. The logic here is that the market may retrace halfway through its previous impulsive leg before resuming its upward momentum.
My stop loss is placed just below the last Higher Low at 4074.400, specifically at 4071.400.
This placement gives the trade some breathing room to absorb minor fluctuations, while still maintaining a disciplined exit point if the market structure breaks.
It’s a well-structured OANDA:XAUUSD
Currently, I have a pending long position waiting to trigger at 4090.250. This level represents the 50% retracement between the recent Higher High (HH) and Higher Low (HL) — a zone where price often finds strong support during a healthy uptrend. The logic here is that the market may retrace halfway through its previous impulsive leg before resuming its upward momentum.
My stop loss is placed just below the last Higher Low at 4074.400, specifically at 4071.400.
This placement gives the trade some breathing room to absorb minor fluctuations, while still maintaining a disciplined exit point if the market structure breaks.
It’s a well-structured stop — tight enough to protect capital, but not so close that normal volatility knocks the trade out prematurely.
If the trade activates and begins to move in my favor, the profit target is set near 4126, which aligns closely with the prior Higher High zone. This level represents the next key resistance area, and taking profits there is a smart way to capture gains before the market potentially pauses or reverses.
Expected Market Behavior After the Target
Once price reaches the 4126 region, I anticipate a potential pullback or correction. This could happen either rapidly or as a gradual decline, depending on market momentum and volume conditions at the time.
The corrective zone I’ll be watching is between 3950–3960, an area that may offer another opportunity for strategic LONG entries once price stabilizes.
This projected decline aligns with the natural ebb and flow of market cycles — impulsive moves followed by retracements. Traders should be cautious around this region, as volatility may increase and sentiment could shift quickly.
Key Levels Recap
Level Type Description
4090.250 Entry 50% retracement from HH–HL, ideal long setup zone
4071.400 Stop Loss Below HL (4074.400), invalidation point for the setup
4126.000 Target Retest of the HH / resistance area
3950–3960 Watch Zone Potential correction target after reaching 4126
Final Notes & Trader Caution
This setup has a clear structure, logical entry, and disciplined stop — all the hallmarks of a professional plan. However, it’s crucial to emphasize:
⚠️ Do not enter emotionally.
Wait patiently for price to retrace into your zone. If the market fails to return to that level and continues higher, let it go — there will always be another setup. Emotional chasing often leads to poor entries and unnecessary losses.
Monitor price action closely as it approaches 4126. If signs of exhaustion (like equal highs or divergence) appear, that’s your cue that the next leg down toward 3950/3960 may be developing.stop — tight enough to protect capital, but not so close that normal volatility knocks the trade out prematurely.
If the trade activates and begins to move in my favor, the profit target is set near 4126, which aligns closely with the prior Higher High zone. This level represents the next key resistance area, and taking profits there is a smart way to capture gains before the market potentially pauses or reverses.
Expected Market Behavior After the Target
Once price reaches the 4126 region, I anticipate a potential pullback or correction. This could happen either rapidly or as a gradual decline, depending on market momentum and volume conditions at the time.
The corrective zone I’ll be watching is between 3950–3960, an area that may offer another opportunity for strategic LONG entries once price stabilizes.
This projected decline aligns with the natural ebb and flow of market cycles — impulsive moves followed by retracements. Traders should be cautious around this region, as volatility may increase and sentiment could shift quickly.
Key Levels Recap
Level Type Description
4090.250 Entry 50% retracement from HH–HL, ideal long setup zone
4071.400 Stop Loss Below HL (4074.400), invalidation point for the setup
4126.000 Target Retest of the HH / resistance area
3950–3960 Watch Zone Potential correction target after reaching 4126
Final Notes & Trader Caution
This setup has a clear structure, logical entry, and disciplined stop — all the hallmarks of a professional plan. However, it’s crucial to emphasize:
⚠️ Do not enter emotionally.
Wait patiently for price to retrace into your zone. If the market fails to return to that level and continues higher, let it go — there will always be another setup. Emotional chasing often leads to poor entries and unnecessary losses.
Monitor price action closely as it approaches 4126. If signs of exhaustion (like equal highs or divergence) appear, that’s your cue that the next leg down toward 3950/3960 may be developing.

Gold (XAU/USD) – Combined Daily & 1H AnalysisBias: Bullish continuation
Key Level to Watch: 4,083.33 USD
Gold continues to show strong bullish momentum following last week’s reversal from sub-4,000 zones. On the daily timeframe, price printed a clean bullish candle, confirming buyer dominance. The 1-hour chart reinforces this strength — despite short-term pullbacks, buyers are consistently defending higher lows above 4,041 and 4,083.
Technical Context
• Trend: Short-term uptrend with renewed bullish structure
• Daily Resistance zone: 4,100 – 4,150
• 1H Resistance zones: 4,097.66 → 4,101.80 → 4,110
• Support zones: 4,083 → 4,041
• Structure: Minor retracement within an ongoing breakout sequence; price holding firm above prior resistance now acting as intraday support
Trading Plan
Monitor 4,083 as the intraday decision level — a sustained hold above this zone supports continuation toward 4,101 and 4,150.
A close below 4,041 would signal weakening momentum and open the path for a short-term correction before potential re-entry opportunities emerge.

Scalp Long – ZEREBRO🚀 Scalp Long – ZEREBRO
Price has broken out of the descending triangle and completed a successful retest. It is now holding above a strong support zone, signaling potential for a short-term rebound.
🎯 Trade Setup:
Take Profit (TP): 0.04492
Stop Loss (SL): 0.04098
Risk/Reward Ratio (RR): 1 : 2.72
A clean long setup based on breakout confirmation, strong support, and early signs of a bullish recovery.

Gold Rebounds Strongly – Preparing to Target the $4,100 Mark!Gold is showing strong signs of recovery and confirming a clear bullish trend . After a volatile week, price action has been consistently forming higher lows along the ascending trendline, indicating that buyers are firmly in control of the market.
At the moment, gold is holding steady around $4,040/oz, maintaining a solid upward structure . Each retest of the trendline has triggered a strong bullish reaction , showing that buyers are defending the trend aggressively. The $4,010 zone now acts as a key support level for this rally.
If price makes a minor pullback to the trendline, it could be an ideal entry opportunity before the next leg higher toward $4,100 — a zone that aligns with critical technical resistance . Once gold breaks above $4,100, momentum could extend toward $4,150 or higher.
In the short term, fundamentals continue to favor the bulls: a weaker USD, expectations of Fed rate cuts, and rising safe-haven demand. Together, these forces are building a solid foundation for gold to soar even higher in the coming sessions.

BTC slightly recovered at the beginning of the weekBTC/USD Technical Analysis – Clear and Simple Explanation for Clients
Bitcoin is currently trading around 106,000, showing a short-term bullish correction within a larger downtrend channel. The overall market structure remains bearish, but the current upward move is a retracement toward a strong resistance zone.
🔹 Key Resistance Zone: 109,500 – 111,000
This area combines several important confluences:
The downtrend line from previous highs.
The Fibonacci 0.382–0.5 retracement zone of the last bearish swing.
The EMA 200 (red line), which has acted as a strong dynamic resistance before.
Once the price reaches this zone, there is a high chance of a bearish rejection, as sellers will likely take control again.
🔹 Main Scenario:
Short-term: Price may continue rising toward 109,000–111,000.
Medium-term: If rejection occurs, we expect a new downward move targeting the next key support around 95,000–94,800 (Fibonacci 1.618 extension + previous demand zone).
Long-term: This support could become a strong buy zone for a potential trend reversal.
📊 Summary for Clients:
Current trend: Bearish channel, short-term pullback.
Resistance zone: 109,500–111,000 (possible sell area).
Support zone: 95,000–94,800 (potential buy area).
Outlook: Expect short-term rise, then possible drop before a bigger rebound.
👉 In simple terms: Bitcoin is making a temporary recovery, but the main downtrend is not over yet. Watch for a sell reaction around 109k–111k, and a possible strong bounce from 95k support later.

Bullish RSI Divergence - Time to buy ADBE?Every Saturday I open the weekly charts. The first chart I opened this week was ADBE.
I think ADBE stock has been unfairly battered recently. The revenue has been steadily rising despite the stock price dropping. That itself is a bit of bullish divergence.
Also, it needs mentioning that I'm photographer by trade. I use ADBE products every day. I understand the competition they're now facing. I also understand that for the past 20 years, every time a new product has come out with a feature drawing people away, ADBE has added it quickly and made that other program useless. Moreover, while all other stocks are getting high valuations, ADBE is being hurt by it - despite their AI development being top notch.
ADBE has a forward P/E somewhere around 15x. That's great value.
Ok, so let's go over to the chart and see why I think it's time to start accumulating ADBE.
1. Price action is in a falling wedge. This is bullish pattern. It means that the selling pressure is slowly dying off. Eventually, these patterns generally break upwards
2. Ancient support. There's a lot of support here from late 2022 and 2023.
3. There's bullish divergence on the RSI. The last time there was bullish divergence was around April 2022. When that happened, the price $334 to $450 in a couple months. Of course, afterwards it crashed down with everything else on the market in the summer (from $450 down to $273). After that bottom, it went on a wild rally from $273 to $630 over the following 14-16 months.
So here we are, will history repeat? I'm going to start DCA'ing a position on Monday. But I won't be doing a traditional DCA. More a RDCA (Red Day Cost Average), any day ADBE closes red, I'll add.
I have 2 targets:
- Target 1 = $415 where the neckline is of the double bottom pattern).
- Target 2 = $480 there's a volume gap up to $480 if the pattern breaks.
I'll go active here on Monday, and update every time I add.

Gold price recovers, back to 4100⭐️GOLDEN INFORMATION:
Gold price (XAU/USD) rises to around $4,050 during the Asian trading hours on Monday. The precious metal edges higher amid uncertainty over the US economic outlook. Traders ramped up bets on a US rate cut following weak US private jobs data and a downbeat University of Michigan (UoM) Consumer Sentiment Index survey. Lower interest rates could reduce the opportunity cost of holding Gold, supporting the non-yielding precious metal.
On the other hand, signs that the US government shutdown may end could undermine safe-haven assets such as Gold. US senators are voting on a deal on Monday that could end the longest government shutdown in history. Furthermore, easing trade tensions between the US and China, the world’s two largest economies, could also drag the yellow metal lower in the near term.
⭐️Personal comments NOVA:
Gold prices recovered at the beginning of the week, breaking resistance and increasing in price.
⭐️SET UP GOLD PRICE:
🔥SELL GOLD zone: 4085 - 4087 SL 4092
TP1: $4070
TP2: $4060
TP3: $4050
🔥BUY GOLD zone: 3957 - 3955 SL 3950
TP1: $3970
TP2: $3985
TP3: $4000
⭐️Technical analysis:
Based on technical indicators EMA 34, EMA89 and support resistance areas to set up a reasonable BUY order.
⭐️NOTE:
Note: Nova wishes traders to manage their capital well
- take the number of lots that match your capital
- Takeprofit equal to 4-6% of capital account
- Stoplose equal to 2-3% of capital account

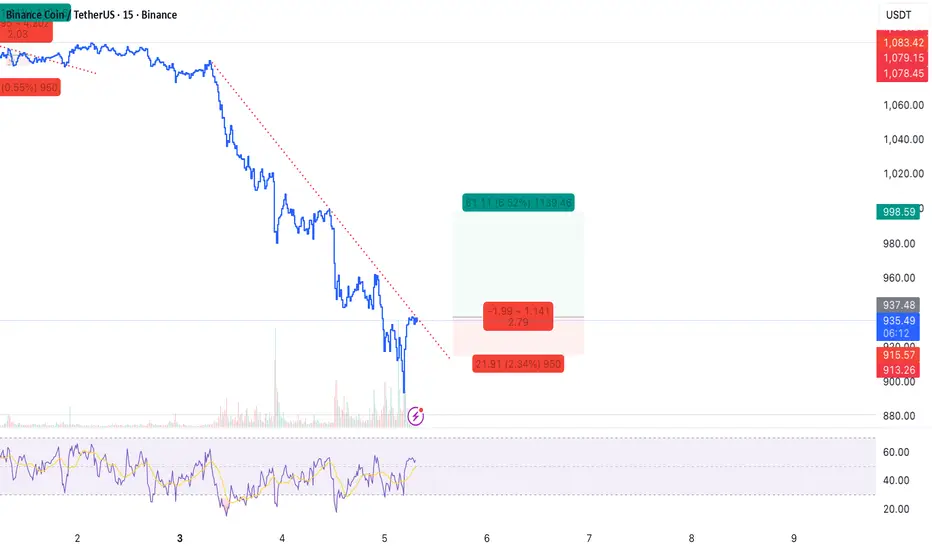
Scalp Long – BNB💎 Scalp Long – BNB
Price is consolidating before a potential breakout from the current downtrend. RSI remains in the buying zone, and strong buying volume indicates growing bullish momentum. A decisive breakout could trigger a sharp upward move with a favorable risk–reward setup.
🎯 Trade Setup:
→ TP: 998.6 | SL: 915.57 | RR: 1 : 2.79
Technical alignment between momentum, volume, and structure supports a high-probability long setup, aiming for a clean breakout continuation.
AUDUSD 15M analysisIf price takes IDM we can buy in OB .
or we can buy in extreme OB.
Also we can sell in D POI .
Pay attention: Use low timeframe confirmation and risk management .
We are not responsible for your losses or profits.

Opendoor Technologies Big Correction coming ?In this video I explore the recent explosion in the price of Opendoor Technologies .
Still along way off its All time highs but up some 2000% from the past few months alone
I analyse what could be a very key zone to build upon .
Tools used Fibs, VPR, VWAP, TPO Chart

Opendoor Technologies Big Correction coming ? Part 2 In this video I cover what was originally anticipated in the first Opendoor video that i published in October and what we can expect moving forward .
I still have the same targets as specified in the first video with alerts set .

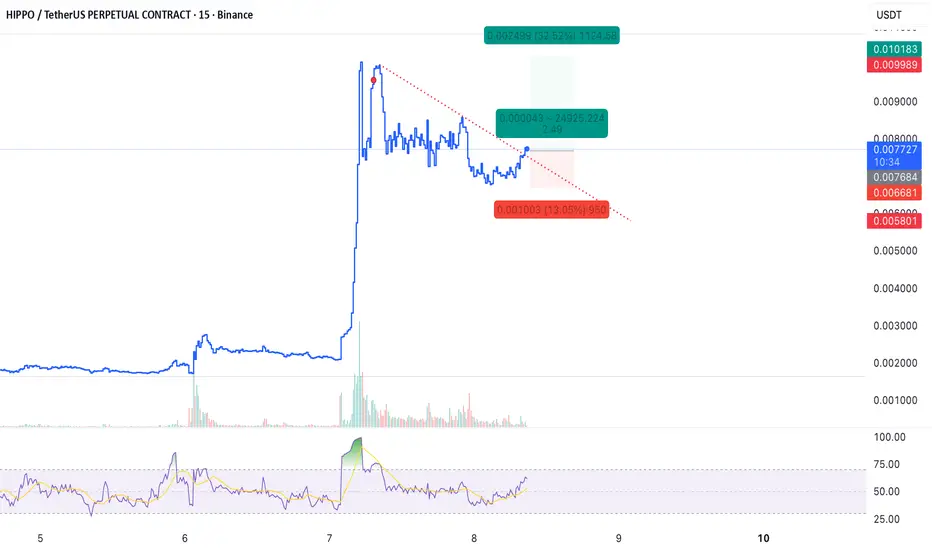
Scalp Long – HIPPO 📈 Scalp Long – HIPPO
The price has broken out of its correction zone, with buying volume returning and bullish momentum building. Price action suggests a move to retest the previous high.
🎯 Trade Setup:
Take Profit (TP): 0.0168
Stop Loss (SL): 0.6681
Risk/Reward Ratio (RR): 1 : 2.49
A clean long setup supported by renewed buying pressure and momentum aiming toward a local high retest.
Scalp Long – IN📈 Scalp Long – IN
Price has successfully broken the downtrend and completed a clean retest. RSI has returned to the buying zone, signaling renewed bullish momentum. A potential move to retest the local high is anticipated.
🎯 Trade Setup:
Take Profit (TP): 0.10526
Stop Loss (SL): 0.09694
Risk/Reward Ratio (RR): 1 : 2.68
A solid long setup backed by trend reversal confirmation, RSI recovery, and growing bullish sentiment — favoring a short-term push toward local resistance.

GU BullishI've mostly seen that EU and GU run parallel to each other, Dxy is going to be bearish for few weeks so I'm bullish on GU for few weeks.
