Gold price recovers, back to 4100⭐️GOLDEN INFORMATION:
Gold price (XAU/USD) rises to around $4,050 during the Asian trading hours on Monday. The precious metal edges higher amid uncertainty over the US economic outlook. Traders ramped up bets on a US rate cut following weak US private jobs data and a downbeat University of Michigan (UoM) Consumer Sentiment Index survey. Lower interest rates could reduce the opportunity cost of holding Gold, supporting the non-yielding precious metal.
On the other hand, signs that the US government shutdown may end could undermine safe-haven assets such as Gold. US senators are voting on a deal on Monday that could end the longest government shutdown in history. Furthermore, easing trade tensions between the US and China, the world’s two largest economies, could also drag the yellow metal lower in the near term.
⭐️Personal comments NOVA:
Gold prices recovered at the beginning of the week, breaking resistance and increasing in price.
⭐️SET UP GOLD PRICE:
🔥SELL GOLD zone: 4085 - 4087 SL 4092
TP1: $4070
TP2: $4060
TP3: $4050
🔥BUY GOLD zone: 3957 - 3955 SL 3950
TP1: $3970
TP2: $3985
TP3: $4000
⭐️Technical analysis:
Based on technical indicators EMA 34, EMA89 and support resistance areas to set up a reasonable BUY order.
⭐️NOTE:
Note: Nova wishes traders to manage their capital well
- take the number of lots that match your capital
- Takeprofit equal to 4-6% of capital account
- Stoplose equal to 2-3% of capital account
Longsetup

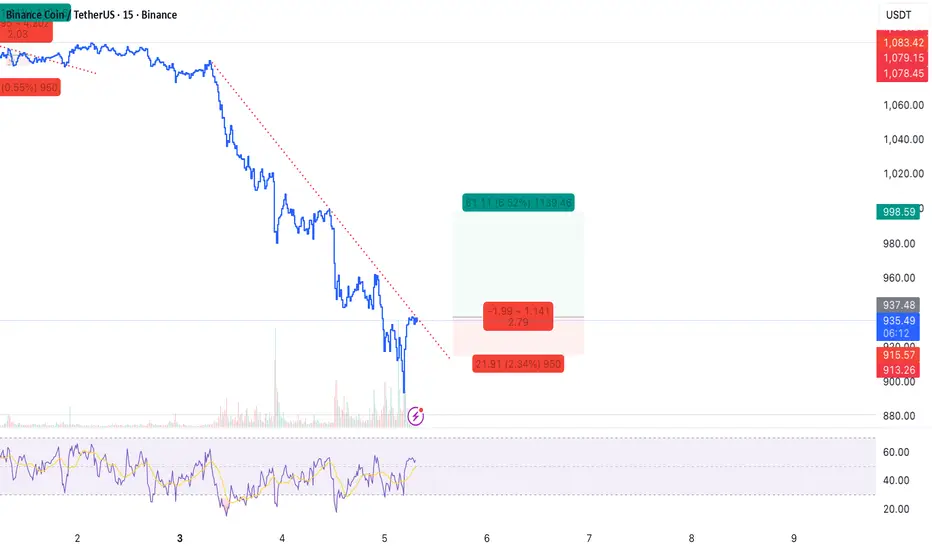
Scalp Long – BNB💎 Scalp Long – BNB
Price is consolidating before a potential breakout from the current downtrend. RSI remains in the buying zone, and strong buying volume indicates growing bullish momentum. A decisive breakout could trigger a sharp upward move with a favorable risk–reward setup.
🎯 Trade Setup:
→ TP: 998.6 | SL: 915.57 | RR: 1 : 2.79
Technical alignment between momentum, volume, and structure supports a high-probability long setup, aiming for a clean breakout continuation.
AUDUSD 15M analysisIf price takes IDM we can buy in OB .
or we can buy in extreme OB.
Also we can sell in D POI .
Pay attention: Use low timeframe confirmation and risk management .
We are not responsible for your losses or profits.

Opendoor Technologies Big Correction coming ?In this video I explore the recent explosion in the price of Opendoor Technologies .
Still along way off its All time highs but up some 2000% from the past few months alone
I analyse what could be a very key zone to build upon .
Tools used Fibs, VPR, VWAP, TPO Chart

Opendoor Technologies Big Correction coming ? Part 2 In this video I cover what was originally anticipated in the first Opendoor video that i published in October and what we can expect moving forward .
I still have the same targets as specified in the first video with alerts set .

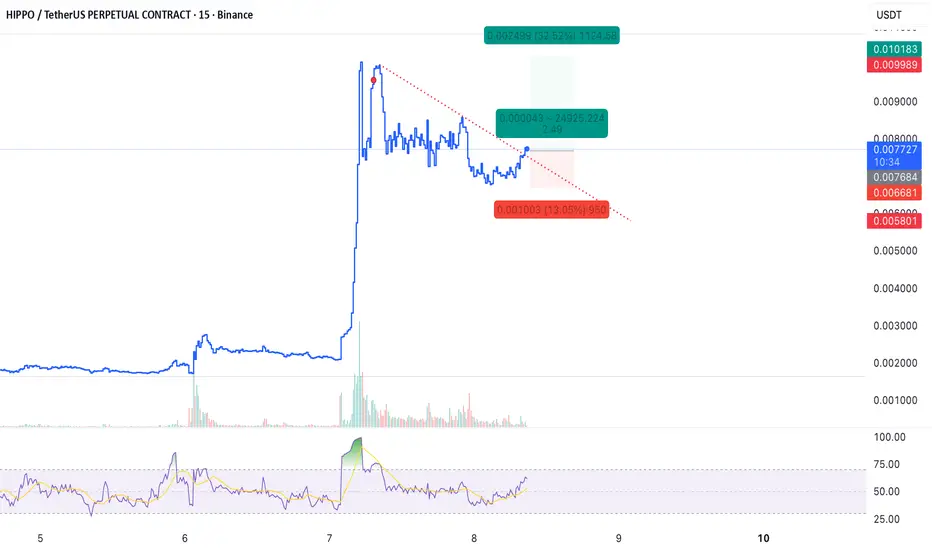
Scalp Long – HIPPO 📈 Scalp Long – HIPPO
The price has broken out of its correction zone, with buying volume returning and bullish momentum building. Price action suggests a move to retest the previous high.
🎯 Trade Setup:
Take Profit (TP): 0.0168
Stop Loss (SL): 0.6681
Risk/Reward Ratio (RR): 1 : 2.49
A clean long setup supported by renewed buying pressure and momentum aiming toward a local high retest.
Scalp Long – IN📈 Scalp Long – IN
Price has successfully broken the downtrend and completed a clean retest. RSI has returned to the buying zone, signaling renewed bullish momentum. A potential move to retest the local high is anticipated.
🎯 Trade Setup:
Take Profit (TP): 0.10526
Stop Loss (SL): 0.09694
Risk/Reward Ratio (RR): 1 : 2.68
A solid long setup backed by trend reversal confirmation, RSI recovery, and growing bullish sentiment — favoring a short-term push toward local resistance.

GU BullishI've mostly seen that EU and GU run parallel to each other, Dxy is going to be bearish for few weeks so I'm bullish on GU for few weeks.

SOLUSD - Bullish Structure eyeing 160+ TargetPrice is currently retesting a key resistance zone around 158.20–158.60, an area that has rejected price multiple times. The market has formed a series of higher lows, showing increasing bullish momentum as buyers continue to step in earlier on each pullback.
If price can break and close above this resistance zone with strong volume, it would confirm a potential bullish breakout, opening the path toward the next imbalance/target zone around 160.50–162.00.
However, failure to break above may result in another short-term pullback into support, so confirmation is important.
Bullish Bias as long as price holds above the higher-low structure
Breakout above resistance = continuation toward target zone
Watch for rejection candles or weak breakout attempts

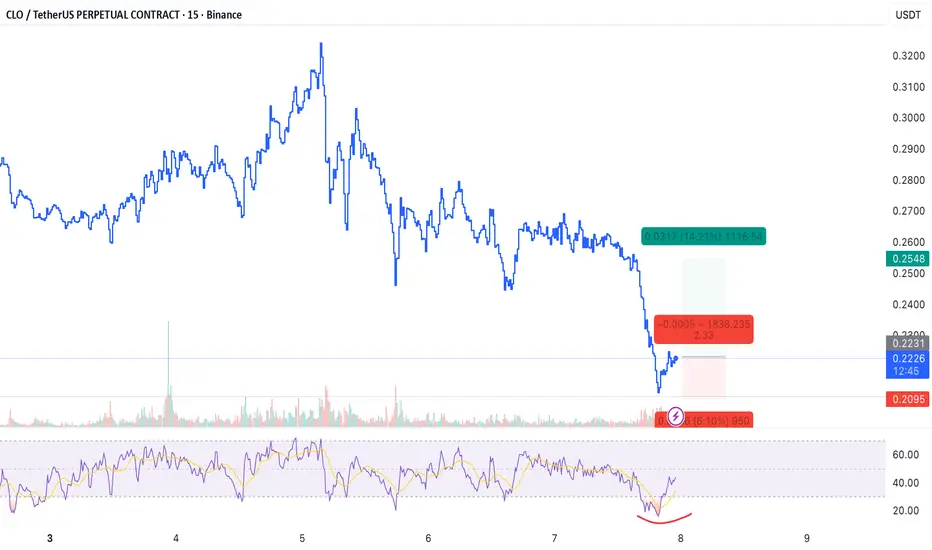
Scalp Long – CLO📈 Scalp Long – CLO
RSI shows strong oversold conditions across multiple timeframes. Buying volume is rising sharply on lower timeframes, indicating renewed inflow of capital into Alpha coins. Price action suggests a potential recovery forming.
🎯 Trade Setup:
Take Profit (TP): 0.2548
Stop Loss (SL): 0.2095
Risk/Reward Ratio (RR): 1 : 2.33
A clean, high-probability long setup supported by increasing buying pressure and multisector capital inflow.
Scalp Long – WCT📈 Scalp Long – WCT
Price is showing strong bullish momentum with continuous buying volume. RSI has returned to the buying zone, indicating renewed strength. A move to retest the local high is likely.
🎯 Trade Setup:
Take Profit (TP): 0.1398
Stop Loss (SL): 0.121
Risk/Reward Ratio (RR): 1 : 2.1
A clean long setup backed by strong momentum, rising volume, and technical confirmation of a potential local high retest.

RISK MANAGEMENT – How Pros Stay AliveIf you’ve traded long enough, you’ll realize this:
Nobody blows up their account because of a bad prediction — they blow it up because they don’t know when to stop.
1. The First Survival Rule: Set a FIXED RISK Per Trade
Choose a fixed risk percentage that you’re comfortable with — 1%, 2%, or a maximum of 3% per trade.
That means:
If you have a $1,000 account and risk 2%, you can only lose $20 per trade .
Even if you lose 5 trades in a row, you still have 90% of your account to keep fighting.
Never increase your lot size because of a “gut feeling.”
Traders don’t lose because they analyze wrong — they lose because they increase risk when they feel too confident.
2. Set STOP LOSS with Logic, Not Emotion
Don’t place your stop loss “just to have one.”
Your stop loss should be at the point where, if price hits it, your idea is truly invalidated — not because you’re afraid of getting stopped out early.
Example:
If you’re buying in an uptrend, your SL should be below the last higher low , not just below the last red candle.
If your SL is 30 pips and you want to risk 2%, then your position size = 2% of your account ÷ 30 pips.
This formula keeps your trades balanced and prevents those small, annoying blow-ups.
If you don’t know exactly how much you’re risking per trade — you’re not really trading. You’re gambling.
3. No Overloading, No Revenge Trading
One of the fastest ways to blow up an account is adding more trades while losing .
The market doesn’t care how much you’re down — it only cares how much you still have left to lose.
Pro traders do the opposite:
When the trade moves in their favor → they trail the stop and lock profits.
When the trade goes wrong → they cut it quickly, no questions asked.
That’s why they last longer — they trade small when uncertain and go big only when the odds are clearly on their side.
4. Emotional Control = The Extension of Risk Management
Risk management isn’t just about numbers — it’s about discipline.
If you just took a loss and still want to “jump back in to make it back” — stop immediately.
No analysis, no revenge trade.
Just close the chart, grab a drink, take a walk, or hit the gym.
Because once emotions take over, no system in the world can save you .
5. Turn Risk Management into a Strategic Weapon
When you have your risk under control, you trade with a cold mind.
That’s when you can actually take advantage of big opportunities .
Example:
You risk 2% per trade and find a setup with R:R = 1:4.
If it wins, you make +8%. If it loses, you only lose -2%.
Even if you’re right just 3 out of 10 times — you’re still profitable.
That’s how pro traders make a living.
They don’t need an 80% win rate — they just need consistency and control.
💬 A Simple Drill for You:
For every trade, write this down:
“How much % am I willing to lose if I’m wrong?”
If you can’t answer within 5 seconds → don’t take that trade.
If you’re still losing because of discipline issues → restart by focusing only on limiting risk before thinking about profit.

AUD/USD Slips: Heading Towards 0.64400?AUD/USD is currently in a downtrend after failing to break through the resistance at 0.65000. Latest data from the RBA and the weakening of the USD have created resistance for the AUD. With the Federal Reserve not planning to cut interest rates immediately, the stronger USD is putting pressure on the AUD.
With the next support level at 0.64400, this pair could continue its decline in the short term. If this support level is broken, the downtrend may extend further.
Traders should closely monitor these support and resistance levels to optimize trading opportunities, especially with the market being influenced by interest rate policies and global economic factors.

EUR/USD Is Recovering: Breaking 1.1570, Heading Toward New HighsEUR/USD is currently in the process of recovering after hitting strong support at 1.1500. This is a positive sign as the price is bouncing back from the lows and beginning to build upward momentum. While it is still within a descending channel, the price breaking the 1.1530 resistance level indicates a potential continuation of the upward trend in the short term.
The next key resistance level is 1.1570. If the price can break through this level and hold above it, EUR/USD could continue its strong upward move, opening up opportunities to reach new highs. However, if the price fails to stay above 1.1500, the possibility of a pullback to that support level remains high.
Given the current trend, if EUR/USD successfully breaks through 1.1570, the pair could continue to move higher, creating favorable long-term trading opportunities for investors.

Scalp Long – COOKIE📈 Scalp Long – COOKIE
Price has fully broken out of the downtrend, signaling a potential shift in momentum. RSI is in the buying zone, and price action confirms signs of recovery. Momentum is aligning for a bullish move.
🎯 Trade Setup:
TP: 0.076
SL: 0.0657
RR: 1 : 2.81
A clean breakout-based long setup, supported by strong RSI confirmation

Scalp Long – SXP💎 Scalp Long – SXP
Price has broken out of the descending channel and completed its retest successfully. RSI is in the buying zone, while buying volume continues to rise sharply, confirming bullish momentum.
🎯 Trade Setup:
→ TP: 0.1108 | SL: 0.098 | RR: 1 : 3.13
Structure, momentum, and volume are aligned — suggesting a strong upside continuation as SXP begins its recovery phase.

Macroeconomics and Investor Psychology Driving Gold PricesFirstly, macroeconomic policies , particularly monetary policy moves by the U.S ., will continue to have a significant impact on gold prices. Specifically, the upcoming decisions by the Federal Reserve (Fed) regarding interest rate cuts are expected to create positive momentum for gold, as investors turn to gold as a safe-haven asset in a low-interest-rate environment.
Secondly, the independence of the Fed is a key factor, not only directly influencing confidence in the USD but also strongly affecting trust in U.S. institutions. The stability and transparency of the Fed's policy decisions will continue to create significant market volatility, directly impacting gold prices.
In addition, gold is becoming increasingly attractive to investors due to the combination of two key factors. First, the increasing national debt in many countries is becoming a major risk, as global fiscal sustainability is in question, making gold a more reliable safe-haven asset. Second, the erosion and weakening of international systems and standards have led to diminishing confidence in financial systems and international approaches. This has further strengthened gold's position as a safe asset in the eyes of investors.
Another important factor influencing gold prices is the psychology of seeking global risk hedging . In the context of concerns about "bubbles" in the AI technology sector , if AI technology proves to be a bubble and bursts, gold and other assets will become even more attractive as strategic safe-haven assets.
With all these factors in play, gold is not only an attractive investment choice but also a strategic asset during times of financial and global economic instability.

AUDJPYBuy Long Call 15 min
AUDJPY
Pls book profits
Bullish divergence obserevd but smaller time frame

Swing Trade on AUDNZD, Long @ 1.1517 EntryIBKR:AUDNZD Price has recently broken through the SR level @ 1.1433 and this level has been retested & held; we're now waiting for the continuation.
Look for an entry at 1.1517 , stop below the zone at 1.1426 , target 1.1750 (2:1). There'll be slight upside resistance, which might cause a bit of choppiness/consolidation at the psych level @ 1.1600, but the overall trend is up, and we're trading well above the Daily MA200 & Weekly MA200.
Fundamentally, we're looking good and expecting further upside on the pair both short and medium-term:
RBA has paused whilst RBNZ is easing, widening Australia's yield edge in the near term; over hte next 3-6 months Australia's rates will likely remain above New Zealand's as RBNZ cuts further.
AU inflation surprised higher while NZ inflation eased amid weak growth. Stronger AU inflation/growth momentum vs sluggish NZ suggests medium-term AUD outperformance.
Strong Chinese iron-ore and wider critical minerals demand supports AUD while NZ's dairy prices and exports have softened.
Key Catalysts (forward-dated):
2025-11-05 — RBA policy decision — Expected: Bullish
2025-11-26 — RBNZ monetary policy meeting — Expected: Bullish
2026-02-03 — RBA monetary policy meeting — Expected: Bullish
2026-02-18 — RBNZ monetary policy meeting — Expected: Bullish

XAUUSD – Gold Holds Its Momentum, Targeting 4,150 USDAfter a period of volatility, gold is gradually regaining its upward momentum as investors shift toward safe-haven assets despite strong U.S. employment data. This indicates that defensive capital flow continues to support the bullish outlook for the precious metal.
On the 4H timeframe, price remains well-supported along the ascending trendline, showing that buyers are still in control. Currently, gold is approaching the 4,100 USD zone, and if a breakout occurs, the next target will be around 4,150 USD — a key resistance area that aligns with the previous highs, where potential profit-taking could emerge.
Conversely, the 3,970 USD level remains a crucial support zone. As long as price holds above this level, buyers will maintain their short-term advantage.
Gold continues to show strength and resilience — a positive sign for its journey toward new highs.

Gold Rebounds Before the Big Drop?Hello traders,
Gold prices edged slightly higher in the mid-week session despite stronger-than-expected U.S. employment data. However, this rise appears to be just a technical pullback, as capital continues to flow into safe-haven assets like the USD.
The ADP report showed that the U.S. private sector added 42,000 jobs, well above the forecast of 32,000, while the ISM Services PMI came in at 52.4, higher than expectations. These figures reinforce the view that the U.S. economy remains resilient, making it harder for the Fed to cut interest rates soon — a factor that puts pressure on gold.
From a technical perspective, gold remains below the descending trendline, with the $4,000 level acting as strong resistance. Each touch of this trendline has led to sharp rejections.
The current scenario suggests gold may retrace slightly to $4,000, then turn lower toward $3,950, where temporary dip-buying interest could emerge.

Tempus AI — Is This Where Time Turns Bullish Again?Fundamental View
Tempus AI (NASDAQ: TEMP) continues to attract attention with major partnerships in the AI and biotech space — including collaborations with AstraZeneca, Illumina, and Boehringer Ingelheim.
These deals strengthen its role in using AI for diagnostics and drug development, giving it strong long-term growth potential.
However, as a newly listed and high-growth company, short-term volatility remains likely.
Technical View
Price has made a sharp retracement into the golden OTE zone ($72–$63), overlapping a high-probability Fair Value Gap (FVG) and the weekly bullish Order Block (OB).
This zone represents a key area of interest where smart money could accumulate.
Safer traders will wait for confirmation signals within this zone, while aggressive entries could scale in early with managed risk.
Upside targets are $103 for partial profit and $155 for a full swing continuation.
Outlook
Tempus sits at a critical turning point — strong fundamentals meet a high-probability technical setup.
If the golden zone holds, a bullish reversal could unfold toward major liquidity levels.
Patience and confirmation remain key before full commitment.
⚠️ Disclaimer: This breakdown is for educational and entertainment purposes only. It is not financial advice — always DYOR and trade responsibly.

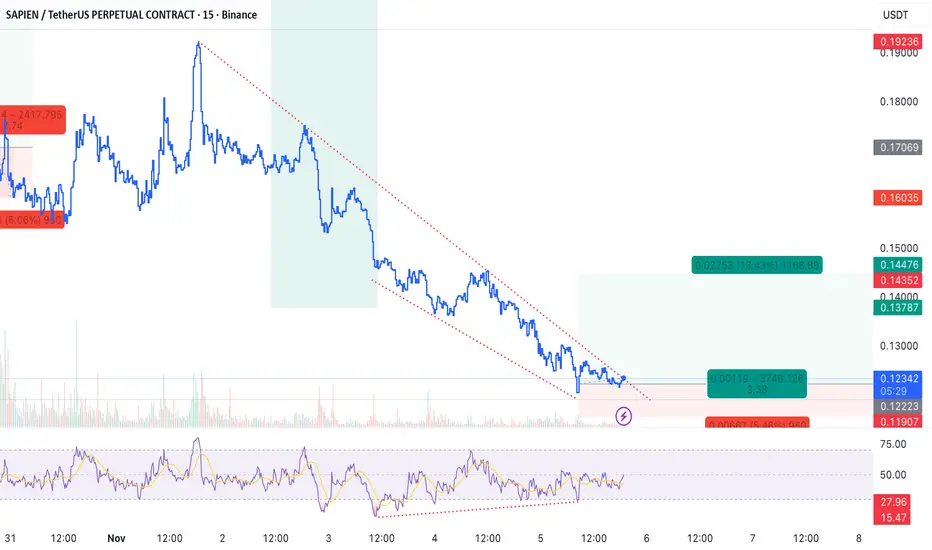
Scalp Long – SAPIEN💎 Scalp Long – SAPIEN
Price has broken out of the descending channel and is now sitting on a strong support zone. A bullish divergence has formed, signaling a potential reversal setup. Buying volume is rising sharply, confirming renewed market interest.
🎯 Trade Setup:
→ TP: 0.14476 | SL: 0.1155 | RR: 1 : 3.38
Momentum, structure, and volume are aligned — indicating a high-probability long opportunity as SAPIEN looks ready to recover.