MANA - Scalp Long🎯 Trade Setup – LONG
Reason: RSI is in the buy-zone (momentum shifting). Trendline of short-term downtrend is preparing to break. Price is being supported at a buying zone.
Entry scenario: After confirmed break of the short-term down-trendline + support hold.
TP (Take Profit): 0.2458
SL (Stop Loss): 0.2286
Risk/Reward: ~ 1 : 2.6
📌 Key technical confirmation
Use the Relative Strength Index (RSI) to validate momentum shift; RSI should back the bullish thesis.
Mind Math Money
+1
Confirm trendline has been broken or about to break, because a broken downtrendline often signals reversal.
goodcryptoX
+1
Ensure price is anchored by a support zone – this gives the stop-loss validity and the risk structure clear.
✅ Conclusion
This is a clean long-setup: momentum + structural breakout + support in place. With R:R of ~1 : 2.6, the trade has attractive reward potential relative to risk.
But discipline matters—only execute after your breakout confirmation, stick to SL, and don’t over-size.
Let me know if you’d like the same format for another coin or a different timeframe.
Longsetup

BTC accumulates and starts to recoverBitcoin (BTC/USD) – Daily Analysis
BTC continues to trade within a broad ascending channel, currently rebounding strongly from the key demand zone around 106,000–108,000. This zone has acted as a major liquidity area where buyers have repeatedly stepped in to defend price.
After forming a double rejection at the lower channel boundary, BTC has reclaimed the EMA 34 and is now attempting to stabilize above 110,000, signaling early bullish recovery momentum.
If buyers can maintain price action above 110,000, the next resistance levels to watch are:
113,000–114,000: confluence of EMA 89 + prior structure resistance.
126,000–127,000: upper trendline of the ascending channel and potential medium-term target.
Technical Outlook:
Price respected long-term ascending channel support.
EMAs show potential for a bullish crossover if momentum continues.
Higher low formation supports a recovery scenario.
Bullish Scenario:
Holding above 110,000 would confirm strength, with possible continuation toward 113,000 → 126,000.
Bearish Scenario:
Failure to hold 108,000 could trigger a deeper retracement toward 106,000 or even 102,000 (next demand zone).

COPPER — 5.064 Long, Confluence and stacked oddsCMCMARKETS:COPPERZ2025
Fundamental: Bullish (5 Stacks) — supply disruptions and China demand.
Technical: Bullish (6 Stacks) — above EMAs, ADX 20.6, RSI 60.8.
Summary: Strong alignment; industrial momentum intact. Actionable Bullish Trade above 5.05.
Stop Loss: 4.96 Take Profit: 5.19 (~0.07 ATR × 1.52 / 2.6 R reward).

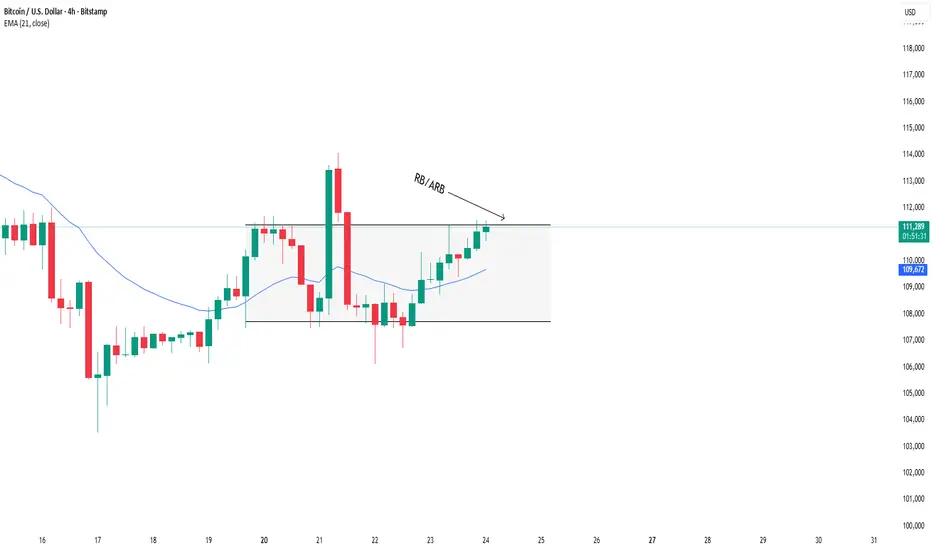
BTCUSD: Waiting for breakout confirmation near the range highBTCUSD – Analysis for October 24, 2025
Yesterday, we had two trading setups for BITSTAMP:BTCUSD .
The IRB setup played out as planned when the price rebounded from the EMA, formed a consolidation zone within the range, and then broke out strongly, pushing up toward the upper boundary of the range.
This move shows that bullish momentum is still present, although the resistance near the range high remains a key area where short-term profit-taking may occur.
Today’s Trading Plan
Wait for the price to compress and form a tight consolidation zone near the upper boundary of the range.
Confirmation condition: No candle closes below the EMA, which would confirm that buying pressure remains in control.
Once a RB or ARB setup appears, that will be our signal to enter long positions.
Bullish Scenario (primary bias):
Entry: On confirmed RB/ARB setup near the upper edge of the range
Stop Loss: Below the nearest EMA
Take Profit: Targeting extended resistance levels above the range
Alternative Scenario:
If the price closes below the EMA and breaks the compression structure, we’ll stay out of the market and wait for a new setup once the structure stabilizes.
Summary
BTC continues to show strength, but the upper range boundary remains a key test.
Today’s plan: Wait – Confirm – Execute. Avoid FOMO until a clear confirmation appears.
Daniel Miller @ ZuperView
Can BTC Break $111,458 resistance ? - BTC 1H Analysis | Day 9👋🏻 Hey everyone! Hope you’re doing great! Welcome to SatoshiFrame channel.
✨ Today we’re diving into the 1-Hour Bitcoin analysis. Stay tuned and follow along!
👀 On the 1-hour timeframe, we see that Bitcoin is currently below its resistance zone at $111,458. If this level is broken, Bitcoin can move upward toward its next resistance levels.
🧮 The RSI oscillator is currently below the static resistance near level 70, which overlaps with the $111,458 resistance. If the RSI breaks above this zone, Bitcoin can enter overbought territory, making it easier to move toward the next resistance.
🕯 Looking at Bitcoin’s volume, we can see that volume has decreased, and this decline is clearly visible. With the first increase in buying or selling volume, Bitcoin can begin its next move with stronger momentum and potentially cause a price spike.
💵 Today we will also take a look at USDT dominance. The 4.91% support level on USDT dominance overlaps with Bitcoin’s current resistance. If this level is broken, Bitcoin can start its move upward with strong confirmation.
✍️ A complete and clear scenario is now formed for a Bitcoin position, which you can use for your trades in the continuation of this analysis.
🟢 Scenario for Bitcoin resistance breakout 👇🏻
If Bitcoin breaks the $111,458 price level along with RSI crossing above 70 and an increase in buying volume, it can move toward higher price levels.
For this scenario, we also need confirmation from USDT dominance, meaning a break below the 4.91% support zone.
❤️ Disclaimer : This analysis is purely based on my personal opinion and I only trade if the stated triggers are activated .

XAUUSD – Increased Selling Pressure After CPI DataHello traders,
With U.S. CPI rising sharply to 3.1% (compared to the forecast of 2.9%), inflation remains elevated, reinforcing the likelihood that the Fed will not cut interest rates anytime soon. With higher interest rates, the opportunity cost of holding gold (a non-yielding asset) increases, causing capital to flow into USD, which is a negative factor for gold.
On the H4 chart, XAUUSD is facing pressure at the 4.150 level, with a pullback pattern forming within a descending channel. After reaching this level, the price of gold is likely to continue its decline, with the next target being the 4.080 support area, and potentially heading toward 3.830 if the bearish momentum persists.
Additionally, while both the PMI for manufacturing and services have slightly decreased , reflecting a slowdown in the U.S. economy, the CPI remains the dominant factor , limiting the potential for gold's short-term price increase.

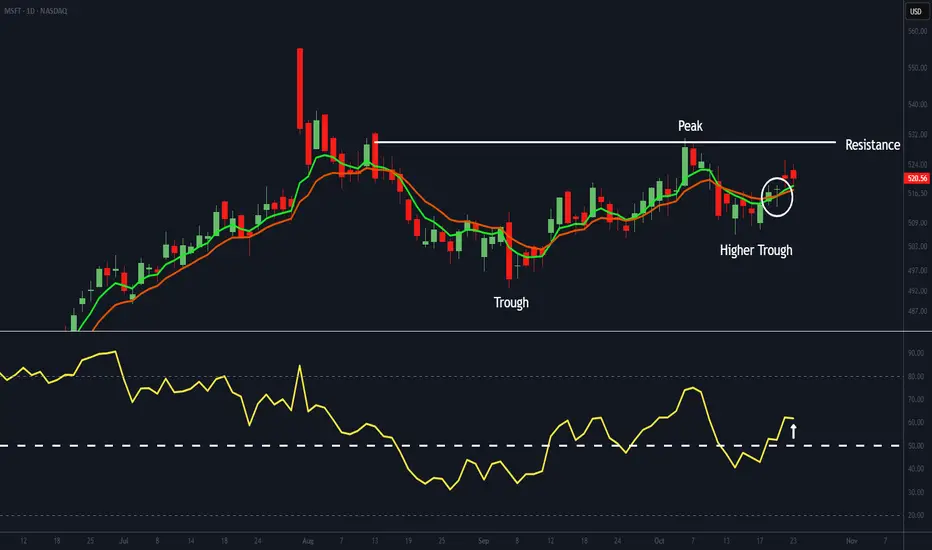
Microsoft’s Higher Trough Hints at a Bullish LegWe believe Microsoft (MSFT) has formed a higher trough - a bullish sign. Its EMAs have crossed positively, and the RSI has moved above 50, signalling improving momentum. If the RSI holds above that level, it will confirm a strengthening trend that could see MSFT challenge resistance near $530.
The company reports next Wednesday after the close, with investor attention centred on Azure and Copilot - the pillars of its AI strategy. Copilot, now embedded across Microsoft 365, Teams, and Outlook, is gaining strong enterprise adoption; for instance, Barclays recently expanded its licences from 15,000 to 100,000. The AI assistant could generate billions in recurring revenue, while Azure - which grew 39% year-on-year last quarter, its fastest pace in three years - remains the primary growth driver. Sustained progress in both areas will be crucial for maintaining investor confidence.
Although momentum has yet to reach full strength for a decisive breakout, it is clearly building. Next week’s earnings could provide the catalyst needed to push it over that threshold.
The Best DEX & Token PotentialAVNT #LONG
Potential for 130% growth .
You can go long on spot or with a small leverage.
Token from a DEX, the exchange is good , the drop was awesome , staking their token with a good interest rate is available, the team's cliff is long, so there is an incentive to push the price up .

USDCAD Breaks Out After CPI – The Bullish Wave Is Rising!Hello traders!
USDCAD is showing strong bullish momentum after tonight’s U.S. economic data release. The annual CPI rose to 3.1% , higher than the forecast of 2.9% , signaling persistent inflation pressure and suggesting that the Fed may delay rate cuts . This has boosted the U.S. dollar, providing solid support for USDCAD to move higher.
On the H1 chart, price has broken above both the EMA34 and EMA89 resistance zones while holding firm above the key psychological level of 1.4000. This indicates a shift from consolidation to a short-term bullish phase. The current price structure is forming a W-pattern, with the next target around 1.4030.
If price continues to stay above 1.4000, buying pressure could drive USDCAD to break the upper boundary of the descending channel, opening the way toward 1.4050–1.4100. The overall short-term trend remains mildly bullish , supported by stronger-than-expected U.S. CPI data and the renewed strength of the USD.

FUSDT - Scalp Long!Scalp Long Setup
Reason: RSI is in the buy zone → bullish momentum building. Short-term trendline has been broken → early reversal signal.
Plan:
Entry: After a confirmed breakout and retest.
TP: 0.019429
SL: 0.014033
RR: ~1:2.28 → tight risk management required.
Additional Confirmation: Rising volume and candle close above short-term resistance.
Strategy:
Use small position size; trail SL once price moves in favor.
Exit early if momentum fades or price reverses.
Conclusion:
A reasonable scalp setup, but wait for clear momentum confirmation before entering. Stay disciplined — no FOMO.

US500 Actionable Long Bullish 5 stack fundamental 6 stacks TechCMCMARKETS:SPX500Z2025
Fundamental: Bullish (5 stacks).
Technical: Bullish (6 stacks, Actionable 6+).
20-word summary: Earnings resilience and easing expectations support bids. EMAs aligned, RSI constructive. Dips bought while above 6675; trend continuation favored highs.
Trade plan (LONG): SL 107.768, TP 280.1968 (ATR method).
All stars align however stay sharp, stay nimble as tariffs loom.

USDJPY – Light Uptrend, Testing ResistanceUSDJPY is currently in a light uptrend, with strong support at 151.500. The price has bounced off this support level and is now approaching the resistance zone at 154.000.
Technically, EMA34 and EMA89 continue to support the price from below, indicating that the uptrend remains intact. However, USDJPY may face difficulty breaking the 154.000 resistance level in the short term.
In terms of news, the USD strength has been supporting the rise in USDJPY. If the Federal Reserve maintains its stable monetary policy, USDJPY could continue its uptrend, but it needs to break through the strong resistance at 154.000.
In conclusion, USDJPY is in a light uptrend in the short term, but it requires additional momentum to break through the resistance levels and continue its upward trend.

XAUUSD – Gold Recovers After US-China TensionsGold prices recently rose by nearly 1% during the Asian trading session on Thursday, recovering from two consecutive days of declines. The main reason for this is the renewed US-China trade tensions , which have increased demand for safe-haven assets like gold. At the same time, investors are awaiting important inflation data from the US , which could significantly impact the gold trend moving forward.
Technically, the chart shows that gold has experienced a slight correction after a strong rise from 4,060,000 USD. It is currently fluctuating within the range of 4,060,000 USD – 4,200,000 USD. Both EMA34 and EMA89 are supporting the price from below, confirming that the uptrend remains intact, despite the temporary correction.
Trading Strategy:
Buy if gold holds above 4,060,000 USD, with a target towards 4,200,000 USD.
Sell if gold fails to break through 4,200,000 USD and returns to test support at 4,060,000 USD.
In conclusion, with rising trade tensions and increased demand for safe-haven assets, gold is on a strong uptrend and is likely to continue testing the 4,200,000 USD resistance level in the near future.

CHFJPY - Potential LONGCHFJPY is pressing up against its old ceiling around 191.0–191.2 and just made a small pause/flag before pushing higher. I’m interested in buys only if it can stay above that ceiling—ideally a clear close or a quick dip-and-bounce that shows the level turning into support. If I’m in, I’ll hide my stop near 190.60 and aim for 191.90 → 192.60, with a stretch goal near 193.20 if momentum kicks in. If price pops above 191 and immediately falls back under 190.9, I’ll skip the long—that would smell like a fake breakout and could pull back toward 190.20 or 189.50. Keep position size modest up here; let confirmation do the work.

Is this a Bump and Run Reversal for Nike - 60% gains potential In this video I cover what could potentially be a reversal pattern playing out on Nike .
I cover the price action from the ATH down to the lows and present the idea of a bump and run
reversal pattern which could generate 60% gains .
Setting alerts is key and watching volume as explained in the video .
Please like and support my work any questions then ask below the chart .
Safe trading

AUDUSD – The Downtrend Remains DominantOn the 4H chart, AUDUSD continues to move within a descending channel that has persisted since early October. Each time price touches the upper trendline, it gets sharply rejected — showing that sellers remain firmly in control.
Currently, the pair is hovering around the 0.6480 zone, just below both the EMA34 and EMA89, which are sloping downward — confirming that the medium-term downtrend is still intact.
From a fundamental perspective, weaker-than-expected Australian employment data and growing expectations that the RBA might cut rates sooner are weighing on the Aussie. Meanwhile, the U.S. dollar is supported by rising Treasury yields — further strengthening the bearish bias.
Short-term scenario: price may rebound slightly toward the 0.6500 area (testing EMA resistance + upper trendline) before continuing its decline toward the 0.6420 target zone — which also aligns with strong technical support and the bottom of the descending channel.

#Gold Long Bullish on all fronts with lots of volatility.OANDA:XAUUSD
Fundamental — 🟢 Bullish (4/5 stacks): Hedge demand; easing bias supports.
Technical — 🟢 Diamond Vault Bullish (7/7 stacks): > EMAs; RSI 58; MACD strong; ADX 55; +DI gap ~52%.
Overall: 🟢 Diamond Vault Bullish (11 total stacks)
Trade plan: Long → SL ≈ 149.416 | TP ≈ 388.482. Approx levels: SL 3945.904, TP 4483.8016.
20-word summary: Top momentum asset; trend breadth and strong ADX favor dip buys toward 4050 with upside continuation to new highs.
Extremely volatile keep smaller positions and wider stops and take profit.
Stay sharp, Stay nimble.

F 5M Daytrade Long Aggressive Trend TradeAggressive Trend Trade
- short impulse
+ volumed TE / T1 level
+ support level
+ long volume distribution approach
+ biggest volume 2Sp+
- no test
Calculated affordable stop limit
1 to 2 R/R take profit before 5M T2
Hour Trend
"- long impulse
- volumed T2
+ support level
+ 1/2 correction
+ biggest volume manipulation"
Day Trend
"+ long impulse
+ 1/2 correction
- neutral zone
- context direction short"
Month CounterTrend
"- short impulse
+ 1/2 correction
- unvolumed T1
+ support level
+ long volume distribution
+ biggest volume manipulation"
Year Trend
"+ long impulse
+ volumed T2 level
+ volumed 2Sp+
+ 1/2 correction
+ weak test"

NBIS : Long worth TryingNebius group stocks are technically strong.
The downtrend since November 9, 2021 has been broken and the price is trading above the 50 and 200-period moving averages.
When we draw a medium-term Fibonacci level, we can take the take profit point at 0.618 and the stop-loss point at 0.382.
This gives us a Risk/Reward Ratio of 3.00.
A small position size is ideal.
Risk/Reward Ratio : 3.00
Stop-Loss : 43.46
Take-Profit : 60.00

UPS Swing Long 1H Conservative Trend TradeConservative Trend Trade
+ long impulse
- supporting reaction bar
+ support zone
+ 1/2 correction
+ biggest volume Sp
Calculated affordable virtual stop loss
1 to 2 R/R take profit
Daily Trend
+ long impulse
= neutral zone"
Monthly CounterTrend
"+ short impulse
+ biggest volume T1
+ support zone
+ biggest volume manipulation bar
- one bar reversal?"
Yearly trend
"+ long impulse
+ 1/2 correction
+ T2 level
+ support zone
+ biggest volume manipulation bar"

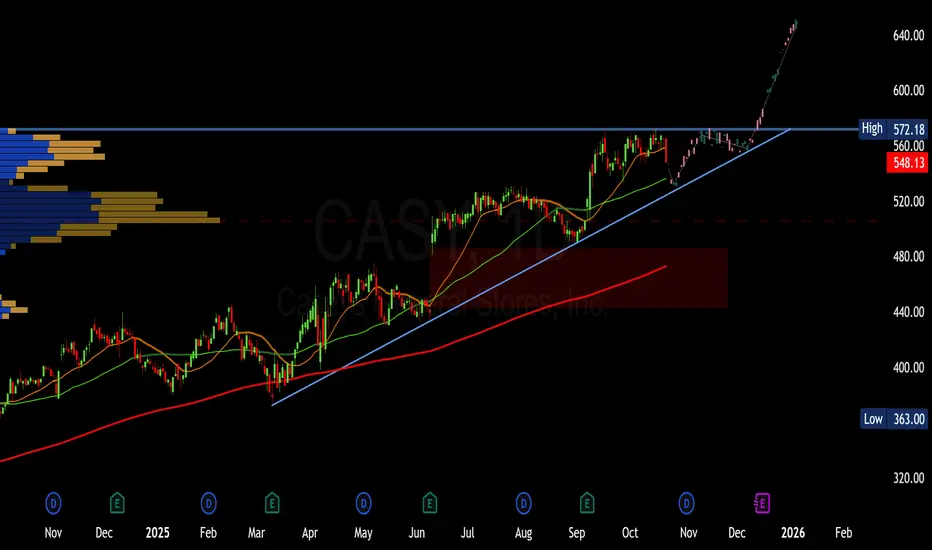
CASY Casey's potential ascending triangleNASDAQ:CASY Casey's is forming a potential ascending triangle, with higher lows (~$540–$550) and resistance at $580–$600. Bullish momentum (RSI ~65, positive MACD) suggests a breakout above $600 could target $620–$650 as Q2 earnings approach in December. A pullback to the $445–$480 gap offers a strong entry point for longs. Watch volume and earnings catalysts! Casey's General Stores, Inc. operates approximately 2,900 convenience stores in 19 states.
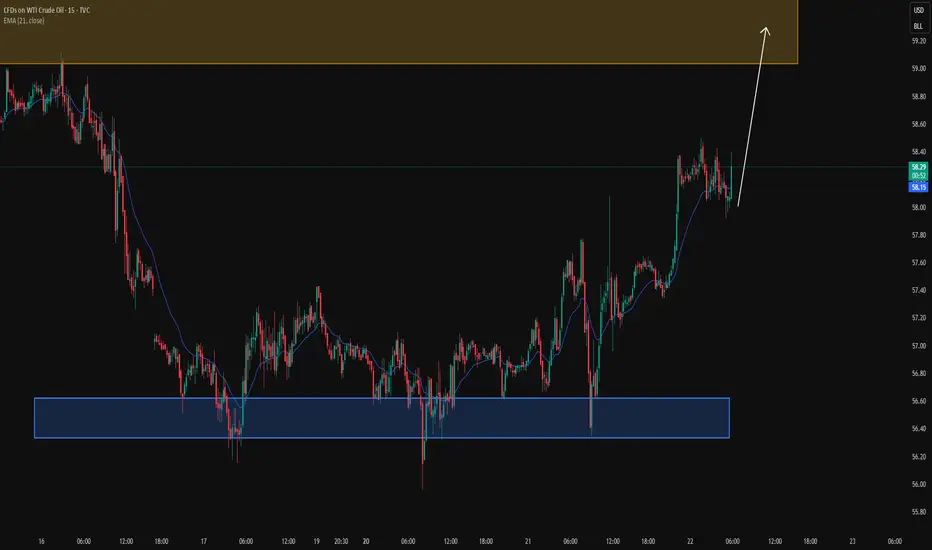
USOIL: Uptrend strengthens after multiple support tests
* Trend: assessed using at least three trend indicators, with market structure as the primary guide.
** Weak or Reversal Signals: Assessed based on one of our criteria for trend reversal signals.
*** Support/Resistance: Selected from multiple factors – static (Swing High, Swing Low, etc.), dynamic (EMA, MA, etc.), psychological (Fibonacci, RSI, etc.) – and determined based on the trader’s discretion.
**** Our advice takes into account all factors, including both fundamental and technical analysis. It is not intended as a profit target. We hope it can serve as a reference to help you trade more effectively. This advice is for informational purposes only and we assume no responsibility for any trading results based on it.
George Vann @ ZuperView
EUR/USD Drops Sharply: A Huge "Sell" Opportunity Ahead!Hello traders,
Recent news from the European Central Bank (ECB) warns that Eurozone banks may face significant pressure if USD liquidity tightens. This could lead to banks reducing lending, negatively impacting Eurozone economic growth, and as a result, the EUR weakens.
Additionally, the current chart shows that EUR/USD is moving within a descending channel, nearing the support zone at 1.15400. After being pushed down from the 1.16600 level, EUR/USD shows signs of continuing its decline. With tightening USD liquidity and the weakening EUR, the market seems to be preparing for a strong downtrend.
If EUR/USD breaks the current support zone, the next target will be 1.15400, providing a great opportunity for traders to pursue sell trades in the near future.
Don't miss the opportunity!
