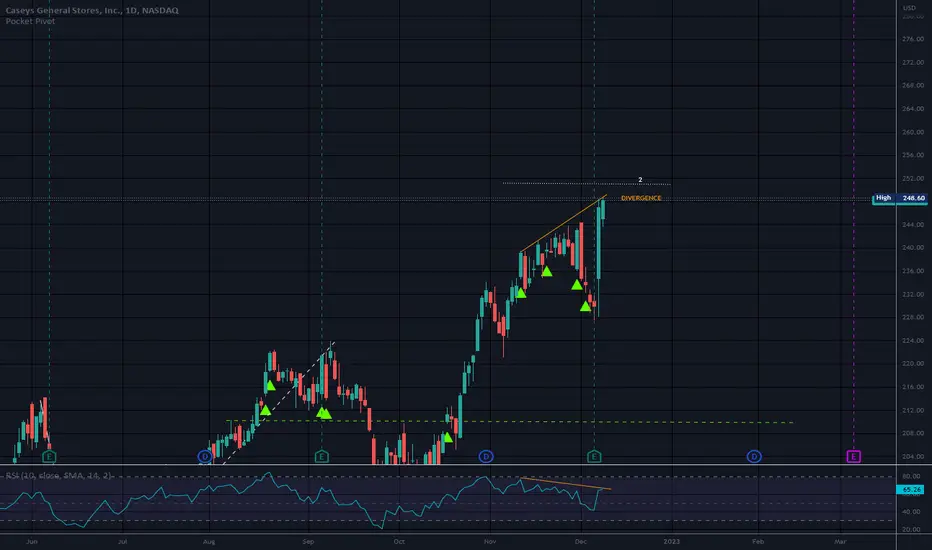
Caseys General Stores, Inc. (CASY) Expands Convenience StoresCaseys General Stores, Inc. (CASY) operates convenience stores across the Midwest, offering fuel, groceries, and prepared foods like its popular pizza. The company grows by expanding store locations, increasing same-store sales, and driving demand for its food and beverage offerings. Its mix of fuel
Caseys General Stores, Inc.
No trades
No trades
Compare with Caseys General Stores, Inc.
19.27 USD
714.45 M USD
17.56 B USD
36.75 M
Next report date
—
Report period
—
EPS estimate
—
Revenue estimate
—
Profile
Sector
Industry
CEO
Darren M. Rebelez
Website
Headquarters
Ankeny
Founded
1959
IPO date
Oct 21, 1983
ISIN
US1475281036
CUSIP
147528103
FIGI
BBG000BF0672
Identifiers
ISIN US1475281036
Casey's General Stores, Inc. engages in the provision of management and operation of convenience stores and gasoline stations. It provides self-service gasoline, a wide selection of grocery items, and an array of freshly prepared food items. The firm offers food, beverages, tobacco products, health and beauty aids, automotive products, and other non-food items. The company was founded by Donald F. Lamberti in 1968 and is headquartered in Ankeny, IA.
CASY - 4 months HEAD & SHOULDERS CONTINUATION══════════════════════════════
Since 2014, my markets approach is to spot
trading opportunities based solely on the
development of
CLASSICAL CHART PATTERNS
🤝Let’s learn and grow together 🤝
══════════════════════════════
Hello Traders ✌
After a careful consideration I came to the conclusion that:
-
CASY Casey's potential ascending triangleNASDAQ:CASY Casey's is forming a potential ascending triangle, with higher lows (~$540–$550) and resistance at $580–$600. Bullish momentum (RSI ~65, positive MACD) suggests a breakout above $600 could target $620–$650 as Q2 earnings approach in December. A pullback to the $445–$480 gap offers a str
CASY Bullish Setup — Strike $520, Profit Target $31.80!
🚀 **CASY Earnings Trade Alert** (2025-09-08)
**Directional View:** **Moderate Bullish** 💹
**Confidence:** 68%
**Trade Setup:**
* **Instrument:** CASY
* **Strategy:** BUY CALL (single-leg)
* **Strike:** \$520
* **Expiry:** 2025-09-19
* **Entry Price:** \$10.60
* **Entry Timing:** Pre-earnings cl
This Casey does NOT strike out - Long at 448.47Step 1: Zoom out on the chart for CASY. Please. Feel free to scroll back all the way to 1984. I'll wait...
That view alone tells you all you need to know. This is one of the prettiest charts you'll find anywhere on Wall Street. Not flashy, just relentlessly and consistently profitable. If I
Breaking: Casey's Announces Third Quarter ResultsCasey's General Stores, Inc., together with its subsidiaries, operates convenience stores under the Casey's and Casey’s General Store names announces Third Quarter Results leading to shares rising 2.35% in premarket trading on Wednesday early morning session.
Earning's Highlight:
Diluted EPS of $
CASY Casey's General Stores Options Ahead of EarningsAnalyzing the options chain and the chart patterns of CASY Casey's General Stores prior to the earnings report this week,
I would consider purchasing the 260usd strike price Calls with
an expiration date of 2023-10-20,
for a premium of approximately $2.02.
If these options prove to be profitable pri
CASY gonna grab it before earningslooks like this one could make a little in gains earnings comming out on the 8th the past 11 days have green bars on volume and we are sitting several clicks above the 50MA.the tecnical indicators are showing strong buy through the next week.
the past four earnings reports are all beats lets keep ou
See all ideas
Summarizing what the indicators are suggesting.
Neutral
SellBuy
Strong sellStrong buy
Strong sellSellNeutralBuyStrong buy
Neutral
SellBuy
Strong sellStrong buy
Strong sellSellNeutralBuyStrong buy
Neutral
SellBuy
Strong sellStrong buy
Strong sellSellNeutralBuyStrong buy
An aggregate view of professional's ratings.
Neutral
SellBuy
Strong sellStrong buy
Strong sellSellNeutralBuyStrong buy
Neutral
SellBuy
Strong sellStrong buy
Strong sellSellNeutralBuyStrong buy
Neutral
SellBuy
Strong sellStrong buy
Strong sellSellNeutralBuyStrong buy
Displays a symbol's price movements over previous years to identify recurring trends.
Weight0.04%
Market value905.19 M
Weight0.04%
Market value743.80 M
Weight0.35%
Market value654.43 M
Weight0.05%
Market value416.39 M
Weight0.05%
Market value378.10 M
Weight0.79%
Market value368.33 M
Weight1.99%
Market value288.44 M
Weight0.17%
Market value166.74 M
Weight0.12%
Market value159.76 M
Weight0.75%
Market value157.66 M
Weight0.22%
Market value125.05 M
Explore more ETFs
Frequently asked questions
The current price of CASY is 822.00 USD — it has decreased by −2.50% in the past 24 hours. Watch Caseys General Stores, Inc. stock price performance more closely on the chart.
Depending on the exchange, the stock ticker may vary. For instance, on NASDAQ exchange Caseys General Stores, Inc. stocks are traded under the ticker CASY.
CASY stock has risen by 4.81% compared to the previous week, the month change is a 8.63% rise, over the last year Caseys General Stores, Inc. has showed a 60.17% increase.
We've gathered analysts' opinions on Caseys General Stores, Inc. future price: according to them, CASY price has a max estimate of 1,069.00 USD and a min estimate of 794.00 USD. Watch CASY chart and read a more detailed Caseys General Stores, Inc. stock forecast: see what analysts think of Caseys General Stores, Inc. and suggest that you do with its stocks.
CASY reached its all-time high on Jun 11, 2026 with the price of 927.85 USD, and its all-time low was 0.88 USD and was reached on Dec 20, 1983. View more price dynamics on CASY chart.
See other stocks reaching their highest and lowest prices.
CASY stock is 3.06% volatile and has beta coefficient of 0.29. Track Caseys General Stores, Inc. stock price on the chart and check out the list of the most volatile stocks — is Caseys General Stores, Inc. there?
Today Caseys General Stores, Inc. has the market capitalization of 30.42 B, it has decreased by −0.05% over the last week.
Yes, you can track Caseys General Stores, Inc. financials in yearly and quarterly reports right on TradingView.
Caseys General Stores, Inc. is going to release the next earnings report on Sep 14, 2026. Keep track of upcoming events with our Earnings Calendar.
CASY earnings for the last quarter are 4.37 USD per share, whereas the estimation was 3.31 USD resulting in a 32.01% surprise. The estimated earnings for the next quarter are 6.63 USD per share. See more details about Caseys General Stores, Inc. earnings.
Caseys General Stores, Inc. revenue for the last quarter amounts to 4.57 B USD, despite the estimated figure of 4.33 B USD. In the next quarter, revenue is expected to reach 5.58 B USD.
CASY net income for the last quarter is 162.68 M USD, while the quarter before that showed 130.07 M USD of net income which accounts for 0.00% change. Track more Caseys General Stores, Inc. financial stats to get the full picture.
Caseys General Stores, Inc. dividend yield was 0.28% in 2025, and payout ratio reached 11.90%. The year before the numbers were 0.43% and 13.67% correspondingly. See high-dividend stocks and find more opportunities for your portfolio.
As of Jul 10, 2026, the company has 49.85 K employees. See our rating of the largest employees — is Caseys General Stores, Inc. on this list?
EBITDA measures a company's operating performance, its growth signifies an improvement in the efficiency of a company. Caseys General Stores, Inc. EBITDA is 1.48 B USD, and current EBITDA margin is 8.50%. See more stats in Caseys General Stores, Inc. financial statements.
Like other stocks, CASY shares are traded on stock exchanges, e.g. Nasdaq, Nyse, Euronext, and the easiest way to buy them is through an online stock broker. To do this, you need to open an account and follow a broker's procedures, then start trading. You can trade Caseys General Stores, Inc. stock right from TradingView charts — choose your broker and connect to your account.
Investing in stocks requires a comprehensive research: you should carefully study all the available data, e.g. company's financials, related news, and its technical analysis. So Caseys General Stores, Inc. technincal analysis shows the buy rating today, and its 1 week rating is buy. Since market conditions are prone to changes, it's worth looking a bit further into the future — according to the 1 month rating Caseys General Stores, Inc. stock shows the buy signal. See more of Caseys General Stores, Inc. technicals for a more comprehensive analysis.
If you're still not sure, try looking for inspiration in our curated watchlists.