Unemployment Rate Rises, US-China Tensions Push AUD to 0.64000?The Australian Dollar (AUD) is under strong pressure against the USD. Market concerns about the Australian economy are growing, with the unemployment rate rising to 4.5% in September, the highest level in nearly 4 years. This has led to expectations that the Reserve Bank of Australia (RBA) will cut interest rates in November, further weakening the AUD.
Additionally, US-China trade tensions continue to escalate, with China tightening control over rare earth exports and export licenses, raising concerns about global supply chains. Although the USD is weakening due to expectations that the Fed will cut interest rates, the AUD is still negatively affected by these factors.
The AUD/USD chart clearly shows a downtrend, with lower highs and lower lows. The price is currently trading in a downward channel and is testing the support level at 0.64400. If this support level is broken, the price could continue to decline toward 0.64000.
Longsetup

XAUUSD – Favor the BULLISH scenario, trade the price channelMacro backs the bulls: Gold just broke above $4,200/oz on expectations of imminent Fed rate cuts, while geopolitics and renewed US–China trade tensions are sending flows back into safe havens. Such capital typically doesn’t “flip” quickly, so the uptrend still has room.
H1 technicals: Price is moving cleanly inside an ascending channel with clear push–pause rhythms. The lower trendline is providing solid support; the 4.22x area is the nearest footing, with an overhead supply zone at 4.28x–4.30x.
Reference trade plan:
Wait for a pullback to 4,228–4,222 to buy the continuation.
SL: below the channel floor around 4,196–4,200 to avoid noise.
TP1: 4,250, TP2: 4,272, TP3: 4,295–4,305 (scale out into the supply zone).

Xau/Usd - Key Buying Zones In FocusGold has been following a strong bullish trend, forming higher highs and higher lows within a rising channel. The chart shows multiple Breaks of Structure (BOS), confirming bullish momentum. Price action is currently approaching a weak high, suggesting potential continuation toward the $4350 target.
Several Buying Zones are clearly marked, indicating areas of strong demand where buyers have previously stepped in. If price pulls back from current levels, these zones offer high-probability re-entry areas for long positions.
As long as price respects these demand zones and remains within or above the ascending channel, bullish bias remains intact. Traders may look for confirmation in the buying zones for potential entries targeting the $4350 mark.

When will gold continue to rise? 4300?⭐️GOLDEN INFORMATION:
Gold (XAU/USD) advances toward $4,210 during Thursday’s Asian session, hovering near a fresh record high as Fed rate-cut expectations and renewed trade tensions lift safe-haven demand. Traders now await comments from Fed officials, including Michael Barr, Stephen Miran, Christopher Waller, and Michelle Bowman, for policy cues. Earlier this week, Fed Chair Jerome Powell warned that slowing job growth poses a risk to the US economy, reinforcing prospects for two more rate cuts this year—supportive of the non-yielding yellow metal.
⭐️Personal comments NOVA:
The buying power shows no signs of stopping, breaking 4217 and continuing to increase in price. The whole market is very excited and focusing on investing in gold as the safest asset.
⭐️SET UP GOLD PRICE:
🔥SELL GOLD zone: 4275 - 4277 SL 4282
TP1: $4265
TP2: $4250
TP3: $4240
🔥BUY GOLD zone: $4154-$4152 SL $4147
TP1: $4165
TP2: $4180
TP3: $4190
⭐️Technical analysis:
Based on technical indicators EMA 34, EMA89 and support resistance areas to set up a reasonable BUY order.
⭐️NOTE:
Note: Nova wishes traders to manage their capital well
- take the number of lots that match your capital
- Takeprofit equal to 4-6% of capital account
- Stoplose equal to 2-3% of capital account

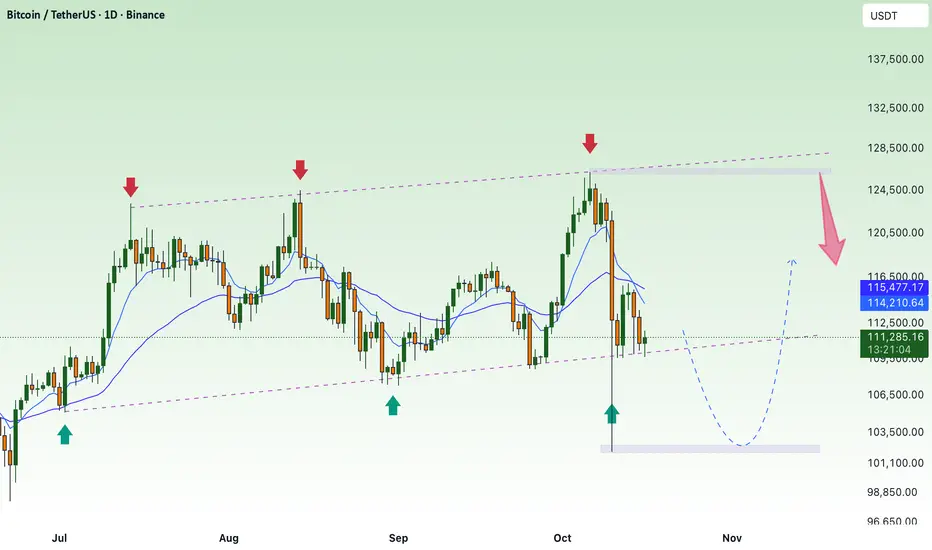
BTC mainly accumulates, remaining force decreasesBTC Technical Analysis (1D Chart)
Bitcoin continues to move inside a rising channel, where the upper trendline has repeatedly acted as strong resistance (around $125,000–126,000), and the lower boundary has held as key support near $108,000.
After the recent rejection at the upper boundary, price has pulled back sharply and is now approaching the support zone at $108,000–108,500, which aligns with:
The bottom trendline of the ascending channel
The 200-day EMA (white line)
A previous reaction zone marked by strong bullish reversals in the past
If the support holds, BTC may see a technical rebound toward the EMA89–EMA34 zone around $114,000–115,000, or even back to the channel resistance near $125,000.
However, if price breaks below $108,000, it would confirm a bearish breakout from the channel, potentially opening the way toward $100,000–102,000.
Key Levels to Watch
Resistance: $114,000 – $115,800 / $125,000 – $126,000
Support: $108,000 – $108,500 (critical zone)
Trend: Neutral to bullish inside channel; bearish breakdown if $108K fails
GBPUSD: Waiting for bullish pullback signalsIn my previous analyses, GBPUSD has been in a corrective downtrend on the daily timeframe. On the lower timeframes, the pair continues to test support and resistance levels to confirm the overall trend.
Daily timeframe outlook:
4h timeframe outlook:
* Trend: assessed using at least three trend indicators, with market structure as the primary guide.
** Weak or Reversal Signals: Assessed based on one of our criteria for trend reversal signals.
*** Support/Resistance: Selected from multiple factors – static (Swing High, Swing Low, etc.), dynamic (EMA, MA, etc.), psychological (Fibonacci, RSI, etc.) – and determined based on the trader’s discretion.
**** Our advice takes into account all factors, including both fundamental and technical analysis. It is not intended as a profit target. We hope it can serve as a reference to help you trade more effectively. This advice is for informational purposes only and we assume no responsibility for any trading results based on it.
George Vann @ ZuperView

GBP/USD: A slight pullback before continuing higher?The USD has weakened against major currencies due to expectations that the Federal Reserve (Fed) will cut interest rates in upcoming meetings. This has reduced the attractiveness of the USD, while the UK economy remains stable with a 0.10% GDP growth in August, boosting confidence in the British pound.
Technical Analysis: The GBP/USD chart shows a strong uptrend, with higher lows and higher highs. The support level at 1.3400 remains intact, and the price is currently heading towards the resistance level at 1.3470. Indicators such as the EMA 34 and 89 are both supporting the bullish trend.
Conclusion: With support from both macroeconomic factors and technical analysis, GBP/USD is likely to continue its upward movement. Consider buying on a pullback to 1.3400, with targets at 1.3470 and 1.3500.

XAUUSD – The Uptrend Remains Strongly IntactGold continues to hold above the 4,100 USD/oz zone — a key psychological support level after growing expectations that the Fed may cut interest rates this month.
The technical structure shows XAUUSD is still moving within a clear ascending channel, with each retest of the trendline being strongly absorbed by buying pressure.
It’s highly likely that the 4,100 – 4,120 area will serve as the next accumulation zone before price moves toward the 4,250 USD target.
As long as the Fed maintains its dovish stance and U.S.–China tensions remain elevated, gold’s bullish trend stays firmly intact.
Strategy: Focus on Buy on Dip around 4,100 – 4,120, targeting 4,250 – 4,300 in the short term.

GBP/USD – The Pound’s Uptrend ContinuesAlthough weak wage growth data for August caused the pound to dip slightly on Tuesday, positive signals from Bank of England (BoE) Governor Andrew Bailey provide strong support. He emphasized that the BoE will maintain a cautious monetary policy and will not rush to cut interest rates, signaling that rates may remain high for an extended period.
On the chart, GBP/USD is currently showing a strong recovery pattern after touching the 1.3300 support zone, and is moving upwards with the next target at 1.34100. The macroeconomic factors from the BoE are likely to fuel further momentum for the pound, with buyers expected to return strongly.
Trading Strategy:
Buy GBP/USD around 1.33180, with a target towards 1.34100. The pound may continue its upward movement as the BoE’s monetary policy remains supportive.

GOLD (XAUUSD) – Decision Zone Ahead | Bulls Holding DemandTVC:GOLD
Market Overview
Gold has shown repeated rejections from the demand base, confirming aggressive buyer interest.
Every retest of the yellow box created higher lows, showing accumulation before a potential expansion toward new highs.
If bulls hold above 4 200, continuation toward the 4 228–4 235 zone (previous all-time-high region) is expected.
Key Scenarios
✅ Bullish Case 🚀 → 🎯 Target 1 4 218 | 🎯 Target 2 4 230 | 🎯 Target 3 4 240
❌ Bearish Case 📉 → Rejection from decision zone → Retest of 4 185 then 4 165
Current Levels to Watch
Resistance 🔴 4 218 – 4 230
Support 🟢 4 185 – 4 165
⚠️ Disclaimer: This analysis is for educational purposes only. Not financial advice.

UPS Swing 1H Long Conservative CounterTrend TradeConservative CounterTrend Trade
+ long impulse
- support bar above JOC level
+ support level
- above 1/2 correction
+ volumed 2Sp-
+ weak test
Calculated affordable virtual stop loss
1 to 2 R/R take profit above 1H T1 below 1D CREEK
Daily CounterTrend
"= uniderectional balance
+ expanding ICE level
+ support level"
Monthly CounterTrend
"- short impulse
+ biggest volume T1
+ biggest volume breaking bar with bad result"
Yearly Trend
"+ long impulse
+ 1/2 correction
+ T2 level
+ support level"

SOL — From Panic to PrecisionLast week, we witnessed a sharp, market-wide crash, a chain reaction of liquidations that flushed out overleveraged long positions. While many altcoins saw 60–90% drawdowns, the majors held relatively firm.
Among them, SOL stood out as one of the most technically precise. Price perfectly tapped the 1.1 trend-based Fib extension, in confluence with the yearly level, the 21 monthly SMA and the 0.666 retracement, providing a high probability long setup.
After that bounce, SOL revisited the lows, approaching the yearly level near $170, which remains the key structural support for maintaining bullish momentum. The support zone between $175–$170 aligns with the 21 EMA/SMA on the monthly timeframe, which currently spans $158–$170 → forming a strong macro confluence cluster that’s critical to hold.
From there, price unfolded into a clean 5-wave impulsive structure, topping within a dense resistance zone between $208–$212, reinforced by:
mOpen at $208.68
21 EMA/SMA (Daily TF) between $211–$212
0.618 Fibonacci retracement at $211.43
This area offered the perfect low-risk short entry.
Currently, SOL appears to be forming an ABC corrective pattern, likely targeting a move back into the $190–$185 range to fill imbalances and complete wave C. As another key element, the yearly open at $189.31 sits mid-range between resistance and support → a critical pivot level. That’s the region I’ll be monitoring for long setups.
🔍 Indicators used
DriftLine — Pivot Open Zones → For identifying key yearly/monthly/weekly/daily opens that act as major S/R reference points
Multi Timeframe 8x MA Support Resistance Zones → to identify support and resistance zones such as the monthly 21 EMA/SMA.
➡️ Available for free. You can find it on my profile under “Scripts” and apply it directly to your charts for extra confluence when planning your trades.
_________________________________
💬 If you found this helpful, drop a like and comment!

BLSi Observed these Levels based on Price Action and Demand & Supply which is my own Concept "PENDAM CONCEPTS"... Please don't take any trades based on this chart/post... Because this chart is for educational purpose only not for Buy or Sell Recommendation... Thank Q

Time to short Nvidia - Key levels Longs and shorts In this video I have created a simple idea that gives you a easy invalidation for a short as well as
pinpointing some key regions as to where we can set alerts and patiently wait for strong reaction zones for the long side provided we get the structure shift that I am looking for .
Tools used TPO chart, Fibs, Channels ,

EURJPY 5 Stacks Fundamental 7 Stacks Technical BullishEURJPY Long with confluence across both fundamentals and Technical. We have 5 stacks on the fundamental side and 7 stacks on the technical side.
Fundamental: 5 Stacks — Bullish Bias
Technical: 7 Stacks — Bullish Bias
Perfect alignment across all stacks. EMA structure, MACD, and ADX confirm strength; this Crystal Lock Trade.
trend remains extremely bullish with solid follow-through.
EMA5 | EMA20 | EMA50 | EMA200 | RSI | MACD | ADX | +DI | –DI
Stop Loss 174.40 Take profit 179.72

EUR/USD – Euro continues to decline, target at 1.15500EUR/USD has continued to drop sharply recently, heavily impacted by political instability in France and the weak economic environment in the eurozone. The French Prime Minister’s delay of pension reform has raised concerns about political and economic stability in the region, contributing to the continued weakening of the euro.
On the chart, we can see EUR/USD moving in a clear downtrend channel with a steep descending trendline. The important support at 1.1600 has been broken, and the next target could be 1.15500 if the bearish trend persists.
With the euro losing value and no supportive fundamental factors, 1.15500 is likely the next target in the short term.

Gold price continues to break above 4200⭐️GOLDEN INFORMATION:
Gold (XAU/USD) surges to a new all-time high in Wednesday’s Asian session, with bulls eyeing the $4,200 mark amid mounting global uncertainty. Renewed US-China trade tensions, the prolonged US government shutdown, and ongoing geopolitical risks continue to drive safe-haven demand. Meanwhile, dovish Federal Reserve expectations and a softer US Dollar further support the metal’s strong uptrend, with buyers largely unfazed by overbought conditions.
⭐️Personal comments NOVA:
Gold price continues to break out near 4200, strong buying power continues to increase price, US government is still closed, gold price continues to increase
⭐️SET UP GOLD PRICE:
🔥SELL GOLD zone: 4235 - 4237 SL 4242
TP1: $4220
TP2: $4210
TP3: $4200
🔥BUY GOLD zone: $4093-$4091 SL $4086
TP1: $4105
TP2: $4120
TP3: $4130
⭐️Technical analysis:
Based on technical indicators EMA 34, EMA89 and support resistance areas to set up a reasonable BUY order.
⭐️NOTE:
Note: Nova wishes traders to manage their capital well
- take the number of lots that match your capital
- Takeprofit equal to 4-6% of capital account
- Stoplose equal to 2-3% of capital account

EURUSD Drops Sharply: USD Strengthens Pressure!EURUSD is in a strong downtrend. The chart shows that the price is moving below a clear downward trendline, with a key resistance level at 1.16000 USD. Notably, the price is fluctuating within a descending channel, with the next support levels to watch being 1.15450 USD and 1.15000 USD.
The significant increase in USD buying by hedge funds and asset managers is driving the strengthening of the dollar. This is mainly due to concerns about short positions on the USD and the rising demand for USD as a safe-haven asset amid global economic uncertainty.
Additionally, trade tensions between the US and China escalated in early October, causing investors to worry about global market stability, which further strengthens the USD. As the USD continues to rise, the EUR weakens against the USD, adding pressure on EURUSD in the short term. This also reflects a price adjustment following the downtrend, with key support levels near 1.15000 USD.

Gold Breaks Out: Strong Uptrend Continues!With the current XAUUSD chart, gold is showing a strong upward trend. On October 13th, gold broke the 4,100 USD/ounce mark, setting a new record due to the ongoing US-China trade tensions and expectations of a Fed rate cut. Politically, President Donald Trump's reignition of the trade war with China has driven investors toward gold as a safe-haven asset.
Furthermore, the 97% probability that the Fed will cut interest rates by 0.25% in October and 100% in December strengthens the appeal of gold, as gold typically performs well in low-interest-rate environments.
According to the chart analysis, gold may continue to climb towards the next resistance levels at 4,100 USD and 4,230 USD, if the current uptrend continues. In the short term, this bullish trend is expected to remain strong.

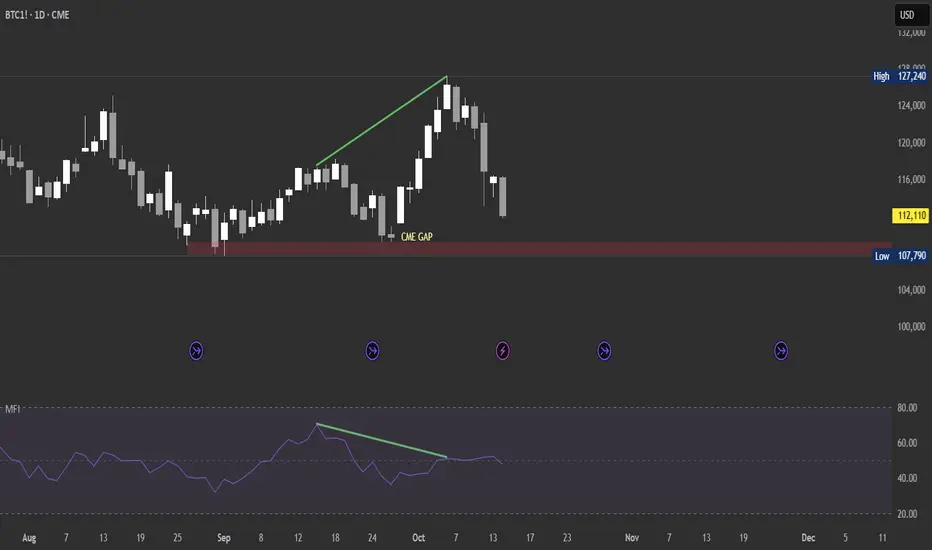
BTC heading to fill the CME GAPBTC looks like it's heading to fill the CME gap on the daily timeframe. That red zone could act as a strong support and a good level to go long under ideal conditions — unless our orange head decides to rig it again. Peace
The bulls are too dominant, prices continue to increase⭐️GOLDEN INFORMATION:
Gold (XAU/USD) extends its record-breaking rally above $4,100 in Tuesday’s Asian session, fueled by safe-haven demand amid the ongoing US government shutdown and renewed US-China trade tensions. Geopolitical risks and rising expectations of further Federal Reserve rate cuts also continue to underpin the non-yielding metal.
⭐️Personal comments NOVA:
Selling pressure is almost absent in the market, buying pressure continues to push gold prices up. Continue waiting for a new ATH today.
⭐️SET UP GOLD PRICE:
🔥SELL GOLD zone: 4212 - 4214 SL 4219
TP1: $4200
TP2: $4185
TP3: $4162
🔥BUY GOLD zone: $4058-$4056 SL $4051
TP1: $4070
TP2: $4090
TP3: $4105
⭐️Technical analysis:
Based on technical indicators EMA 34, EMA89 and support resistance areas to set up a reasonable BUY order.
⭐️NOTE:
Note: Nova wishes traders to manage their capital well
- take the number of lots that match your capital
- Takeprofit equal to 4-6% of capital account
- Stoplose equal to 2-3% of capital account

Sweep all liquidity, BTC recoversBTCUSD – Daily Analysis
The recent market move confirmed our earlier sell call at the 126K top, which played out perfectly as price reversed sharply from that resistance zone. This level aligned with the 1.618 Fibonacci extension and the upper trendline — a strong confluence area that signaled exhaustion.
Currently, BTC is rebounding from the support zone around 110K–111K, showing short-term recovery momentum. However, unless price breaks decisively above 121K, the structure still favors a potential retest toward 110K before any larger bullish continuation.
→ Key Levels:
• Resistance: 121K / 126K
• Support: 110K / 107K
• Trend: Short-term corrective uptrend within a broader range
✅ Successfully caught the 126K top — next focus on reaction around 121K zone.

US 30 POETENTIAL BULLISH RUNAfter setting a strong low on Friday, Dow Jones Industrial Average is likely to correct close to the rejection thus cueing for long entries. be on the lookout for those buys at around 45300. Buy stops at the current weekly high.
