SILVER (XAGUSD) 15M – Bearish Rejection Setup Ahead TVC:SILVER
Structure | Trend | Key Reaction Zones
Price reached the accumulation + resistance zone, facing repeated rejections.
Structure is forming a lower-high pattern beneath the descending trendline.
If the rejection confirms, a sharp drop toward the next liquidity pool (49.00 area) can follow.
Market Overview
Silver has been ranging within a broad accumulation zone after rejecting the upper resistance region around 50.8–51.2. The market shows weakness near the top of the channel, hinting at a bearish continuation phase. If momentum fails to break above the diagonal resistance, a downside move toward 49.5–49.0 becomes highly probable before a possible reaction from the strong demand box.
Key Scenarios
✅ Bearish Case 📉 → 🎯 Target 1: 49.52 | 🎯 Target 2: 49.03 | 🎯 Target 3: 48.70
❌ Bullish Case 🚀 → 🎯 Target 1: 50.80 | 🎯 Target 2: 51.20 (if resistance breaks cleanly)
Current Levels to Watch
Resistance 🔴 : 50.80 – 51.20
Support 🟢 : 49.50 – 49.00 – 48.70
⚠️ Disclaimer: For educational purposes only. Not financial advice.
Longsetup

Tariff tensions - the driving force behind gold price increases✍️ NOVA hello everyone, Let's comment on gold price next week from 10/13/2025 - 10/17/2025
⭐️GOLDEN INFORMATION:
Gold (XAU/USD) climbs during the North American session on Friday, trading near $3,997, up 0.6%, as renewed US-China trade tensions, the ongoing US government shutdown, and expectations of further Fed easing fuel safe-haven demand. Risk sentiment deteriorated after President Donald Trump warned of new tariffs on China, which threatened countermeasures on rare earth exports, while Trump dismissed the need to meet President Xi Jinping later this month.
⭐️Personal comments NOVA:
Tariff tensions return, US government remains shut. Gold price maintains bullish momentum above 4000
🔥 Technically:
Based on the resistance and support areas of the gold price according to the H4 frame, NOVA identifies the important key areas as follows:
Resistance: $4058, $4100
Support: $3980, $3942, $3895
🔥 NOTE:
Note: Nova wishes traders to manage their capital well
- take the number of lots that match your capital
- Takeprofit equal to 4-6% of capital account
- Stoplose equal to 2-3% of capital account
- The winner is the one who sticks with the market the longest

BTCUSDTBitcoin is trying to put good volume above this line and pull itself up. I think you can look for a long position.

Solana and Bitcoin Update ! Whats Next Quick update covering BTC and Solana .
I had done videos previously anticipating this move to the downside and wanted to cover the current price action and add a little clarity to the situation .
We have had a great reaction off of BTC so far and thus some alts have also followed suit .
Bitcoin holds the fate for the alts so we want to see btc hold the current range 113K .
Take it level by level and dont panic . This is a great opportunity but we want to see a sign of strength in SOL before taking positions .

EURUSD 4H – Testing Major Holding Zone FX:EURUSD
Price has followed a clean descending channel, rejecting from the top resistance zone.
Current candles are reacting inside the yellow holding zone, which aligns with previous accumulation structure.
A potential W-formation could build here if bulls defend this level — otherwise, the next demand layer waits lower.
Market Overview
EURUSD has reached a critical zone after an extended bearish leg. Liquidity beneath equal lows has been swept, suggesting smart-money absorption before a possible reversal. If the market holds above the 1.15 region, buyers could step in for a corrective rally toward mid-channel levels. However, if the zone fails, price may dip toward the deeper support box before a larger bullish correction begins.
Key Scenarios
✅ Bullish Case 🚀 → 🎯 Target 1: 1.1620 | 🎯 Target 2: 1.1720 | 🎯 Target 3: 1.1860
❌ Bearish Case 📉 → 🎯 Target 1: 1.1490 | 🎯 Target 2: 1.1420 (deeper support zone)
Current Levels to Watch
Resistance 🔴: 1.1620 – 1.1720
Support 🟢: 1.1500 – 1.1420
⚠️ Disclaimer: This analysis is for educational purposes only. It is not financial advice.

Gbp/Jpy - Bullish Reversal From Demand ZoneDemand Zone (Blue Rectangle):
The price tapped into this zone and showed a rejection wick.
Suggests strong buying interest, as seen previously on October 7-8.
Acts as a support base for a potential reversal or bullish rally.
Resistance / Target Zone (Green Rectangle):
Previous support turned resistance, aligned with a weak high.
Logical target for a bullish move.
Near 205.000 psychological level — a good place for taking profit.
Entry Setup:
Entry Point: Marked at the edge of the demand zone.
Confirmation: Price rejection with a long wick and small-bodied candle indicates a possible bullish reversal.
Confluence Factors:
Break of Structure (BOS) and Change of Character (ChoCH) earlier in the trend.
The price is now creating a higher low, suggesting a potential trend shift.
Price is oversold (outer Bollinger band tapped), signaling a mean reversion.
Indicators & Tools:
Bollinger Bands:
Price touched the lower band (supportive of reversal).
Bands are starting to widen again, suggesting incoming volatility.
Parabolic SAR (dots):
Currently above price, indicating a bearish trend — but could flip if price breaks upward.
Moving Average (Green Line):
Price is below the MA — will need to break above for stronger bullish confirmation.
Trade Idea:
Bias: Bullish Reversal from Demand Zone
Entry: Around 202.600 (current level)
Target: 205.000 zone (resistance / weak high)
Stop Loss: Below demand zone — e.g., 201.900 (below the wick)
Risk Management & Notes:
Wait for confirmation (e.g., bullish engulfing or MA crossover).
Monitor for false breakouts — a break below demand zone invalidates setup.
Ideal R:R (Risk to Reward) appears to be 2:1 or better.
Summary:
This chart suggests a potential long trade setup based on price rejecting a strong demand zone, with a target set near a resistance/weak high area. If momentum builds and breaks above short-term resistance, a bullish move toward the 205.000 area is likely.

Eth/Usd - Bullish Trendline BreakoutTrendline Breakout Confirmed
Price has broken out of the resistance trendline, forming a bullish structure with confirmation from multiple CHoCH (Change of Character) and BOS (Break of Structure).
Entry Executed
Entry was taken on breakout retest (highlighted zone). Price is now pushing above the resistance line, showing strong bullish momentum.
Target: 4430
Based on breakout projection and previous highs, next target is set at 4430.
Structure Overview:
Support Trendline holding price structure
Resistance Trendline broken with strong bullish candle
CHoCH and BOS indicate shift in market structure
15-minute timeframe suggests short-term bullish bias.
Target: 4430
Monitor for volume confirmation and continuation.

Platinum Futures Update Platinum Futures Update
This video is a quick update after hitting the 1-1 extension given in Julys video .
I look at what we can expect looking forward using higher time frames .
Tools used TR Pocket/ fibs

BTCUSDT.P LONGBTCUSDT.P LONG
An uptrend is possible in the market
Price: 121,363.10 $
Main target 123419.0 $
SL 118709.0 $

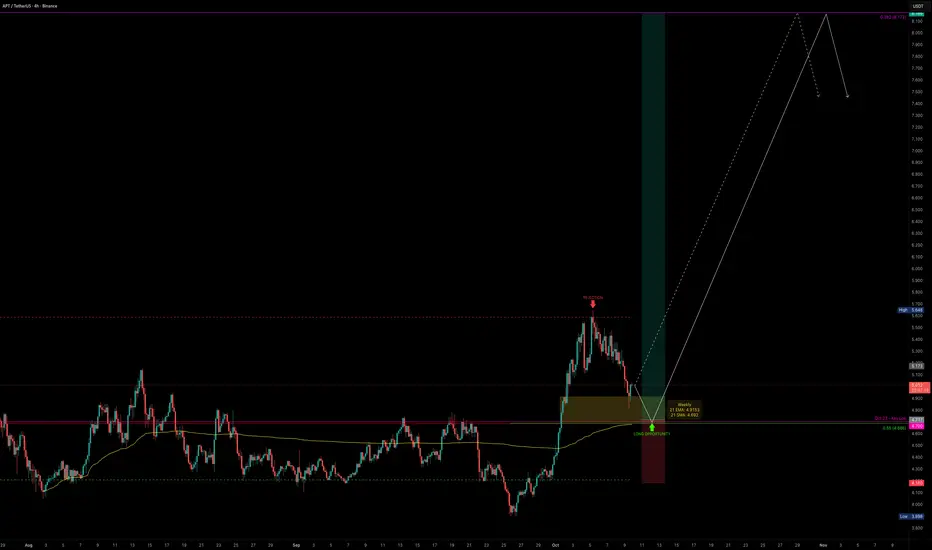
APT — 248 Days of Consolidation, Breakout PotentialAPT has been trading sideways for the past 248 days, building a massive base of consolidation. Things are starting to get interesting.
Recently, APT made its first real attempt to break above the yearly VWAP core (~$5.6) but got rejected, completing a 5-wave impulse right at this resistance zone. The rejection was no surprise: it lined up perfectly with the VAH of the 248-day trading range and the 4B market cap resistance at $5.69.
Now, after a strong impulse, we are in correction mode and this could set up the next major swing long opportunity.
🟢 Support Confluence Zone ($5.0–$4.5)
POC of 248-day range: $4.685
Anchored VWAP (from Aug low): sits right at the POC
Key Low (Oct 2023): $4.70
0.55 Fib retracement (of 5-wave impulse): $4.686
21 Daily EMA/SMA: $4.847 / $4.7
21 Weekly EMA/SMA: $4.915 / $4.69
200 4H EMA/SMA: $4.7 / $4.582
All confluences point to this being a critical support zone that bulls must defend.
🔴 Resistance Zone ($5.6–$5.7)
Yearly VWAP core (~$5.6)
VAH of 248-day range (~$5.6)
4B Market Cap resistance (~$5.69)
This zone remains the big wall to break. Once cleared with strong volume, upside potential opens significantly.
Freshly built (unpublished) Anchored VWAP Suite , which provides VWAP tracking:
Fair Value Trend Model :
Trade Setup
Long Entry: Ladder between $5.0–$4.5
Invalidation: Below VAL of range
Targets: $5.7 (major resistance), $7 (Fair Value), $8.172 (0.382 Fib)
Potential swing setup with R:R of 1:6+
Possible gain of +70% if structure holds and volume confirms breakout
Quick Take
APT is sitting at one of the most important support zones of the year. If this base holds, it sets up a high-probability swing long with great upside potential. All eyes are on whether bulls can reclaim momentum and finally break through the $5.7 wall.
🔍 Indicators used
Multi Timeframe 8x MA Support Resistance Zones → to identify support and resistance zones such as the weekly 21 EMA/SMA.
Fair Value Trend Model → Calculates a regression-based fair value curve
➡️ Available for free. You can find it on my profile under “Scripts” and apply it directly to your charts for extra confluence when planning your trades.
_________________________________
💬 If you found this helpful, drop a like and comment!
Nzd/Usd - Bullish Reversal After Liquidity SweepLiquidity Sweep observed below the recent weak low, indicating a potential stop-hunt and smart money accumulation.
Break of Structure (BOS) and multiple Change of Character (CHoCH) signals suggest a shift from bearish to bullish market structure.
Price has shown a bullish CHoCH after the liquidity sweep, aligning with a potential trend reversal.
Entry:
Entry Zone: ~0.57462 (Marked with blue arrow)
Price has just broken above the minor range high, confirming bullish intent.
Targets:
TP1: ~0.57790 – Aligns with the nearest resistance zone.
TP2: ~0.58090 – Retest of a strong high and major resistance zone.
Stop Loss Suggestion:
Below the swept liquidity low, ideally under 0.57300 (weak low), to protect against a deeper pullback.
Key Concepts Highlighted:
CHoCH (Change of Character) – Shift from bearish to bullish trend.
BOS (Break of Structure) – Confirmation of direction change.
Liquidity Sweep – Possible smart money move to trap sellers.
Resistance Zones – Marked areas for potential profit-taking.
Bullish Bias Justification:
Price action has swept liquidity, formed a higher low, and broken previous lower highs.
CHoCH confirms shift in momentum; likely targets are previous supply zones (TP1 & TP2).
Favoring long setups while structure remains bullish above weak low.

EURUSD 4H – Testing Strong Demand ZoneFX:EURUSD
Structure | Trend | Key Reaction Zones
Market remains in a downtrend channel, but price is now approaching a strong demand zone near 1.1570–1.1600.
The falling wedge structure suggests potential bullish reversal soon if liquidity sweeps the lows.
Mid-range resistance lies near 1.1658 and 1.1769.
Market Overview
EURUSD continues to respect its descending structure after rejection from the 1.1870 zone. However, buyers may soon step in as the pair nears a high-demand region, historically known for strong reversals. A clean reaction or double-bottom pattern could trigger a short-term bullish rally back toward mid-zone resistance.
Key Scenarios
✅ Bullish Case 🚀 → Rejection from 1.1570 zone → 🎯 Target 1.1658 → 🎯 Target 1.1769 → 🎯 Extended 1.1870
❌ Bearish Case 📉 → Break below 1.1570 → 🎯 Target 1.1500
Current Levels to Watch
Resistance 🔴: 1.1658 / 1.1769
Support 🟢: 1.1570 / 1.1500
⚠️ Disclaimer: This analysis is for educational purposes only. Not financial advice.

TSLA BULLISH OCT 9 2025There is a lot of bullish momentum in Tesla at current price. Price action is always superior .
If you dont understand a trade then dont enter in it trusting me or any stranger as this is your hard earned money. Missing a trade is not the end of the world.
Its a trade so,
STOP LOSS means Stop my loss
Trade:
Entry- curren price
SL-$416 close
Target-$460 min

Accumulated above 4000, gold price maintained increase⭐️GOLDEN INFORMATION:
Gold (XAU/USD) slips during the Asian session on Thursday, ending its four-day rally after hitting a record high near $4,060. The Israel-Hamas peace deal eased geopolitical tensions, triggering some profit-taking amid overbought conditions. Still, dovish Fed expectations may continue to support the precious metal, limiting downside risks.
⭐️Personal comments NOVA:
Gold price adjusted to take liquidity in the 4000 price zone, accumulated and continued the uptrend.
⭐️SET UP GOLD PRICE:
🔥SELL GOLD zone: 4067 - 4069 SL 4074
TP1: $4050
TP2: $4040
TP3: $4030
🔥BUY GOLD zone: $3987-$3985 SL $3980
TP1: $4000
TP2: $4010
TP3: $4020
⭐️Technical analysis:
Based on technical indicators EMA 34, EMA89 and support resistance areas to set up a reasonable BUY order.
⭐️NOTE:
Note: Nova wishes traders to manage their capital well
- take the number of lots that match your capital
- Takeprofit equal to 4-6% of capital account
- Stoplose equal to 2-3% of capital account

USD/JPY - SUPPORT REJECTION AND BULLISH MOMENTUM SHIFTUSDJPY on the 15-minute timeframe is showing a bullish setup after a clear reaction from the support zone. Price formed a short-term Change of Character (ChoCH), signaling a potential shift in momentum from bearish to bullish. The pair tapped into the support area aligned with previous structural lows, followed by a rejection candle, confirming buyer interest.
The Tokyo session created liquidity below support, which has now been swept, and price is showing strength toward the upside. A long entry opportunity is identified around 152.56–152.57, anticipating continuation toward the weak high as the next liquidity target.
As long as price remains above the support base, bullish momentum is expected to extend toward the target zone near 152.90–153.00. A break below the support would invalidate this bullish setup.

Bnb/Usdt - Support Bounce And Weak High Target Current price shows a bullish trading setup for Binance Coin (BNB/USDT) on the 15-minute timeframe. The price forms a CHoCH (Change of Character) and crosses above the EMAs, signaling a possible trend reversal. The suggested entry is at the point where the CHoCH and EMA intersect, with a target price set at 1340. The setup is supported by a bounce from a strong support zone, aiming for a move toward the weak high area.

Xau/Usd - Pullback Buy Opportunity to 4040Price has recently shown strong bullish momentum with a Break of Structure (BOS) confirming upside intent. A weak high has been formed around the 4032 level, suggesting liquidity may still be present above.
We're anticipating a pullback into the marked Demand Zone, where price previously consolidated before the breakout. This zone is key for potential bullish continuation.
Trading Plan:
Wait for price to return to the Demand Zone.
Look for a bullish rejection candle (e.g., pin bar, engulfing) within the zone.
Enter long on confirmation, targeting the next liquidity level at 4040.
Risk Management:
Place stops just below the demand zone structure.
Consider partials around recent highs if necessary.
This setup aligns with intraday momentum and structure, offering a high-probability trade if conditions are met.

Gold ATH continues to set, looking to 4050⭐️GOLDEN INFORMATION:
Gold (XAU/USD) extends its rally in the Asian session on Wednesday, breaking above the $4,000 mark for the first time ever. Expectations of further Fed rate cuts, persistent geopolitical tensions, and mounting economic uncertainty from the ongoing US government shutdown continue to fuel demand for the precious metal.
⭐️Personal comments NOVA:
The current gold buying power in the market is very large, the weakening of DXY this year is the main reason for the very strong growth in gold prices.
⭐️SET UP GOLD PRICE:
🔥SELL GOLD zone: 4048 - 4050 SL 4055
TP1: $4040
TP2: $4030
TP3: $4020
🔥BUY GOLD zone: $3960-$3962 SL $3955
TP1: $3975
TP2: $3990
TP3: $4000
⭐️Technical analysis:
Based on technical indicators EMA 34, EMA89 and support resistance areas to set up a reasonable BUY order.
⭐️NOTE:
Note: Nova wishes traders to manage their capital well
- take the number of lots that match your capital
- Takeprofit equal to 4-6% of capital account
- Stoplose equal to 2-3% of capital account
Long CAKEUSDT (D1). x3-x5 probablyLong CAKEUSDT. x3-x5 probably
entry - current level
TP1 - 10
SL - close below DMA200 (around 2.3 with confirmation on daily TF)
FA.
BSC DEX from last cycle.
BSC narrative.
TA.
1) High-volume buys in feb-march 2025 on a second retest of the lows (1.5 zone).
2) 200DMA - strong support for 3-4 months.
3) Just look at BNB/USDT chart and you'll get it :)
No need to overcomplicate.
p.s. NFA, DYOR

#BTC UPDATE!CRYPTOCAP:BTC is currently breaking below the 1H uptrend line, showing early signs of weakness.
If we get a confirmed 1-hour candle close below this trendline, short setups could come into play.
The first key support sits around $123,200, with the next major demand zone near $119,415.
For now, the focus is on how this hourly candle closes. A strong rejection could push BTC back above $124,474, but a confirmed breakdown would likely shift short-term momentum to the bearish side.
DYOR, NFA
CRYPTOCAP:BTC BITSTAMP:BTCUSD BINANCE:BTCUSDT
#Crypto

Positive Market - BTC Continues to Find New ATHBTCUSD Analysis
Bitcoin is currently testing the upper boundary of a long-term ascending channel, where price has previously faced rejection several times (as shown by the red arrows).
The market recently completed a strong rally toward 124K, aligning with the 1.618 Fibonacci extension (123,609) — a significant resistance zone that triggered selling pressure.
Key observations:
• Resistance area: Around 124K–125K, aligning with the upper channel line — potential for short-term correction.
• Support zones: The first support lies near 118,100, followed by 115,000–115,500, both acting as Fibonacci retracement zones.
• Possible scenarios:
1. Price may retrace toward 118K–115K to gather liquidity before another push upward.
2. If the market holds above 123K, a breakout toward 132K–133K could be confirmed.
Overall, momentum remains bullish, but the current zone requires caution — a short-term pullback is likely before the next major move.

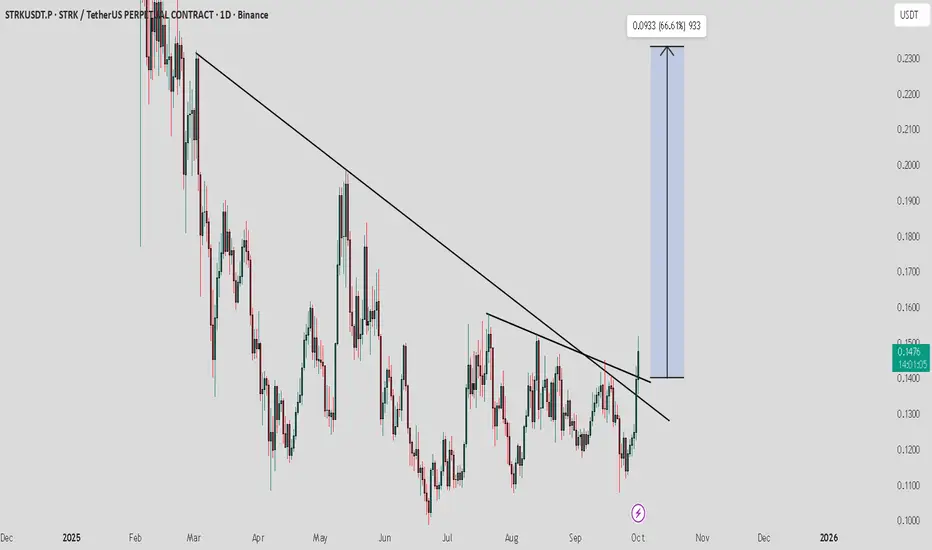
STRK / USDT : Showing strong moemtum for a bullish rallySTRK/USDT Analysis
STRK is showing strong momentum and has confirmed its breakout. If this move holds, a bullish rally towards $0.20 – $0.25 is likely in the short term.
Always manage risk wisely and avoid chasing entries without proper confirmation.
Xrp/Usdt - Bullish Reversal From Support ZoneXRP is currently trading within a well-defined support zone, showing potential signs of a bullish reversal after multiple structure shifts (CHoCH) indicating seller exhaustion. Price tapped into the support area with a rejection wick, suggesting strong buyer interest.
The entry zone is highlighted near the support, aligning with liquidity sweep and a possible accumulation phase. A clean break of internal structure toward the upside would confirm bullish momentum.
As buyers gain control, the market is expected to form a higher-low structure before pushing toward the target zone, potentially reclaiming previous highs. The overall setup favors a buy scenario, with confirmation upon sustained bullish candles above minor resistance.
Key Points:
• Timeframe: 15M
• Zone: Support Rejection / Liquidity Sweep
• Entry: Near support confirmation
• Bias: Bullish Reversal
• Target: Previous strong high level
