EURAUD: Retracement Setup Before the Next Leg UpPrice action has been clean and purposeful here — and I’m preparing for the next bullish leg if the retracement completes as expected.
Here’s my full thought process:
- Market Structure
We’ve seen a strong break of structure (BOS) to the upside, shifting order flow bullish. Momentum is clearly with the buyers.
- Liquidity Engineering
Before that breakout, price consolidated and formed equal lows (liquidity pools) which got swept, fueling the impulsive move up. This shows smart money likely building long positions.
- Healthy Pullback Zone
Price is now retracing toward a 1H Fair Value Gap (FVG) that aligns with the 0.618–0.786 Fibonacci retracement and a rising trendline support.
This cluster creates a high-probability demand zone at 1.7710–1.7720 .
- My Plan
I’ll be looking for a bullish CHoCH or engulfing candle on 15m/5m inside this FVG zone to confirm that buyers are stepping back in.
🎯 Target: 1.7790
❌ Invalidation: A clean break below the FVG + trendline would invalidate this idea.
📝 Patience is key — let price come to your zone and wait for confirmation. No confirmation, no trade.
Longsetup

Bitcoin: Is it time?Being a crypto enthusiast, these are exciting times!
We have seen Bitcoin hit all time highs just a couple of weeks back, topping out $124,580 before retracing down to $107,000.
Many questioned: HAS THE BITCOIN BUBBLE BURST?
I would like to disagree with that.
With the rate cuts being 'almost' certain today, we expect risk assets (such as BTC) to be more attractive investments for both firms and investors globally.
After reaching the all-time highs and with the news event scheduled for mid-September, the sell off into the discount zone (as shown in the chart) was expected from my end and we have rebalanced the impulsive price action that led to the all-time high.
What I appreciated from the price driving down into the discount zone was the reaction the market gave us, it has reacted positively and that specific price region has invited investors and firms like Michael Saylor (MicroStrategy) to reinforce their position and increase their Bitcoin holdings.
Will the market explode as soon as the rate cuts news is released? I don't think so.
The market will experience liquidity stress, especially with how the economy is holding up at the moment and the 'almost certain' news outcome to both retail and institutional.
We may see spikes towards both directions, so my advice? Wait for the market to cool down once the news is released and position yourself accordingly.
The news will give us a direction until the end of the year, giving you a clear bias.
Trade safely and good luck to all!

Orange Juice Futures (ICE) – Long Trade SetupDirection: Long Bias
Contract: Frozen Concentrated Orange Juice (OJ / ICE US)
Current Price: ~268.95
🔍 Technical Setup
Price has found strong support around the 240–260 zone, aligning with long-term trendline support.
EMA20 is stabilizing, hinting at a potential shift in momentum after a sharp correction.
Structure suggests a rebound move with upside toward the 350–400 zone (previous support-turned-resistance).
Risk is clearly defined with support just below the recent lows.
📊 Fundamentals & Sentiment
Supply shock remains in play:
Brazil’s citrus belt is under severe strain from citrus greening disease (HLB), with nearly half of orchards infected.
2024/25 production fell to multi-decade lows, leaving Brazilian OJ stocks near “technical zero.”
Demand resilience: While high prices have pressured some consumers, global demand for NFC and premium juice has stayed firm.
Weather risk: Brazil’s 2025/26 crop outlook is uncertain — drought and heat remain threats.
🧾 COT Positioning
Speculators: Net long positioning indicates a bullish tilt, reflecting continued interest in upside exposure.
Commercials: Hedgers are active on the short side, but this is typical for producers locking in higher prices.
Interpretation: With speculators holding long exposure and commercials hedging into strength, the structure supports a bullish bias from a positioning standpoint.
🎯 Trade Plan
Strategy Stats: My long setups have a 70% win rate and average +11% gain.
Entry Zone: Current levels (~265–270) on confirmation of support holding.
Target 1: 350
Target 2: 400+ (if momentum extends)
⚠️ Risks
Strong rebound in Brazilian production (2025/26 season) could ease supply stress.
Demand destruction if consumers continue to balk at higher prices.
Large speculator long unwinds could trigger a sharp correction.
✅ Conclusion
With supply tightness, disease risk, and speculators maintaining long exposure, the Orange Juice market is primed for a bullish rebound from strong support. My system favors a long entry here, targeting 350–400, with a 70% historical profitability rate on similar setups.

ETH Accumulates for Uptrend Above 5000ETH Technical Analysis
1. Current Market Structure
• ETH is consolidating within a symmetrical triangle pattern.
• The price is trading around 4,487, holding above the moving averages but facing strong resistance ahead.
2. Key Resistance Levels
• 4,573 – 4,653 (Fib 0.618 – 0.786 zone): A critical resistance area where sellers may emerge.
• 4,754: Strong resistance level and neckline of the triangle.
• 5,040: Major target if the price breaks above the 4,754 resistance, aligning with the 1.618 Fib extension.
3. Key Support Levels
• 4,295 – 4,310 zone: Strong demand area and lower triangle support.
• A breakdown below this level could trigger deeper corrections.
4. Price Outlook
• Scenario 1: ETH may retest the 4,295 support zone before bouncing back towards the upper resistance at 4,754.
• Scenario 2: A confirmed breakout above 4,754 could accelerate bullish momentum towards 5,040.
👉 Conclusion: ETH remains bullish as long as it holds above the 4,295 support. Watch for a breakout at 4,754 to confirm continuation towards 5,040.

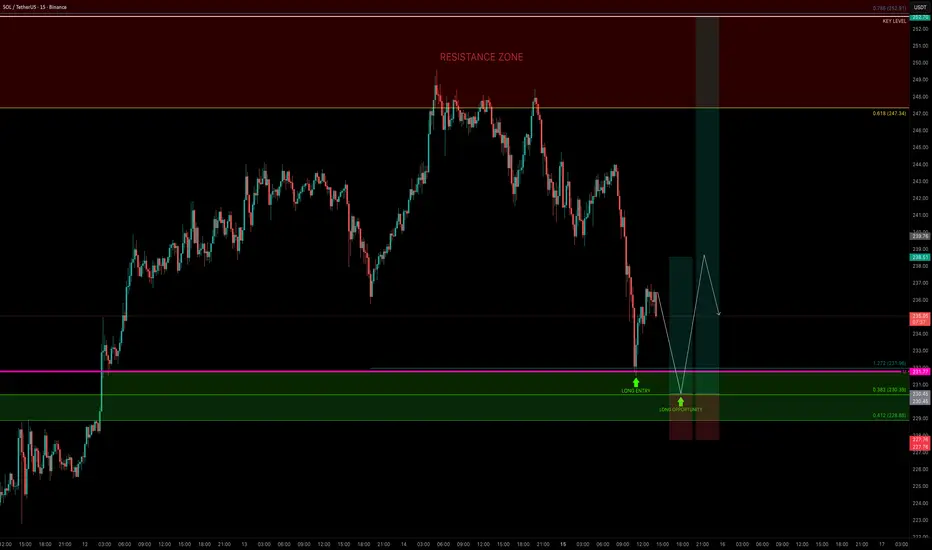
SOL — Bulls Need to Defend $230 for ContinuationSOL had a strong bullish week, almost tapping the $250 psychological level before rejecting down into the monthly level at $231.77, where price found support and bounced. This level also aligned with the 1.272 Fib extension ($231.96), making it a valid long opportunity.
🟢 Next Long Opportunity
The 0.382 Fib retracement ($230.39) of the move from the $199.32 low is the next key level to watch.
A retest here would:
Sweep liquidity from the current low
Offer a low-risk entry
Help fill some imbalances
📌 Overall, $230 is the level that must hold for bullish continuation.
Targets
TP1: $238 → R:R ~1:3
TP2: $252.91 (0.786 Fib retracement) → R:R ~1:8+ if momentum continues
Risk Management
Stop-Loss: Below $229 (clear invalidation)
Risk: Only 1% on this trade setup
Quick Take
If $230 holds, SOL could set up for another leg higher. This zone offers a clean, low-risk, high-reward long setup with clearly defined invalidation and attractive targets.
Bulls prepare for a strong breakout, 3747⭐️GOLDEN INFORMATION:
Uncertainty over global growth and ongoing geopolitical risks keep haven demand elevated, though gold’s rally is fueled mainly by expectations of aggressive Fed rate cuts,” noted Zain Vawda, analyst at OANDA. Meanwhile, markets are watching the US-China talks led by Treasury Secretary Scott Bessent, Trade Representative Jamieson Greer, and Vice Premier He Lifeng. Any breakthrough in trade negotiations or improved risk appetite could dampen demand for safe-haven assets like gold.
⭐️Personal comments NOVA:
Interest rate announcement time is approaching, the market is waiting for a new ATH milestone, the tariff and political instability context makes gold prices expected to continue to increase in late 2025
⭐️SET UP GOLD PRICE:
🔥SELL GOLD zone: 3745- 3747 SL 3752
TP1: $3730
TP2: $3720
TP3: $3710
🔥BUY GOLD zone: $3622-$3624 SL $3617
TP1: $3635
TP2: $3648
TP3: $3660
⭐️Technical analysis:
Based on technical indicators EMA 34, EMA89 and support resistance areas to set up a reasonable BUY order.
⭐️NOTE:
Note: Nova wishes traders to manage their capital well
- take the number of lots that match your capital
- Takeprofit equal to 4-6% of capital account
- Stoplose equal to 2-3% of capital account

GBPUSD - BUY OPPORTUNITYLooking to BUY GU in BUY AREA and PROFIT in TP AREA.
Entry Criteria:
Will be looking for Signs of reversals, rejections at Buy Area.
Do not enter Buy Area 1 if strong bearish break of Buy Area 1.
Will look for entry in Buy Area 2 on signs of reversal and or rejections etc.
Trade Safe

ETF VAL30IETF LongBreaking the resistance level, Expect a short term long position based on RSI levels going strong on daily and weekly time frame. Also trading above 200 moving average.
🟢 Long

ETF MODEFENCE LongExpect a short term long position based on RSI levels going strong on daily and weekly time frame. Also trading above 200 moving average.
🟢 position.

PEPE ANALYSIS🔮#PEPE Analysis 💰💰
#PEPE is trading in a symmetrical triangle in a daily time frame and if it breakouts with high volume then we can see a bullish momentum in #PEPE. Before that we will see little bit bearish movement towards its support zone and than a bullish movement.
🔖 Current Price: $0.00001091
⏳ Target Price: $0.00001413
⁉️ What to do?
- We can trade according to the chart and make some profits in #PEPE. Keep your eyes on the chart, observe trading volume and stay accustom to market moves.💲💲
#PEPE #Cryptocurrency #Pump #DYOR

AFG Stock Confirmed Bullish/Going UPHello,
Ayrfolio trade ideas are based on weekly charts and momentum, so remember to be patient! No day trades here unless the stock soars up intraday. Today we’re covering:
COMPANY: American Financial Group, Inc.
STOCK SYMBOL: AFG
POSITION: Long
TP1 Risk-Reward Ratio: 1.45
TP2 Risk-Reward Ratio: 2.89
Stop Loss: must wait AFTER daily candle closes to exit trade (regular candle, NOT Heiken Ashi)
Ultimate Stop Loss: can exit IMMEDIATELY if price reaches this level during any trading hours
EXPLANATION: Weekly momentum increased and confirmed on Tuesday 9/2/25 at $138.65/share. Although the stop losses are listed on the chart, if momentum has been lost then we can exit before the price reaches the stop loss.
DISCLAIMER: Please do your own due diligence before making any decisions. I am not an investment advisor, and I do not personally trade these stocks. These posts are stock trade ideas that follow my same weekly momentum strategy. Past results are not indicative of future performance.
P.S. - Stocks can soar. YOU can soar. Soaring is possible!
-Ayrfolio

C98 ANALYSIS🔮#C98 Analysis 💰💰
#C98 is trading in a symmetrical triangle in a weekly time frame and if it breakouts with high volume then we can see a bullish momentum in #C98. Before that we will see little bit bearish movement towards its support zone and that a bullish movement.
🔖 Current Price: $0.0498
⏳ Target Price: $0.0634
⁉️ What to do?
- We can trade according to the chart and make some profits in #C98. Keep your eyes on the chart, observe trading volume and stay accustom to market moves.💲💲
#C98 #Cryptocurrency #Pump #DYOR

DRIFT — No More Drifting, Breakout ImminentDRIFT has been trading sideways in a 226-day range, capped by resistance at $0.75. The POC of this entire range sits at $0.6, and price is currently trading above it at $0.62.
Volume spikes within the range show solid participation, and the structure is starting to resemble a Head & Shoulders formation with a neckline at $0.75 that needs to break.
Bullish Confluence (Support Zone)
Trading above:
21 Daily EMA ($0.593) / SMA ($0.592)
21 Weekly EMA ($0.577) / SMA ($0.549)
200 Daily EMA ($0.5828) / SMA ($0.5483)
Monthly Open → $0.5888
0.618 Fib retracement of current move → $0.5987 (long trigger)
Clear invalidation: below weekly 21 SMA ($0.549) / daily 200 SMA ($0.5483)
Resistance Confluence (Target Zone $1.3–$1.38)
nPOC of the end 2024 / early 2025 trading range → $1.3
0.786 Fib retracement → $1.2935
0.382 Fib retracement of entire downtrend → $1.3056
0.618 Fib retracement of smaller wave → $1.3677
Yearly Open → $1.3664
500M Market Cap → $1.38
📌 This creates a resistance cluster between $1.3–$1.38, an ideal take-profit zone and potential short opportunity.
🟢 Long Setup Idea
Entry: $0.62–$0.60 (ladder in near confluence with Fib + support levels)
Stop: Below $0.55 (weekly 21 SMA/ daily 200 SMA invalidation)
Targets:
TP1: $1
TP2: $1.3
Potential Gain: +115%
Quick Take
If $0.75 breaks, DRIFT could move quickly toward $1.3–$1.38, a zone stacked with resistance and confluences, the perfect place to secure profits/look for a short setup.
Key Levels
Support: $0.62–$0.60 (Fib + POC + EMAs)
Resistance: $0.75 neckline, then $1.3–$1.38 (confluence cluster)
🔍 Indicators used
LuxAlgo — Liquidity Sentiment Profile (Auto-Anchored)
DriftLine — Pivot Open Zones → For identifying key yearly/monthly/weekly/daily opens that act as major S/R reference points
Multi Timeframe 8x MA Support Resistance Zones → to identify support and resistance zones such as the weekly 21 EMA/SMA.
Fair Value Trend Model → Calculates a regression-based fair value curve
➡️ Available for free. You can find it on my profile under “Scripts” and apply it directly to your charts for extra confluence when planning your trades.
_________________________________
💬 If you found this helpful, drop a like and comment!

EURJPY - BUY OPPORTUNITYBUYING EJ from BUY AREA to TP AREA
entry criteria:
Executing on signs of reversal, rejections etc
Do not buy on strong bearish break through of buy area!
Trade Safe

growth, towards new ATH 3715⭐️GOLDEN INFORMATION:
Gold (XAU/USD) eased slightly on Tuesday after hitting a new record high near $3,690, as traders adjusted positions ahead of key central bank events. The Fed is widely expected to cut rates by 25 bps on Wednesday amid signs of labor market weakness, though attention will center on updated projections and Chair Powell’s remarks for clues on the policy outlook. These signals are likely to shape USD moves and set the next direction for bullion.
⭐️Personal comments NOVA:
Gold price continues to increase, market continues to fomo. Big buying force waiting for interest rate results to pump strongly
⭐️SET UP GOLD PRICE:
🔥SELL GOLD zone: 3713- 3715 SL 3720
TP1: $3703
TP2: $3692
TP3: $3680
🔥BUY GOLD zone: $3656-$3654 SL $3649
TP1: $3666
TP2: $3678
TP3: $3690
⭐️Technical analysis:
Based on technical indicators EMA 34, EMA89 and support resistance areas to set up a reasonable BUY order.
⭐️NOTE:
Note: Nova wishes traders to manage their capital well
- take the number of lots that match your capital
- Takeprofit equal to 4-6% of capital account
- Stoplose equal to 2-3% of capital account

Long TESLATrading Fam,
Today my indicator has signaled a BUY on $TSLA. The technicals align. M pattern looks to have completed at strong support (RED TL) and is bouncing upwards inside of a solid liquidity block. Buyers are stepping in. I'm in at $315 and will shoot for $430 (probably taking some profit along the way). My SL is currently $241 but will trail as we enter profit.
Best,
Stew

BULLISH ON GBP/NZDGBP/NZD has reached a nice demand zone and has created a beautiful inverse head and shoulders pattern.
Price is just now giving us a CHOC (Change of Character) to the upside breaking a previous strong high to the left.
I am waiting for price to pullback into that same demand area before buying, also watch out for the sweep below the (Head) of the Head and Shoulders.
Looking to catch 300-400 pips.


GBPUSD thoughtsIve already scale in some profits from this trade and depending on market open i will set SL to breakeven on market condition for next week but long on gold

DOGE ANALYSIS🔮#DOGE Analysis 💰💰
#DOGE is trading in a symmetrical triangle in a weekly time frame and breakouts with high volume and we could see a bullish momentum in #DOGE. Before that we will see little bit retest and then bullish movement
🔖 Current Price: $0.28110
⏳ Target Price: $0.43210
⁉️ What to do?
- We can trade according to the chart and make some profits in #ARKM. Keep your eyes on the chart, observe trading volume and stay accustom to market moves.💲💲
#DOGE #Cryptocurrency #Pump #DYOR

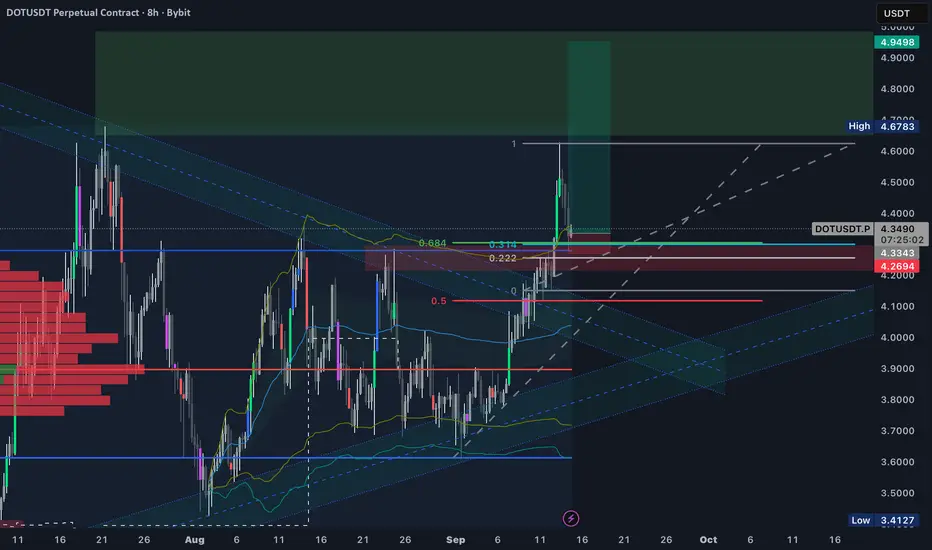
DOT at a decision point: breakout or just a stop hunt?DOT is currently attacking a new high, but the question is whether this move is a true breakout or just a liquidity grab.
This time I’m looking for a quick long setup.
My main zone of interest is 4.25–4.31.
This area lines up with multiple previous highs, which I now consider potential new support. It also includes:
• the 0.314–0.222 retracement from the latest pump,
• the 0.684 level (inverse of 0.314 from the bottom),
• the highest anchored VWAP line.
On top of that, divergences on RSI (14) and MACD (12:26) suggest price could push higher.
We’ve already tested the triangle breakout, so I believe that phase of interest is over. From here, price may dip slightly lower, but it doesn’t have to. A ~3% move against the position is acceptable.
I’m already in the trade.
If DOT retests the 4.25–4.31 zone, I see it as a strong buying opportunity.
Target: At least a new local high around 4.70, where I’ll take my first partial profit.
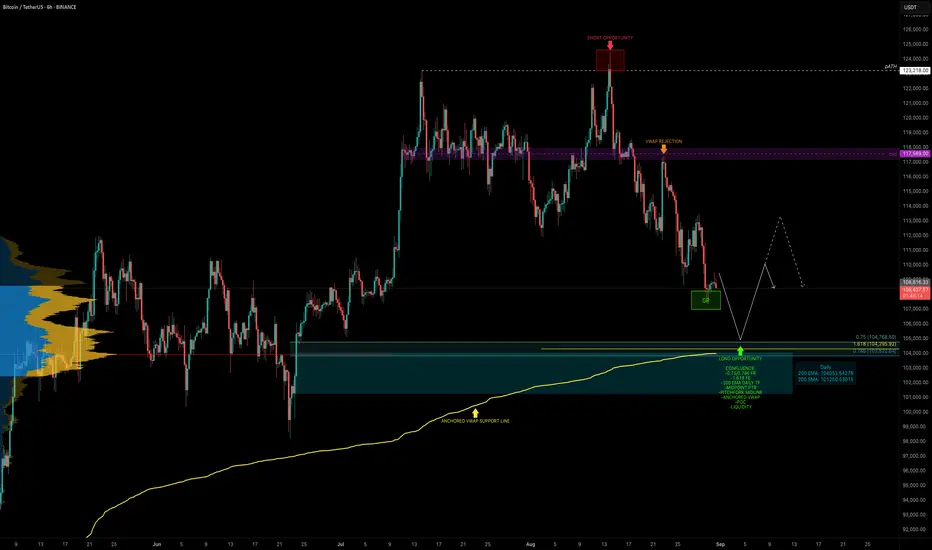
BTC — Identifying High-Probability Long Zone With ConfluenceBTC has been in a 17-day downtrend since the swing failure at the ATH (~$124.5K). That move acted as both a bull trap and the completion of a 5-wave structure, offering an excellent short entry at the highs.
Now the key question: where is BTC heading next, and where is the next high-probability trade setup?
Current Situation
BTC is sitting at the 0.618 Fib retracement ($108,236) of the move from $98.2K → $124.5K. Many traders are already buying this level, which is valid but a deeper zone below offers stronger confluence.
🧩 Confluence Zone: $105K–$104K
POC of the previous trading range → ~$104K
0.75 Fib retracement: $104,768.5
0.786 Fib retracement: $103,823
Anchored VWAP (from swing low $74,508) → just above the 0.786 Fib
Midpoint of the previous 60-day range
Liquidity cluster → positioned around $105K–$104K
1.618 Fib extension target: $104,296
Pitchfork midline → supporting this level
200 EMA (daily) → adding dynamic support at ~$104K
This creates a high-confluence support cluster between $105K–$104K, making it the next strong long setup.
🟢 Long Trade Setup
Entry Zone: $106K–$104K
Stop-Loss: Below $103K
TP: $110K-$114K
R:R Potential: 1:2+
Technical Insight
The ATH rejection confirmed both bullish exhaustion and a completed 5-wave move, triggering the current correction.
While the 0.618 retracement offers valid support, the $105K–$104K zone holds significantly stronger confluence.
This makes it the most attractive high-probability long entry zone in the current structure.
🔍 Indicators used
Multi Timeframe 8x MA Support Resistance Zones → to identify support and resistance zones such as the daily 200 EMA/SMA.
➡️ Available for free. You can find it on my profile under “Scripts” and apply it directly to your charts for extra confluence when planning your trades.
_________________________________
💬 If you found this helpful, drop a like and comment!
IMX/USDT , 1WIn Weekly if IMX breaks the Wedge pattern with strong candle close . it will move very fast (300%) like the same as past move . as the altcoins season is starting and slowing gaining momentum.
and at the same time Bitcoin dominance is decreasing and altcoins dominance is started increasing , so look on all the altcoins
and follow proper risk management , it has very good chances to move UP side but first we have to protect the down side , where risk management comes into game .
