MUGHAL STEELMUGHAL STEEL PSX
Follow the plan | Manage Risk–Reward strictly
🔹 Price retracing → offering two strong buying zones
🔹 Good share to accumulate for medium–long term (2026 view)
🔍 Fundamental Strength
✅ Strong group backing (Conglomerate exposure)
✅ Diversified earnings streams (core + growth segments)
✅ Healthy cash flows & balance sheet support
✅ Long-term growth visibility aligned with economic recovery
📊 Technical View
📉 Retracement from recent highs — healthy correction, not trend reversal
📍 Buying Zone 1: First demand area (for partial entry)
📍 Buying Zone 2: Strong support / value zone (for accumulation)
📈 Primary trend intact (higher-highs & higher-lows structure)
🛑 Clear invalidation level — risk well defined
⚠️ Trading Plan
🎯 Staggered buying on dips
🎯 Hold for 2026 unless structure breaks or USE TPs mentioned.
❌ Avoid over-leveraging
🧠 Let price confirm — no emotional entries
This is a structured accumulation setup, not a chase trade.
Longsetup

Price Breakout vs Confirmed CloseA small difference — but a very high price to pay
1. What is a price breakout?
A price breakout simply occurs when a candle’s wick or body touches or moves above a previous high.
The key point is this:
- A breakout does not mean the market has accepted a new price level.
Many breakouts last only a few seconds and exist purely to sweep liquidity.
- In practice, breaking a high is a very cheap action for the market. It often takes only a small amount of orders to push price above a high in the short term.
2. What is a confirmed close?
A confirmed close occurs when:
– The candle finishes completely above the previous high
– The market accepts the new price level instead of pulling back below it
This is the critical distinction:
Price can touch a high with a wick,
but it is only confirmed by the close.
A close reflects consensus, not an instant reaction.
3. Why do breakouts often cause traders to lose?
When traders enter immediately after price breaks a high, they often place themselves right in a liquidity cluster. Stop losses are typically positioned just below the old high, making it easy for the market to sweep those orders.
The common scenario is price breaking the high, triggering buy orders, then reversing before continuing in the original direction. The market is not wrong — the entry timing is.
4. Why is the close more important than the break?
Because:
Price can be pushed up artificially,
but a close requires sustained participation.
Without real money flow, price cannot hold the level.
A confirmed close shows that:
Buyers are willing to hold positions,
Selling pressure has been absorbed,
The probability of continuation is significantly higher.
5. Practical application
A healthy trading mindset:
❌ Do not enter just because price touches a high
✅ Wait for a clear candle close
✅ Prioritize:
Close above → pullback → continuation
Or a strong close with structure remaining intact
If there is no confirmed close, there is no reason to rush.

Gold price continues to reach a new all-time high - waiting for ⭐️GOLDEN INFORMATION:
The UK and Germany are reportedly considering boosting their military footprint in Greenland to underscore Europe’s commitment to Arctic security amid heightened geopolitical strains, following last week’s arrest of former Venezuelan President Nicolas Maduro by US forces. Rising global uncertainty continues to underpin demand for traditional safe-haven assets such as Gold.
Meanwhile, a mixed US employment report has reinforced expectations of further Federal Reserve rate cuts, lending additional support to the yellow metal. Lower interest rates reduce the opportunity cost of holding non-yielding assets, keeping Gold well supported.
⭐️Personal comments NOVA:
Gold prices continue to rise - officially reaching a new all-time high. Strong buying pressure continues.
⭐️SET UP GOLD PRICE:
🔥SELL GOLD zone: 4633 - 4635 SL 4640
TP1: $4620
TP2: $4605
TP3: $4590
🔥BUY GOLD zone: 4515 - 4513 SL 4508
TP1: $4530
TP2: $4545
TP3: $4560
⭐️Technical analysis:
Based on technical indicators EMA 34, EMA89 and support resistance areas to set up a reasonable BUY order.
⭐️NOTE:
Note: Nova wishes traders to manage their capital well
- take the number of lots that match your capital
- Takeprofit equal to 4-6% of capital account
- Stoplose equal to 2-3% of capital account

SPY – ATH into Heavy Macro Week | Trend Still IntactThesis
AMEX:SPY continues to trade in a mature but intact bullish cycle, pushing to new all-time highs despite a heavy macro and event-driven calendar.
Context
- Weekly timeframe
- CPI, PPI, Jobless Claims ahead
- Start of key earnings season
- Supreme Court ruling delayed into next week, adding uncertainty
What I see
- Market printed another ATH and closed the week at the highs
- Price remains well above rising trend support
- No visible distribution or topping structure yet
- Momentum remains strong despite known macro risks
What matters now
- As long as price holds above the rising channel, the trend remains bullish
- Last CPI print came in much cooler than expected
- A second consecutive soft CPI would confirm a disinflation trend and likely fuel further upside
- Market is clearly not pricing near-term stress
Buy / Accumulation zone
- This is not an area for aggressive new buying
- Focus shifts from adding risk to managing and cleaning the portfolio
- Selectively trimming positions that fully rode the last 5–6 years of the cycle
Targets
- Trend-following extension remains open toward higher Fib projections
- No confirmed cycle top yet
Risk / Invalidation
- A sustained loss of the rising channel would signal the need to reduce exposure
- Until then, price action favors holding, not anticipating a top

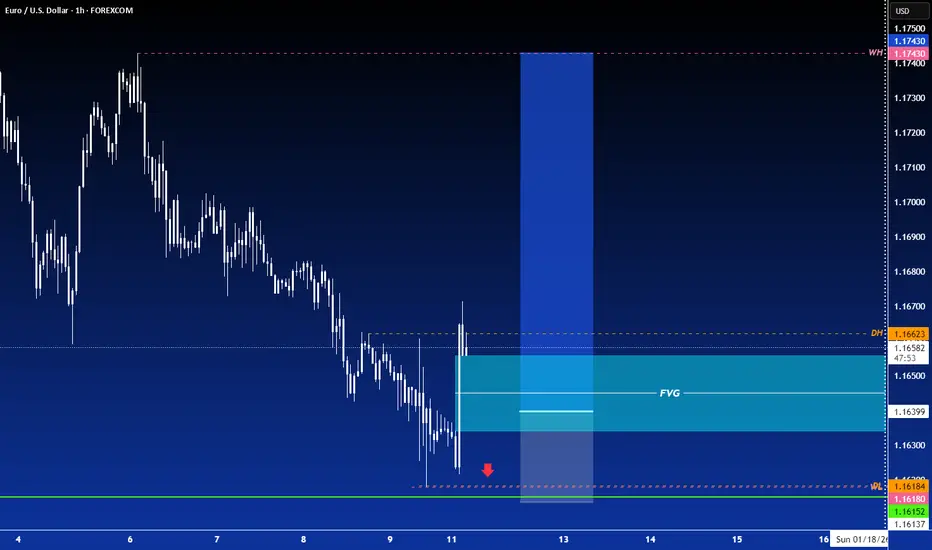
LONG ON EUR/USDEUR/USD has just given a CHOC (change of character) to the upside from is recent downtrend.
The dollar (DXY) is very bearish and I expect EUR/USD to simply retrace a little deeper into the FVG before it begins to rise.
looking to make 80-100 pips.
EUR/USD – Losing Momentum, Downside Risk BuildsAfter a rather unconvincing rebound , EUR/USD is now showing clear signs of slowing down . Bullish momentum is no longer sustained, while selling pressure appears more consistently each time price moves into higher levels. This behavior reflects a market that is gradually shifting into a defensive stance.
From a broader perspective, the U.S. dollar continues to retain support as expectations for monetary easing remain restrained, while the euro lacks sufficiently strong catalysts to spark a fresh upside move. This divergence in policy expectations makes it difficult for EUR/USD to sustain any meaningful rally.
On the technical front, the pair has been repeatedly rejected at the descending trendline and the upper Ichimoku cloud , with rebounds capped around 1.1700–1.1720 before quickly rolling over. This price action clearly indicates that sellers remain in control of the market’s primary direction.
On the downside, 1.1640 stands as the nearest key support. Should this level fail to hold, EUR/USD is likely to extend its decline toward the lower support zone near 1.1600, where the market may attempt to establish a new equilibrium.

Long BTCUSDD1: price is in a corrective rally and has tested the upper OB zone three times. After a period of consolidation, price drops again but fails to break below the lower consolidation zone and instead stalls.
h1: price returns to the key OB zone and forms two strong bullish corrective legs. Although selling pressure pushes price down, it fails to break the base price zone. The current price cluster forms a bullish candle with strong volume, therefore a long position is justified.

Gold price returns to all-time high - above 4550.✍️ NOVA hello everyone, Let's comment on gold price next week from 01/12/2026 - 01/16/2026
⭐️GOLDEN INFORMATION:
December Nonfarm Payrolls undershot both forecasts and the prior reading, though the Unemployment Rate declined and Average Hourly Earnings met expectations. Housing indicators signaled continued cooling, with Building Permits and Housing Starts easing. Meanwhile, the preliminary January University of Michigan Consumer Sentiment beat estimates, despite households remaining concerned about medium-term inflation.
⭐️Personal comments NOVA:
Gold prices return above 4500 - continuing the uptrend with a new all-time high expected next week.
🔥 Technically:
Based on the resistance and support areas of the gold price according to the H4 frame, NOVA identifies the important key areas as follows:
Resistance: $4550, $4630
Support: $4483, $4410
🔥 NOTE:
Note: Nova wishes traders to manage their capital well
- take the number of lots that match your capital
- Takeprofit equal to 4-6% of capital account
- Stoplose equal to 2-3% of capital account
- The winner is the one who sticks with the market the longest

ETH: Symmetrical Triangle ScenarioETH is trading inside a daily symmetrical triangle: lower highs from $3,300–$3,350 and higher lows from $2,850–$2,900.
Liquidation heatmaps show over 1B USD in liquidations stacked both above and below price, so a break of structure can move fast.
📈 Long Idea – Trade the Upside Break
- Trigger: Daily close above 3,300 (triangle resistance and recent supply).
- Entry: Breakout close or retest of $3,300 as support with bullish reaction.
- Invalidation: Close back inside the triangle / below ~$3,150
- Targets:
- T1: $3,500–$3,600
- T2: $3,900–$4,000 on a full triangle measured move and short squeeze.
📉 Short Idea – Trade the Downside Break
- Trigger: Daily close below $2,900 (triangle support).
- Entry: Breakdown close or bearish retest of $2,900 from below.
- Invalidation: Reclaim and close back above $3,000 (bear trap).
- Targets:
- T1: $2,700–$2,600
- T2: $2,200–$2,300 if long liquidations cascade.
🧠 Key Trading Principles
- React, don’t predict: Let a daily close outside the triangle pick direction; this avoids guessing inside the chop.
- Expect volatility: With leverage heavy on both sides, post‑break moves can be unusually sharp, so size positions and stops accordingly.

Market Slows Down: GBPUSD Enters a Balance ZoneThe GBPUSD market is entering a phase of slowing momentum after its previous bullish move. As key economic news from both the US and the UK unfolds this week, capital flows have turned more cautious, causing price to lose its clear bullish drive .
From a fundamental perspective, the US dollar remains supported by expectations around upcoming US economic data, especially labor-market indicators. Meanwhile, the GBP lacks strong supportive catalysts, leaving the pair stuck in a tug-of-war, with downside pressure becoming increasingly visible.
On the chart, GBPUSD is moving sideways within a tight rang e and has been repeatedly rejected near the 1.3470 resistance zone. Price structure suggests that buying momentum is gradually weakening , with recent rebounds appearing more technical than impulsive. The 1.3380 area below is acting as short-term support and remains a likely downside target if price fails to break above resistance.
At this stage, GBPUSD aligns best with a sideways market biased to the downside . The focus should be on monitoring price reactions near resistance for potential short-term sell opportunities, rather than anticipating a fresh bullish trend.
In a market that is waiting for news and lacking strong momentum, patience and discipline remain a trader’s greatest edge.
Wishing you successful and disciplined trading.

Trade Idea on OXYBullish scenario on OXY in 4hr TF
- Bullish Divergence
- Trend break and retest
- Crude Oil hasn't performed in 2025
I am getting some $65 calls for June 2026 Exp

BTC Intraday Long – Liquidity ContextContext
NY session delivered a clean liquidity manipulation.
Heavy long volumes were absorbed and are now acting as support.
Execution Zone
90,000 – 89,700
Looking for long opportunities only with confirmation and within system rules.
Targets
-90,850
-91,530
-92,200
Invalidation
Clear break and acceptance below 89,250 invalidates the idea.
Risk
Trade execution only within your own system. Risk management is mandatory.

EUR/USD – 30-Minute TF Long Retracement (Before Downside)🟢 EUR/USD – 30-Minute TF Long Retracement (Before Downside)
Looking for a 30-minute timeframe long retracement on EUR/USD before the next move lower. Price is expected to pull back into supply / first, then resume the broader downside move.
Strict risk management applied
⚠️ Disclaimer
This is personal analysis for educational purposes only, not financial advice. Trade responsibly and manage risk.

Why You Should NOT Go All-In When Trading GOLDGold is one of the most attractive markets, but it is also where many traders pay the highest price because of a single decision: going all-in. Not because their analysis is wrong, but because they underestimate gold’s volatility.
1. Gold Has Strong Trends, But It Rarely Moves in a Straight Line
Gold can trend beautifully, but along the way there are always:
Deep pullbacks
Sudden news-driven spikes
Liquidity sweeps before the next continuation
When you go all-in, there is no room to absorb volatility. A single short liquidity sweep is enough to knock you out of the trade, even if the final direction is exactly what you anticipated.
2. All-In Turns Small Risk Into “Fatal” Risk
A normal losing trade is simply a trading cost.
But a losing all-in trade can cost you the ability to trade at all.
Trading is not about winning or losing a single position.
It is a game of survival.
3. All-In Damages Your Psychology More Than You Think
When all your margin is tied to one trade:
You fear the stop loss more than you respect market structure
You move your SL emotionally
You hope instead of acting correctly
And in the gold market, hope never pays traders.
4. Gold Is a Liquidity Market, Not an Emotional One
Gold frequently sweeps levels that everyone can clearly see on the chart.
All-in traders who place tight, “perfect-looking” stop losses unintentionally become ideal liquidity for the market.
🎯 Conclusion
All-in is not confidence — it is a gamble.
To trade gold sustainably, you need to:
Split your position size
Keep margin flexibility
Prioritize survival before profits

Why Comparison Feels Productive — And Quietly Destroys YouHello, I’m Camila.
If I’m honest, comparison once felt like a necessary part of growth. It made me feel alert, ambitious, and aware of where I stood. Looking at people ahead of me felt like pressure in the right direction. What I didn’t realize then was that comparison wasn’t pushing me forward — it was slowly pulling my attention away from my own work.
Comparison keeps the mind busy. I would analyze other people’s progress, their speed, their outcomes. It felt productive, almost responsible. But nothing was actually being built. I was thinking about progress instead of creating it, and my brain rewarded me for observation rather than execution.
Over time, comparison changed how I made decisions. Instead of focusing on what I needed to improve today, I started measuring myself against someone else’s timeline. That shift led to rushed moves, unnecessary doubt, and a growing impatience with my own pace. Not because I was doing poorly — but because I was constantly looking elsewhere.
The real cost wasn’t a loss of confidence. It was a loss of trust in my process. Once that trust faded, hesitation took over. And hesitation, more than failure, is what quietly slows everything down.
If there’s one thing I’ve learned, it’s this: real progress is quiet. It doesn’t demand comparison to feel valid. When I focus on my own work and my own pace, growth takes care of itself — without the noise.
Traders, If you liked this educational post, give it a boost and drop a comment.

Gold prices recover - awaiting NFP breakout.⭐️GOLDEN INFORMATION:
Gold prices stabilize ahead of the US Nonfarm Payrolls release as firmer labor market data and a stronger US Dollar weigh on the metal. The Greenback is rebounding after employment figures showed a sharp slowdown in job losses in December, while Initial Jobless Claims beat expectations despite a weekly increase. A narrower US trade deficit has further bolstered USD sentiment.
⭐️Personal comments NOVA:
Gold recovered and maintained buying pressure above 4400, awaiting the NFP results today.
⭐️SET UP GOLD PRICE:
🔥SELL GOLD zone: 4518 - 4520 SL 4525
TP1: $4505
TP2: $4490
TP3: $4475
🔥BUY GOLD zone: 4400 - 4398 SL 4393
TP1: $4416
TP2: $4430
TP3: $4445
⭐️Technical analysis:
Based on technical indicators EMA 34, EMA89 and support resistance areas to set up a reasonable SELL order.
⭐️NOTE:
Note: Nova wishes traders to manage their capital well
- take the number of lots that match your capital
- Takeprofit equal to 4-6% of capital account
- Stoplose equal to 2-3% of capital account

XAU/USD – Corrective pressure returns as the market awaits NFPAfter a strong rally earlier this week, gold is showing clear signs of cooling during the Asian session. A rebound in the U.S. dollar has created noticeable headwinds, while market sentiment has turned cautious ahead of the U.S. Non-Farm Payrolls (NFP) report —a key catalyst that could shape short-term expectations for Fed interest rate policy .
From a technical perspective , on the H4 timeframe, price failed to sustain bullish momentum as it approached the 4,500 resistance zone. Subsequent rebounds have been largely technical in nature and quickly faded, highlighting a lack of conviction from buyers. A move below the short-term balance area opens the door for a corrective pullback toward 4,400 (TP1), with a deeper extension toward 4,330 (TP2)—a confluence of support and the medium-term ascending trendline. Only a decisive breakout above 4,500 would meaningfully ease the current downside pressure.
In summary , with USD strength persisting and markets staying on the sidelines ahead of NFP, the short-term corrective scenario remains favored. The ongoing pullback can be seen as a necessary reset, allowing the market to rebalance before gold establishes a clearer directional bias in the sessions ahead.

MDLZ Swing Long 1H Aggressive TradeAggressive Trade
- short impulse
+ exhaustion volume T1
+ support level
+ exhaustion volume 2Sp+
+ weak test
+ first bullish bar close entry
Calculated affordable stop limit
1 to 2 R/R take profit
1D CounterTrend
"- short impulse
+ volumed TE/T1
+ support level
- below volume buildup
+ reverse volume weak approach
+ exhaustion volume Sp"
1M CounterTrend
"- short impulse
+ exhaustion volume TE/T1
+ support level
+ weak approach
+ exhaustion volume manipulation bar without result"
1Y Trend
"+ long impulse
+ 1/2 correction
- SOS above JOC level
+ support level
- ultravolumed manipulation bar"

GOOG is trading at overhead resistance but chart is constructiveGOOG is pressing into overhead resistance near $325. The EMAs have turned bullish, with the shorter green EMA now above the longer orange EMA, and the RSI holding above 50. If momentum stays intact and the EMAs begin to widen with positive slope, the probability of a breakout above the resistance zone increases.
Noteworthy, Cantor Fitzgerald has turned bullish on Alphabet, arguing its AI edge will support further gains. The broker upgraded the shares to overweight with a higher $370 target, noting Gemini and Google’s wider AI stack remain under-appreciated. With regulatory pressure easing and revenue momentum building in search and cloud, Cantor thinks Alphabet’s competitive position is strengthening despite last year’s strong rally.

GBP/JPY – Uptrend Weakens, Correction Risk RisesAfter a strong and decisive rally , GBP/JPY is clearly entering a cooling phase as the market begins to reassess risk. Cautious sentiment is returning , while a recovery in the Japanese yen is reducing the pair’s previous upside momentum.
On the macro side, the JPY is finding support from expectations that the Bank of Japan will continue its tightening path , whereas recent UK data have not been strong enough to provide fresh momentum for GBP. As global risk appetite softens, yen crosses typically come under early corrective pressure.
From a technical perspective, GBP/JPY has clearly reacted at the upper resistance zone and is showing signs of exhaustion after multiple failed breakout attempts. Price is now hovering around a balance area, while the short-term structure favors a pullback toward lower support. This suggests that buying pressure is gradually losing control, giving way to profit-taking activity.
In the preferred scenario , unless price can reclaim and hold above the current resistance, GBP/JPY is likely to extend its correction to seek a lower equilibrium level. This move can be seen as a necessary cooldown after a strong advance, before the market commits to its next directional move.

AUD/USD – Corrective pressure emerges after inflation coolsIt can be observed that AUD/USD is starting to show signs of slowing down after a relatively smooth advance. While the medium-term trend has not been fully broken , the latest macroeconomic factors from Australia are making the market more cautious toward the AUD.
From a fundamental perspective, Australia’s November CPI fell more than expected (3.4% vs. a 3.6% forecast and down from 3.8% previously). This indicates that headline inflation pressures are easing rapidly, particularly due to lower electricity prices. For the market, this development reduces expectations that the RBA will maintain a hawkish stance, thereby adding short-term downside pressure on the AUD — despite core inflation remaining sticky.
On the chart, AUD/USD has moved close to the resistance zone around 0.6780 within its ascending channel and is starting to show signs of exhaustion. Price is pulling away from the upper boundary of the channel, while 0.6730 stands out as the nearest support level. The current structure leans more toward a technical correction rather than a renewed bullish breakout.
In the base scenario, if selling pressure persists , AUD/USD may pull back to retest 0.6730, or even extend lower toward the lower support area of the ascending channel. Only if core CPI unexpectedly shifts RBA policy expectations would the AUD have a chance to regain immediate upside momentum.
Overall, AUD/USD is entering a necessary “cool-off” phase . With inflation easing and technical resistance overhead, the current pullback is more likely a rebalancing move before the market commits to a clearer directional bias.

$AVGO Wants More What it dew Yall! Happy New Year! Its Up and Stuck lol. I'm so excited for Life, this will be a wonderful trading year! Let's Kick off the 1st TA for NASDAQ:AVGO on the 1 HR time frame.
(8/14/21 EMA's are used)
-Price has rejected at the 0 level once; however, the anchor is the 0 so it’s kinda like a rejection twice.
-The EMA were stacked for a down bias however they are now flipping indicator buying pressure picking up.
-If price can close above the 0.618 zone before the EOD that’ll look better: buyers gaining control
S/L is at the 0. I look for candles to close below this area not just wick through them. I study these types of entries so I'm always taking a small risk and entering around the .0382 zone (for calls). The R:R is a chef kiss.
This is not financial advice, educational purposes only.
Happy Trading Alerts Set!

PEPE: Weekly Downtrend; Breakout or Fade?PEPE bounced from the demand zone and is pushing into the weekly downtrend line. Plan is to wait for a clean breakout, then ride momentum higher instead of guessing the reversal early.
Entry (long):
👉 Anywhere inside / just above the grey box, around 0.00000034–0.00000038.
Stop‑loss:
❌ Below the demand zone and last wick low, around 0.00000030.
Take‑profit:
🎯 At, or slightly below, the blue trendline resistance, around 0.00000048–0.00000052.
DISCLAIMER
The plan is a short‑term long from support into that trendline, but this is a counter‑trend move and therefore high risk, it should be treated with extra caution and small size.
