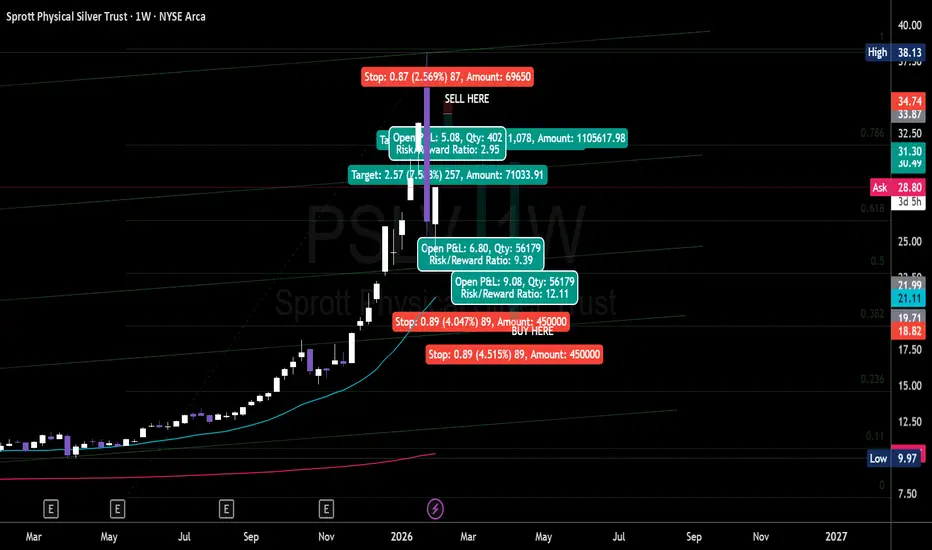
PSLV – Physical Silver Momentum BreakoutSprott Physical Silver Trust (PSLV) tracking physical silver with a focus on trend, momentum and volatility. This layout highlights key swing zones, breakout levels and pullback areas for active traders. Ideal for short‑ to medium‑term plays on silver strength, hedge positioning, and tactical entries around supply/demand imbalances.
Longterminvesting
Silver Futures | Daily ChartSilver has moved into a vertical rally phase, showing strong momentum but now entering a possible EXHAUSTION GAP ZONE
Sharp impulsive move after accumulation
Price far extended from base → mean reversion risk
Volume expansion supports trend, but follow-through needs monitoring
Sustaining above this zone keeps the bullish bias intact
Failure to hold may lead to short-term consolidation or retracement
📌 Trend is bullish, but risk increases at higher levels.
Educational view only. Not a buy/sell recommendation.

BIDU – Wave 3 Progress UpdateThesis
NASDAQ:BIDU continues to advance within a developing Wave 3 structure after completing a multi-year corrective phase and confirming a major breakout.
Context
- Weekly timeframe
- Prolonged correction from 2021 into mid-2025
- Transition completed: downtrend → base → breakout
What I see
- BIDU stood out this week despite a weak and volatile broader market
- Higher high printed at the start of the week, followed by another +5% push today
- Breakout remains clean, with price holding above former channel resistance
- Acceptance above long-term trend support confirms impulsive behavior
- Structure remains consistent with an advancing Wave 3
What matters now
- Holding above the $155 breakout area is key
- A successful hold confirms Intermediate Wave 4 is complete
- That opens the path toward the Cycle Wave 3 objective
Buy / Accumulation zone
- Core accumulation completed earlier between $70–$90 (H1 2025)
- Additional buys executed at ~$118 ahead of the breakout
- Further adds taken post-breakout after support confirmed outside the channel
- Next opportunity comes only on a confirmed higher-degree pullback
Targets
- Cycle Wave 3 target: 1.618 Fib extension at $225 area
- Higher extensions remain possible if momentum persists
Execution note
- Patience through a 9-month base was rewarded with a +100% move
- Recent adds followed rules and structure — discipline is paying off

Target 40% CAGR: 2026 High-Alpha PortfolioObjective: I’m targeting a 40% CAGR with this allocation. It’s an aggressive goal, but I believe it’s achievable by concentrating capital into "monopoly-moat" tech while using a structural hedge to buy the dips.
The Asset Mix:
Growth Engine (75%):
The AI Backbone: NVDA (20%) / AVGO (15%) / TSM (10%). Pure infrastructure play.
Software Scale: PLTR (10%) / MSFT (5%) / AMZN (5%). High-margin recurring revenue.
Disruptor: TSLA (10%). High-beta kicker for autonomy/robotics.
Capital Preservation (25%):
BRK.B (10%) / GLD (10%) / GS (5%). These are my "shock absorbers." They provide the liquidity and stability needed to survive volatility.
Execution Logic: By pairing high-beta assets with non-correlated hedges, I’m optimizing the Sharpe Ratio to ensure I can stay fully invested even during market corrections.
Management:
Quarterly Rebalancing: I will rebalance weights back to these targets every 90 days. This systematically forces me to sell overvalued winners and rotate into undervalued laggards.
Public Record: Logged on IBKR/OKX. Posting here for real-time transparency and accountability.

NVO – Long-Term Cycle View (5–7 Years)Thesis
NYSE:NVO is transitioning from a completed Cycle Wave 2 into a new multi-year expansion phase. The long-term bull structure remains intact, with fundamentals now acting as a catalyst for the next cycle leg.
Context
- Weekly timeframe
- Primary bull trend originates from the 2009 GFC low (< $1)
- Cycle Wave 1 completed in July 2024
- Deep corrective Cycle Wave 2 now appears complete
What I see
-Structural reversal underway from long-term trend support
- Price stabilizing in a major accumulation / buy zone
- New Wegovy pill acts as a fundamental trigger aligning with the technical reversal
- Momentum and structure support the start of Cycle Wave 3
What matters now
- Holding the current base keeps the Cycle Wave 3 thesis intact
- This phase is about accumulation, not timing short-term moves
Buy / Accumulation zone
- Current zone remains suitable for long-term positioning
- This is where multi-year risk/reward is defined
Targets
- Cycle Wave 3 (1.618 Fib): ~$273. Expected around early 2029. Approx. +450% from the buy area
- Cycle Wave 5: ~$415. Expected around 2033. Approx. +730% from the buy area
Income
- Dividend yield ~2.1% adds meaningful carry while holding
Conclusion
Strong technical cycle alignment + improving fundamentals make NYSE:NVO a compelling long-term hold. This is a position built to be held through volatility, not traded.

ETHUSD – Weekly Update | Key Level Being TestedThesis
CRYPTOCAP:ETH remains in a long-term bullish structure. Price is rotating higher without a full reset to the 200WMA, suggesting underlying strength and a continuation bias.
Context
- Weekly timeframe
- Long-term ascending wedge intact
- Prior cycle highs still acting as structural reference
What I see
- ETH did not retest the 200WMA around $2450
- Price reclaimed the 50-day MA around $3000
- ETH is now testing the 0.5 Fibonacci level near $3160
- Structure shows higher lows and improving momentum
What matters now
- $3160 needs to flip to support to confirm continuation
- A successful hold here opens a move toward the upper wedge boundary
- Momentum remains constructive while price stays above the 50-day MA
Buy / Accumulation zone
- Current area around $3160 becomes actionable if confirmed as support
- Deeper pullbacks toward moving averages remain secondary opportunities
Targets
- Near-term: $3800 area (200-day MA + upper wedge confluence)
- Long-term cycle target: ~$9000 (Wave 5 extension)
Risk / Invalidation
- Loss of $3000 and failure to hold the 50-day MA would delay the bullish scenario

You Don’t Need 100 Coins – You Need 1 Plan!b]Hello Traders!
In crypto, most traders believe the key to success is owning every new coin that launches.
They fill their portfolio with 50, 80, even 100 different tokens, hoping one of them will explode and make them rich.
But here’s the truth: you don’t need 100 coins, you just need 1 clear plan.
Because in trading and investing, confusion kills returns, and clarity creates wealth.
1. The Illusion of Diversification
Having too many coins doesn’t make you diversified, it makes you distracted.
True diversification means spreading across uncorrelated assets, not buying every token that trends on Twitter.
Most altcoins move with Bitcoin anyway, so holding 50 of them doesn’t protect you when the market drops.
Owning too much is often a sign of uncertainty, not strategy.
2. The Power of Focus
The most successful investors study deeply, not widely.
They pick a few strong assets, understand their fundamentals, and hold through noise.
You make money by conviction, not collection.
Warren Buffett once said:
“Diversification is protection against ignorance.”
In crypto, it’s often protection against not doing your homework.
3. Why You Need a Plan, Not Picks
A trading plan defines when to buy, when to sell, and how much to risk.
It removes emotion, because you already know what to do when volatility hits.
Without a plan, even 100 coins can’t save you from panic or greed.
With a plan, even one good asset can make you financially free.
The market doesn’t reward how many coins you own, it rewards how you manage them.
4. What a Simple Crypto Plan Looks Like
Step 1: Choose 3–5 coins with real use case, strong community, and consistent development.
Step 2: Define your investment horizon, 1 year, 3 years, or 5 years.
Step 3: Allocate capital based on conviction, not hype.
Step 4: Use SIP or DCA to build positions over time.
Step 5: Rebalance every 6 months to maintain focus and risk control.
That’s it, simple, structured, and powerful.
Rahul’s Tip:
If you ever feel overwhelmed by too many coins, step back and simplify.
The more complicated your portfolio looks, the more uncertain your thinking is.
Remember, wealth doesn’t come from chasing everything. It comes from mastering something.
Conclusion:
The biggest trap in crypto is believing more coins mean more chances.
But true success belongs to those who build systems, not collections.
You don’t need 100 coins, you just need 1 plan that you actually follow.
If this post helped you rethink your strategy, like it, share your thoughts in comments, and follow for more clear and practical crypto insights!

Ethereum is deciding where it wants to live.This is not a trade idea, this is a long term concept, most of my portfolio is swing when bull market comes (monthly/yearly) not trade (daily/weekly).
This is a solid question that will have to be played out in the upcoming years, Ethereum keeps changing its monetary policy and right now has less supply increase than BTC (due to burning mechanisms), will that stay forever? What will happen in the future to the policy? What it will mean for price?
Right now we can clearly see this is a bull case for future months.

Oberoi Realty Ltd – Bull Snort Emerging Near Long-Term TrendlineOberoi Realty Ltd – Bull Snort Emerging Near Long-Term Trendline
NSE:OBEROIRLTY
📈 Pattern & Setup:
Oberoi Realty is showing a classic Bull Snort setup after a long period of base formation. The stock had been moving within a descending channel for months, but recently gapped up strongly from its pivot low near 1600 — signaling aggressive buying interest.
The price is now approaching its long-term trendline resistance, and a close above 1720–1730 could confirm a structural breakout. This move, backed by rising volume and clean higher lows, suggests smart money accumulation at lower levels.
The setup aligns with the broader recovery theme seen across real estate counters, positioning Oberoi Realty for a potential trend reversal rally.
📝 Trade Plan:
✍Entry: Above 1730 (breakout confirmation)
🚩Stop-Loss: 1620 (below recent pivot low)
🎯Targets:
Target 1 → 1970
Target 2 → 2275 (28% potential move)
💡 Pyramiding Strategy:
1. Enter with 50–60% position above 1730
2. Add more once the stock sustains above 1800 with volume confirmation
3. Trail stop-loss to 1675 once price holds above 1900
🧠 Logic Behind the Setup:
The “Bull Snort on Gap-Up” marks the early sign of accumulation strength. This pattern often precedes a strong momentum rally — especially when combined with a trendline test after a prolonged consolidation. The current volume action indicates that smart money has already begun positioning for the next up leg.
Keep Learning. Keep Earning.
Let’s grow together 📚🎯
🔴Disclaimer:
This analysis is for educational purposes only. Not a buy/sell recommendation. Please do your own research or consult your financial advisor before trading.

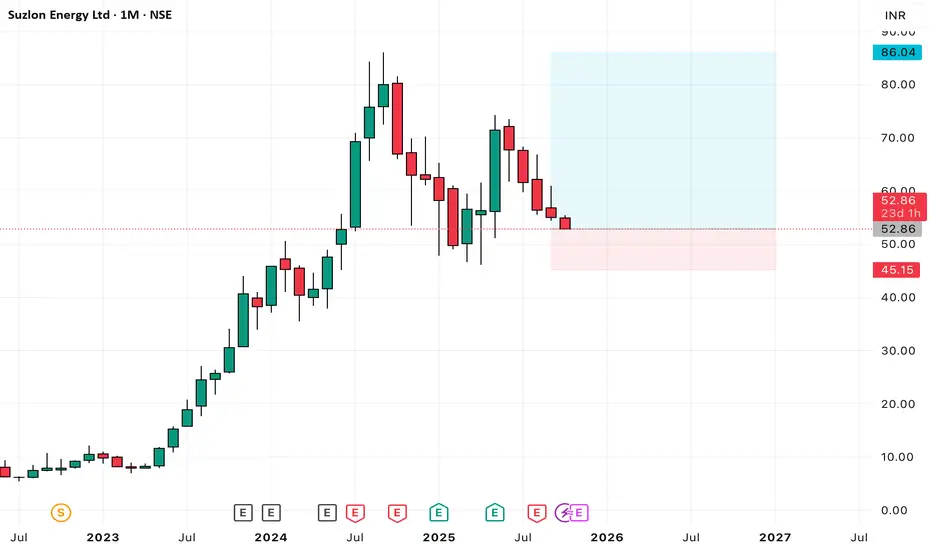
SUZLON positional long setupSUZLON positional long setup
Entry - 49.7 to 52.86
Stop loss - 45.15
Target - 86.05
Risk Reward - 1:4.3
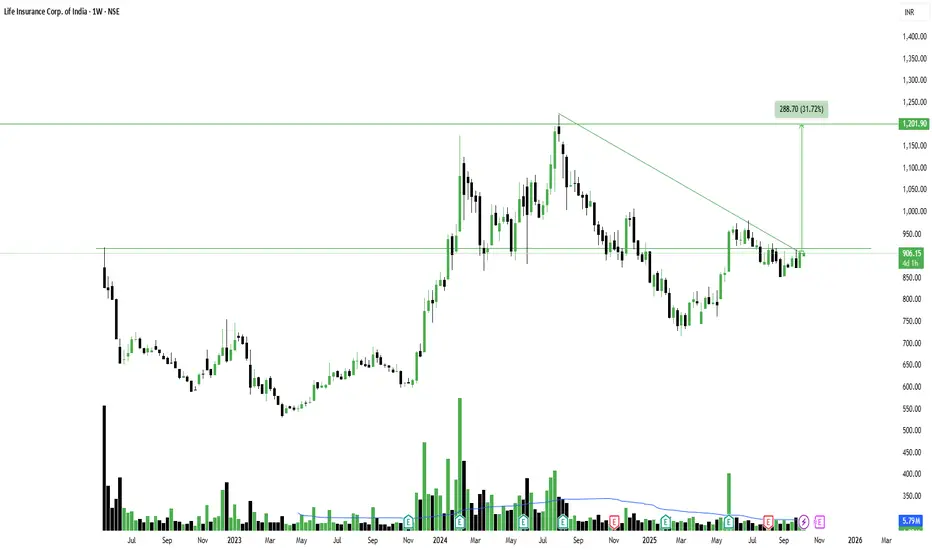
LICI - Weekly Chart Trendline BreakoutBreakout from Falling Trendline on Weekly Chart in LIC India
NSE:LICI
📈Pattern & Setup:
Life Insurance Corporation of India (LIC) is showing a potential breakout from a long-term falling trendline on the weekly chart. The stock has been consolidating just below the 900–920 zone, which has acted as a key resistance area multiple times in the past.
The current structure indicates that bulls are gradually gaining control, with price attempting to sustain above the trendline. Volume has started picking up, suggesting early accumulation before a possible breakout continuation.
📝 Trade Plan:
Entry: Accumulate between 900–910 levels (preferably on weekly closing confirmation above 915).
🚩Stop-Loss: 850 (below recent consolidation base).
🎯Targets:
Target 1 → 1040 (intermediate resistance).
Target 2 → 1200 (measured move target, 30% upside).
💡Pyramiding Strategy:
1. Enter first lot around 900–910.
2. Add above 940 on confirmed breakout with volume, trail SL to 880.
3. Add final lot above 1040 breakout, trail SL to 940.
🧠Logic Behind Selecting this Trade:
This setup is a clean example of a long-term trendline breakout after a prolonged correction phase. The price is forming higher lows with rising volume — a sign that the downtrend is weakening. Once it sustains above 915 on a weekly basis, the momentum could accelerate sharply towards 1200.
Keep Learning. Keep Earning.
Let's grow together 📚🎯
🔴Disclaimer:
This is not an investment advice. Always do your own due diligence before making any trading or investment decision.
Deepak Nitrite - Long-term supportPrice action: Trading ~45% below all-time high → indicates long-term weakness, but also potential value zone if support holds.
Support levels:
Same zone was tested in July 2022, Feb 2023, and again in Feb 2025.
Multiple tests of the same support increase its significance—but repeated retests without strong bounces can weaken it.
RSI (Monthly): Around 40 → in the “watch zone.” This shows potential for reversal if buyers step in.
200 MA: Trading below the 200-day moving average → structurally bearish trend in the medium-to-long term.
🔎 Interpretation
Bullish case:
If this support holds again, a bounce could lead to a relief rally (short to medium term).
RSI at 40 suggests downside is limited compared to when RSI was much higher.
Bearish case:
Multiple retests of the same support often precede a breakdown.
Trading below 200 MA means the broader trend is still down.
If it decisively breaks this support zone, the next leg lower could be sharp.
⚖️ Strategy Thoughts (not financial advice)
Aggressive traders: Can consider accumulating near support with strict stop-loss just below it.
Conservative traders: Wait for confirmation → either a strong bounce with volume from support, or a reclaim of the 200 MA.
Investors: Might prefer to see consolidation and stability before entering, since RSI is not yet oversold.
✅ Key levels to watch:
Support zone: The level tested in Jul ‘22 / Feb ‘23 / Feb ‘25 (critical to hold).
Resistance: 200 MA (any move above with volume = trend reversal signal).

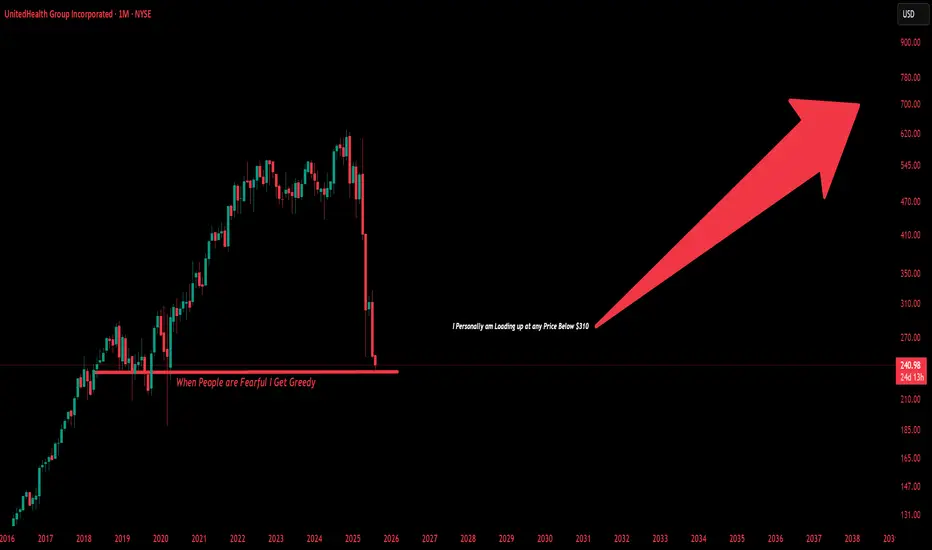
$UNH This Behemoth Is Not Going Anywhere and I am Loading Up United HealthGroup is extremely Appealing to me at these valuations. Health Insurance Is something all people need. I Don't See Medicaid/Medicare Cuts affecting NYSE:UNH To the extent People believe it will. Legislation can be temporary, This Company Produces 20B Plus in Free Cashflow Every single Year Let alone 420B in Revenue its a behemoth controlling more than 30% of American Health Insurance in terms of Market Share. The United States could never afford to socialize Healthcare the way Europe Or Canada does. Social Security/Health/Medicare already eat up 49% Of GDP. The United States is almost dependent on companies Like United Healthgroup to provide its services. This Could almost Give Companies like NYSE:UNH an opportunity to offer plans to gain more customers who before had Government assisted health insurance. While more downside is almost Guaranteed I see nothing more then even better discounts for the long-term. This is not a question of If UNH Can recover its only a question of how long will it take. We are back at Prices Pre Covid-19.
---------------------
Possible Reasons for the Major Drops:
The Big Beautiful Bill
DOJ Lawsuits
Rising Medicare Costs
Rising Expenses on Insurers
Swapped CEO Twice
Swapped CFO Once
Lawsuits
Scandals
---------------------
NYSE:UNH Fundamentals:
Price To Sales: 0.5x
Price To Earnings:10.3x
Price to Book: 2.2x
---------------------
Balance Sheet:
Cash: US$32.02b
Debt: US$104.78b
Total Liabilities: US$203.79b
Total Assets: US$308.57b
---------------------
Management Efficiency:
ROE: 21.1%
ROCE: 15.5%
ROA: 8.2%
---------------------
Dividend Safety:
Dividend Yield: 3.7%
Payout Ratio: 37% of Profits
---------------------
I recently Began Acquiring Shares around the $260 Mark and plan on continuing to load up for the long-term.
---------------------
This is not financial Advice, Just what I am doing on my own as an investor. I do not give Buy/Sell/Hold Signals.
ENIC: Can You Ignore This Massive Cup And Handle?ENIC (Enel Chile S.A.) is a Chilean utility company primarily engaged in the generation, transmission, and distribution of electricity. A key player in the Chilean energy sector, the company focuses on serving residential, commercial, industrial, and government customers.
Technical Analysis
ENIC's chart exhibits a classic " cup and handle " pattern, a bullish continuation formation that signals a potential for a significant upward move.
Understanding the Cup and Handle Pattern
The cup and handle pattern, developed by William J. O'Neil, is a technical chart pattern that looks like a teacup with a handle. It is considered a bullish signal and is formed after an uptrend, indicating a period of consolidation followed by a continuation of the upward movement.
The "Cup": The cup is a rounded, "U" shaped formation that shows a price drop, a stabilization period at the bottom, and a rally back to the original price level. A rounded bottom is preferred over a sharp "V" shape, as it indicates a more stable consolidation.
The "Handle": The handle is a smaller, downward-sloping or sideways consolidation that forms on the right side of the cup. It represents a period of profit-taking by early buyers before the next leg of the rally.
ENIC's Current Setup
The chart shows the formation of a well-defined cup and handle pattern. The neckline, which is the resistance level at the top of the cup, is identified between $3.44 and $3.50.
Breakout Confirmation: Traders should monitor the price for a clean breakout above this neckline on strong volume. A breakout would confirm the pattern and signal a potential move to the upside.
Measured Move Target: The measured move of the cup and handle pattern, which is calculated by taking the height of the cup and adding it to the breakout point, sets a first target price of $5.80. This would represent a 70% return from the current levels if the breakout is confirmed.
Fibonacci Extensions: For potential longer-term targets, Fibonacci extensions provide additional price levels to monitor:
Fibonacci Extension No. 1: $6.22
Fibonacci Extension No. 2: $7.20
Historical Performance
Since July 2022, ENIC has shown strong momentum, generating a 250% return for long-term investors. This impressive performance, combined with the current bullish chart pattern, suggests the stock could be poised for another significant move.
Sector: Utilities
Country: Chile
Suitable for long term investors
Disclaimer: This is a technical analysis based on chart patterns and is not financial advice. All trading involves risk. It is crucial to conduct your own due diligence and consider your personal risk tolerance before making any investment decisions.

JK Tyre gripping the market! Potential wealth creator in market.JK Tyre is currently showing strong technical strength on the weekly timeframe:
The stock is sustaining above its 9-year law of polarity, with a major support zone around ₹250–260, which has already been respected.
It is trading within a well-defined ascending parallel channel, with channel support near ₹300–320.
Multiple moving averages are also acting as strong support – EMA at ₹270, EMA at ₹290, and SMA at ₹320.
Conclusion:
JK Tyre is technically well-supported at lower levels and is respecting long-term support zones. The stock is showing positive momentum within its channel structure, making it an attractive candidate for medium to long-term investors Best Accumulation Zone: ₹300–320 (near channel + SMA support).
Secondary Entry (deep support): ₹270–290 if the stock dips.

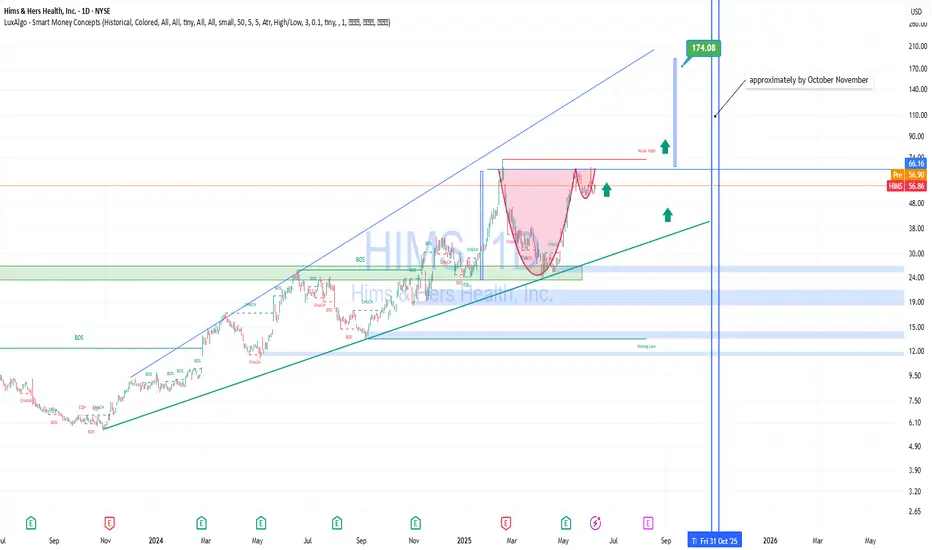
HIMS – Technically and Fundamentally Strong for Mid-to-Long TermTechnical Analysis
HIMS is trading in a clear ascending channel since 2023.
On the daily chart, a “cup and handle” formation has completed, with a confirmed breakout above the neckline ($55–$57 area).
The price is consolidating near the breakout point – classic behavior before a continuation move.
Target projection from the cup pattern is $170+, implying a 200%+ upside potential.
The stock also respects the upper trendline of the long-term channel, reinforcing bullish structure.
Fundamental Strength:
Telemedicine megatrend: Digital health is booming. HIMS is one of the few well-established D2C players in the U.S. market.
Revenue growth: Annual revenue growth exceeds 40% YoY, a sign of operational efficiency and demand.
Sticky subscription model: Over 1.5 million active subscribers — solid base for recurring revenue and LTV.
Valuation upside: Still undervalued relative to sector peers despite recent rally.
Scalable tech stack: Strong backend, customer acquisition systems, and vertically integrated infrastructure support further expansion.
Conclusion: HIMS offers an attractive risk–reward setup for swing traders and long-term investors alike
SHREE DIGVIJAY CEMENET AT LONG TERM SUPPORT ZONEThis is the Weekly chart of SHREDIGCEM.
SHREDIGCEM is trading near it's long term support zone at 60-70 range.
stock has been moving within a long-term parallel channel, with a well-established support zone in the range of ₹65–₹70.
Currently, the stock is forming a broadening pattern near its support zone, with the pattern support range between ₹70–₹75.
If this level is sustain then,we may see higher prices in SHREDIGCEM.

Technical & Historical Key TakeawaysThis chart analyzes the historical price cycles of Gold (XAU/USD) over the past decades, focusing on the alternation between long bull runs and prolonged bear markets.
You highlighted clear phases:
1970 - 1980: 10-year Bull Run
Massive price rally, followed by a sharp correction.
1980 - 2001: 20-year Bear Market
Prolonged sideways and downward movement.
2001 - 2011: 10-year Bull Run
Strong upward trend, reaching new all-time highs.
2011 - 2016: 5-year Bear Market
Significant correction but shorter in duration.
2016 - 2025: 10-year Bull Run
Another strong bullish phase, possibly ending in May 2025.
🔮 Scenarios projected:
Scenario 1 (Blue path):
A shorter bear market (5 years) similar to 2011-2016 correction, then continuation of the long-term uptrend.
Scenario 2 (Yellow path):
Gold enters a long-term 20-year bear market, similar to what happened post-1980.
You are asking if Gold is now entering a short bear phase (Scenario 1) or will fall into a multi-decade bear market (Scenario 2).
Cyclicality of Gold:
Gold has shown repetitive cycles of 10-year bull runs followed by either short (5-year) or long (20-year) bear markets.
These cycles seem to reflect macroeconomic shifts (inflation, interest rates, global crises).
Current Cycle (2016 - 2025):
If we respect the pattern, May 2025 might mark the end of the current bull cycle, opening the door to a corrective phase.
Scenario 1 favors a soft correction:
Based on the last cycle (2011-2016), a 5-year bear market might occur.
This would keep the long-term bullish trend alive, especially if macroeconomic conditions stay inflationary or geopolitical risks remain high.
Scenario 2 warns of a harsh bear market:
If history repeats the 1980-2001 phase, gold could enter a multi-decade bear market, driven by reduced inflation fears, strong dollar cycles, or financial system stability.
Key Indicators to watch:
Real interest rates.
USD strength vs global currencies.
Demand from central banks and emerging markets.
Geopolitical tensions and inflation expectations.

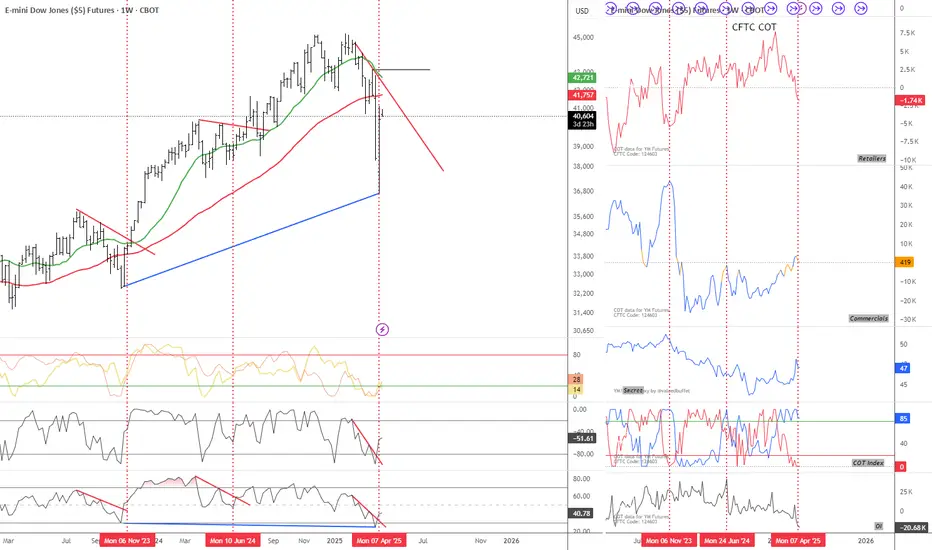
Is it going to happen again? My view to the markets right now...CBOT_MINI:YM1!
Is the Dow Jones breaking the downtrend again?
I believe there's a strong chance the markets are setting up for another move higher. From a fundamental standpoint, the recent pause in tariffs is a big deal. It removes an immediate layer of uncertainty that’s been hanging over the global economy, especially for exporters and multinational companies. On top of that, the fact that key tech products have been left out of the latest tariff actions is boosting confidence in the sector that has been leading market strength for years.
Economically, we’re still seeing resilience in key indicators. Unemployment remains low, consumer spending is steady, and central banks are staying cautious with tightening. The environment still leans more towards slow growth than recession, which supports equities over the medium term.
More importantly, my own criteria for a favorable market setup are lining up. Whether it’s sentiment, intermarket signals, or trend conditions—this looks like a solid spot for a bullish stance.
You can see my chart to check out my current viewpoint on the Dow Jones and how I’m positioning based on all this.
Not Financial Advice
Bill Ackman: The Activist Investor Who Challenges the Status QuoHello Traders!
Today, we’re going to explore the trading and investment philosophy of one of the most successful activist investors in the world – Bill Ackman . Known for his bold moves and unapologetic approach, Ackman has built a reputation for making large, influential investments and actively working to restructure companies in order to create value. With his hedge fund, Pershing Square Capital Management , Ackman has turned millions into billions by taking concentrated positions in underperforming companies, often pushing for changes that he believes will improve shareholder value.
Bill Ackman’s Investment Strategy
Ackman’s investing philosophy is rooted in a few key principles that have guided his success:
Activist Investing: Ackman is known for buying large stakes in companies and pushing for significant changes. This often involves changes in management, strategy, or financial structure to unlock value. He doesn’t just buy stocks, he buys control to influence the direction of companies.
Concentrated Bets: Unlike most fund managers who diversify, Ackman makes concentrated investments, believing in a small number of high-conviction ideas. He typically goes big on the companies he believes will give the highest returns.
Long-Term Vision: While Ackman is an activist, he is also a long-term investor. He’s known to hold onto stocks for years as he works through his plans to improve the companies he invests in.
Thorough Research and Analysis: Before making any moves, Ackman ensures he has done comprehensive research. He’s known for his deep dives into a company’s fundamentals, industry trends, and potential catalysts for growth.
Notable Investments and Activist Moves
Ackman’s career has been built on several high-profile, successful investments. Here are some of his best-known plays:
Herbalife: One of his most controversial investments, Ackman shorted Herbalife, claiming the company was a pyramid scheme. Despite facing heavy opposition and pressure, Ackman stuck to his position, although ultimately the trade didn’t work out as he anticipated. It became a case study in risk and persistence.
Target: Ackman took a large position in Target, pushing for changes in the company’s real estate strategy and retail business. His work with Target helped to bring greater shareholder value.
Valeant Pharmaceuticals: Ackman’s investment in Valeant Pharmaceuticals initially gained massive attention. Despite the stock’s later troubles, his involvement in the company drew attention to the power of activism and led to changes in leadership at Valeant.
Chipotle Mexican Grill: Ackman has also invested in Chipotle, pushing for operational improvements and better management. His efforts have been instrumental in driving changes in the company’s strategy, helping the stock recover from earlier setbacks.
Risk Management and Position Sizing
When it comes to risk management, Ackman follows a few key strategies to minimize losses and maximize returns:
Concentration of Capital: Ackman often places large amounts of capital in a few high-conviction investments. This allows him to have a significant impact on the companies he invests in but also requires disciplined risk management and careful positioning.
Leverage and Shorting: Ackman has used leverage in some of his more aggressive plays, such as shorting positions in Herbalife, to maximize returns. This adds a level of risk, but when used correctly, it can significantly amplify his gains.
Focus on Catalyst-Driven Events: He places his investments based on company-specific catalysts like management changes, mergers, or restructurings. This allows him to predict when a stock will outperform or underperform.
What This Means for Investors
Bill Ackman’s approach to investing is not for the faint of heart. It involves big risks and big rewards. His activist investing style is about taking concentrated positions, being willing to fight for change, and holding onto those investments for the long haul.
For investors, there are valuable lessons to be learned from Ackman’s strategies:
Don’t be afraid to make big bets. If you believe in a company’s long-term potential, be prepared to back it with significant capital.
Know the companies you invest in. Ackman is famous for his in-depth research before making any move. This is a lesson for every investor – do your homework before making investment decisions.
Take a long-term view. While Ackman is an activist, he is also a patient investor. He understands that meaningful change takes time, and he’s willing to wait for the payoff.
Conclusion
Bill Ackman’s approach to investing has made him one of the most influential investors of his time. By focusing on concentrated bets, thoroughly researching companies, and taking an activist role, Ackman has proven that bold moves and long-term vision can lead to great success.
Have you followed any of Bill Ackman’s investments or strategies? Share your thoughts and experiences in the comments below! Let’s learn and grow together!

XRP FINAL STEEP DISCOUNT OPPORTUNITY IS IMMINENTMy time-wave cycles analysis (among other components) indicating we will have a final sell wave to 1.45-1.7 zone over coming days (before FOMC meeting in March imo).
Granted I was a little off on exact timing to reach the buy-side targets back in December but nonetheless accurate on projected price levels..See prior analysis at attached link for the projected high coming in at 3.1-3.3, exactly as it happened...
I have no doubt this final sell wave will also occur. Depending on your goals & trading style, you may treat this next sell wave as an opportunity to simply add more at discounted levels via DCA'ing....or choose to sell at these relative highs to maximize position size once again from sub-1.70 levels.. I DO NOT EXPECT US TO SEE sub-3$ ANYTIMEagain after this next sell wave completes & then buyers take us to 4+ in q2 & beyond.
Expecting this to be the FINAL steep discount buying opportunity for those interested in maximizing their capital purchasing power for long term speculative hodling
Follow for additional actionable alerts & analysis. Appreciate the boosts & looking forward to your comments as well!

Gold Cup and Handle?Gold doesn't seem to move even with high Inflation data in the past months, possibly because the Crypto market is eating slowly it's market.
However it seems like there is potential Cup and Handle which might lead to Gold prices around 2500$ Ounce in the next few years.
A possible catalyst might be invasion of Ukraine, since Gold performs quite well during wars - however I truly Hope this never happens.
Just posting this here so I can keep track of it in the future, will update it if there is any news ahead.

NVIDIA The Next long Too Take I cover NVIDIA Range and where I perceive us to gravitate too from the current level . Watch This Before You Buy Nvidia
