AUDUSD - PREPARING FOR A NEW UPTREND?Symbol - AUDUSD
AUDUSD is currently in a corrective phase after breaking above the resistance of its descending channel. To maintain bullish momentum, the market needs a period of consolidation or the development of a trading range above 0.6525
The US dollar remains in consolidation, showing limited potential for further gains. Growing anticipation ahead of the upcoming Federal Reserve meeting could provide support for the Australian dollar.
The pair is moving into a distribution phase after a period of consolidation. The breakout above 0.6525 confirmed a clean break of the descending channel’s resistance, indicating the early stages of a potential trend reversal. Sustained price action above this level could open the door for continued upward movement.
Resistance levels: 0.6567, 0.6610
Support levels: 0.6525, 0.6493
At present, the pair is attempting to establish a shift in trend direction. The ongoing consolidation and distribution above the previously broken trendline are encouraging signs. However, forming a well-defined trading range will be crucial to confirm the beginning of a new short-term uptrend.
Longtradesetup

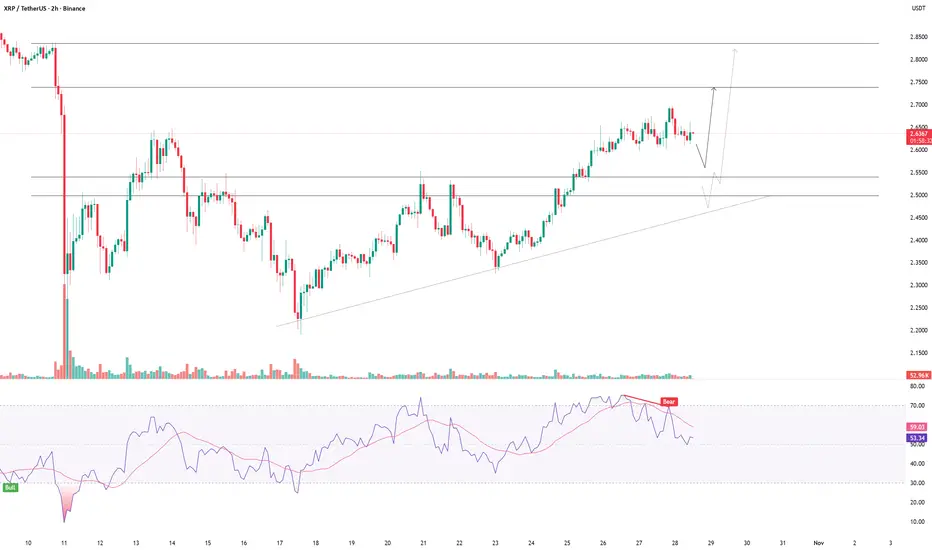
XRPUSDT - BULLISH CONTINUATION IN SIGHTSymbol - XRPUSDT
XRPUSDT is making an attempt to break above the upper boundary of its trading range amid a broader bullish rebound across the cryptocurrency market. A confirmed breakout could develop after a short-term pullback.
The market continues to recover from the liquidation event of last week, with Bitcoin displaying structural strength - hinting at a possible return of bullish momentum. This supports a more optimistic outlook for the overall crypto sector.
Currently, XRPUSDT is testing resistance and entering a consolidation phase. The main breakout point sits near 2.661 However, during consolidation, a retest of support levels remains possible as the market may seek liquidity before a potential upside move.
Resistance levels: 2.661, 2.739
Support levels: 2.587, 2.547, 2.500
Since the beginning of the session, momentum has remained notably strong, though a short correction could occur before the upward trend resumes. During this corrective phase, XRPUSDT may retrace toward the 2.587 – 2.500 zone to gather liquidity before continuing higher.
KIOCL long for 625KIOCL long setup
Entry - 438 to 460
SL - 419 (If closes 2 days below)
Target - 625
Risk Reward - 1:9.8

GIFT NIFTY long setupGIFT NIFTY long setup
Entry - 25232 (Triggered)
Stop loss - 25206
Target - 25467
Risk Reward - 1:9.2

KPIT looks good for 1348KPITTECH looks good to loong for 1348
Entry - 1260
Stop loss - 1240
Target - 1328
Risk Reward - 1:3.5

TANLA looks hot for 725TANLA looks hot for 722 / 725
CMP 688.3
SL 662
RISK REWARD - 1:7
Best entry - 685
Best risk reward - 1:23

Natural Gas long setupNatural Gas long setup
Entry - 265.2
Stop loss - 263
Target - 278.3
Risk Reward - Approx 1:6

Gold price drops, selling pressure and CPI news⭐️GOLDEN INFORMATION:
Gold (XAU/USD) found some buying interest in the Asian session, rebounding from Monday’s steep drop to the $3,341 level — its lowest in over a week. The U.S. Dollar struggled to build on its two-day advance as traders stepped to the sidelines ahead of the release of the latest U.S. consumer inflation data later today.
The Consumer Price Index (CPI) report will be pivotal in shaping expectations for the Federal Reserve’s rate-cut trajectory, which will, in turn, influence the Greenback’s direction and could provide fresh momentum for the non-yielding yellow metal.
⭐️Personal comments NOVA:
CPI expected to increase, DXY increases, selling pressure on gold. Market recovers briefly before US trading session
⭐️SET UP GOLD PRICE:
🔥SELL GOLD zone: 3379- 3381 SL 3386
TP1: $3367
TP2: $3355
TP3: $3342
🔥BUY GOLD zone: $3320-$3318 SL $3313
TP1: $3332
TP2: $3344
TP3: $3356
⭐️Technical analysis:
Based on technical indicators EMA 34, EMA89 and support resistance areas to set up a reasonable BUY order.
⭐️NOTE:
Note: Nova wishes traders to manage their capital well
- take the number of lots that match your capital
- Takeprofit equal to 4-6% of capital account
- Stoplose equal to 2-3% of capital account

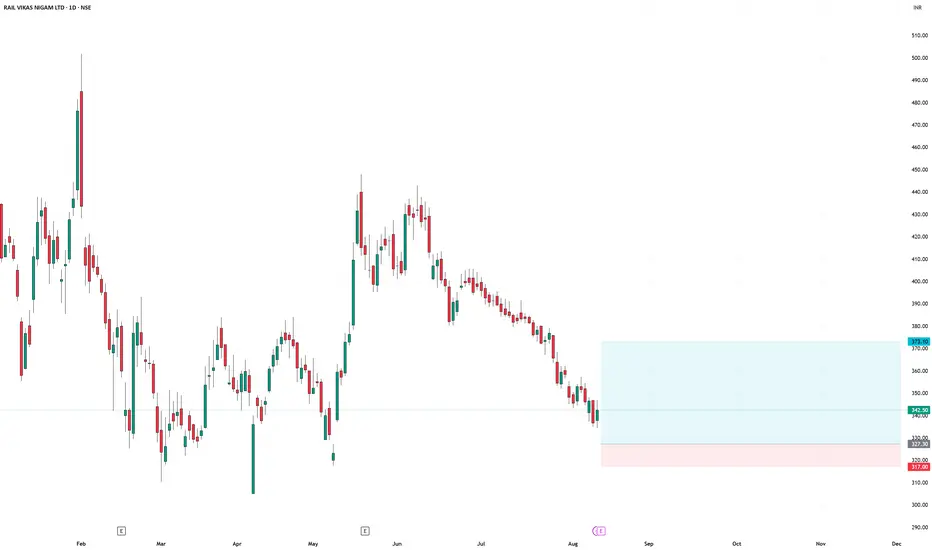
RAIL VIKAS NIGAM LTD swing log setupRAIL VIKAS NIGAM LTD swing log setup
Entry - 327.3
Stop Loss - 317
Target - 373.1
Risk Reward - 1:4.45
#ONDOUSDT expecting further upside📉 LONG BYBIT:ONDOUSDT.P from $1.4891
🛡 Stop Loss: $1.4667
✅ Overview:
➡️ BYBIT:ONDOUSDT.P is trading in a consolidation range, forming a local support level around $1.3705.
➡️ POC (Point of Control) is at $1.3631 , indicating the area with the highest trading volume.
➡️ The price has broken a resistance zone and is now testing it as support, which could be a long entry signal.
➡️ If the asset holds above $1.4048, an upward move towards the next resistance levels is likely.
⚡ Plan:
➡️ Entering a long position at $1.4891 after confirming a hold above the key level of $1.4048.
➡️ Stop-loss is set at $1.4667 , below the recent support zone.
➡️ Expecting a bullish push with a target of $1.5699.
🎯 TP Targets:
💎 TP 1: $1.5699 – the first target level where partial profit-taking is recommended.
💎 TP 2: $1.6000
📢 BYBIT:ONDOUSDT.P shows signs of potential growth, but it’s crucial to monitor the $1.4048 level – a breakdown below could lead to further decline.
📢 Volume remains at an average level, indicating possible position accumulation before a move.
📢 To confirm a strong uptrend, price must hold above $1.4891 and successfully test the $1.5699 resistance level.
🚀 BYBIT:ONDOUSDT.P is shaping a bullish scenario — expecting a breakout and further upside!

$MSTR - The Rocket Takes OffHere is the daily chart for $MSTR. With its recent inclusion in NASDAQ:QQQ , the stock appears poised for further growth.
From a technical perspective, the current triangle formation suggests potential downside movement toward $368, where the price may test the lower boundary of the pattern. Following this, I anticipate a bullish breakout to the upside.
The resistance near the previous all-time high (ATH) is unlikely to hold for long, and I expect NASDAQ:MSTR to surpass this level in its upward trajectory.

AUD/ USD ! 10/31 ! Support H4 and recoveryAUD/USD trend forecast October 31, 2024
The Australian Dollar (AUD) dipped slightly after mixed economic data from Australia and China’s PMI release on Thursday. However, hawkish expectations for the Reserve Bank of Australia’s (RBA) policy outlook helped support the AUD/USD pair and limited its downside. In September, Australian Retail Sales rose by 0.1% month-over-month, below the 0.3% forecast and down from 0.7% in August. Quarterly, Retail Sales grew by 0.5% in Q3, recovering from a 0.3% drop in the previous quarter.
in the large frame - gold price will continue to fall back to strong support and have a larger recovery. In the context of not much AUD news at the end of the year, mainly important USD data
/// BUY AUD/USD : zone 0.64800 - 0.64500
SL: 0.64000
TP: 60 - 300 - 500 pips (0.69500)
Safe and profitable trading

Snow up up upSpeculative Long Position:
After NYSE:SNOW confirmed support around $108, the chart looks more bullish to me in the short term. We’ve seen a bullish move since the beginning of October, followed by a correction in both price and time. With the recent crossover of the 30- and 50-day SMAs, I anticipate another bullish move ahead.

Move up, pull back and up we goAfter reaching its low point in early September, NASDAQ:CPRT appears to have completed its prolonged downward correction and made a sharp bullish move. This move has now been steeply corrected, and I expect the stock price to rise through the end of the year.

A Golden Zone Fib Pullback to 50-38.2%. Very bullish momentum.
The Pound is on fire lately with strength to the upside.
This is educational post to show where a buy order could be placed between 50-38.2 as low as possible.
Stops could be placed at swing low area 1,97.85 (tight)

XAU continues sideways - accumulate waiting for new ATH 2705
✍️ NOVA hello everyone, Let's comment on gold price next week from 10/07 - 10/11/2024
🔥 World situation:
Gold prices pulled back after a stronger-than-expected US jobs report suggested that the labor market remains robust, indicating the Federal Reserve (Fed) may ease policy in smaller 25-basis-point increments. Currently, XAU/USD is trading at $2,643, down 0.40%.
The US Bureau of Labor Statistics (BLS) reported strong job growth for September, easing concerns about the labor market. This reduced pressure on the Fed, which had previously cut interest rates by 0.50% in September amid concerns about reaching its maximum employment goal.
🔥 Identify:
Gold price is sideways - accumulating in a large range of 2625 - 2681. The uptrend on the H4 frame is still stable and waiting for new momentum to reach the next new ATH. In the context of escalating Middle East tensions - gold price continues to increase strongly this year.
🔥 Technically:
Based on the resistance and support areas of the gold price according to the H4 frame, NOVA identifies the important key areas as follows:
Resistance: $2671, $2685, $2705
Support : $2626, 2588
🔥 NOTE:
Note: Nova wishes traders to manage their capital well
- take the number of lots that match your capital
- Takeprofit equal to 4-6% of capital account
- Stoplose equal to 2-3% of capital account
- The winner is the one who sticks with the market the longest


Chart Idea - RUNEUSDT LongRUNEUSDT has broken the downtrend on daily timeframe and successfully retested it.
RUNEUSDT Long
Entry: 5.380
TP: 13
SL: 4.284
It's a swing trade and can go for weeks. Will keep on updating this thread.

Chart Idea - FTMUSDT Swing LongFTMUSDT broke out from it's long bull flag. There are 3 confirmations which lead me to open this long trade.
Bounced
- from the 0.786 fib level
- from upward diagonal support
- from the diagonal support which was the resistance last year in Feb 2023
Entry: 0.76
TP: 1.95
SL: 0.618
It's a swing trade and could take weeks to play out. Will keep on updating on this thread.

JP Power is ready to give a huge moveJP Power has completed a long-term inverted Head and Shoulder pattern recently. Considering this positive move, we should expect a move up to double the current levels from 10.50.
Keep tracking the move and invest sensibly.

USDCAD BUY POSSIBILITY 25/04/2024Looking for a possible bullish run on the break of the the flag
Targeting 1.3846 to 1.3880 level

PYTH/USDT Long Trading Opportunity!#PYTH/USDT SPOT LONG ENTRY
Leverage: 1x
Entries: $0.8536
Take profit 1: $0.9062
Take profit 2: $1.0065
Take profit 3: $1.1408
Stop Loss: $0.7531
NOTE: This is just my prediction. Be sure to use STOPLOSS and remember that I am not a financial adviser. your money, your risk!
Thanks
The sroced.
BINANCE:PYTHUSDT

Long Super Bullish Mode, Gold Target 2114 - 2301 As per (D) TF breakout & and analyzing with (W) & (M) TF's
Following Target is seen :-
1st Target 2114
2nd Target 2145
3rd Target 2174
4th Target 2234
Final Target is set for 2301
Pull back will be seen in middle of each target but overall as per monthly TF BULLs will be seen stronger.
