GBP/CAD: Is the "Loonie" Losing Its Wings in the AI Era?The British Pound (GBP) has established a new tactical foothold against the Canadian Dollar (CAD) following the Bank of Canada’s (BoC) decision to hold rates at 2.25%. While the headline narrative focuses on interest rate differentials, smart money is pricing in a deeper "divergence trade" between the UK’s service-led resilience and Canada’s resource-heavy vulnerabilities.
This analysis dissects why the GBP/CAD pair is moving, looking beyond the central bank transcripts to the structural shifts in technology, cyber-warfare, and innovation that are redefining these two Commonwealth economies.
Macroeconomics: The "Dovish" Hold vs. The "Sticky" Service
The immediate catalyst is the BoC’s caution. By holding rates at 2.25% a level considered stimulative Governor Tiff Macklem admitted that Q4 GDP is "likely to be weak."
* The CAD Drag: Canada’s economy is sputtering due to soft export demand. The central bank is effectively capping the currency’s upside to protect its export engines.
* The GBP Floor: Conversely, the UK’s forecasted 0.1% GDP rebound, while modest, signals stability. The Bank of England (BoE) faces "sticky" service inflation, forcing it to keep rates relatively higher than its Canadian counterpart, creating a yield advantage for Sterling.
Geopolitics & Geostrategy: Arctic Tensions & Trade Wars
The geopolitical risk premium is weighing heavily on the Loonie.
* Canada’s Exposure: Canada is currently navigating a volatile trade environment with its southern neighbour. With protectionist rhetoric heating up in Washington, CAD is vulnerable to US trade tariff threats, which could stifle cross-border commerce.
* UK’s Arctic Pivot: Interestingly, the UK is reasserting itself in the "High North." The 2025 renewed interest in Arctic security positions the UK as a key security guarantor for the GIUK (Greenland-Iceland-UK) gap, adding a layer of "security currency" status to the Pound that the purely resource-linked CAD lacks.
Industry Trends & High-Tech: The AI Scale War
Currency strength in 2025 is increasingly correlated with "Sovereign AI" capabilities. The UK is winning this metric.
* UK Dominance: As of late 2025, the UK ranks 3rd globally in AI ecosystem strength, boasting nearly double the number of funded AI startups compared to Canada (885 vs. 481).
* The Gap: While Canada has world-class research hubs like MILA, it struggles to commercialize at scale. The UK’s "Silicon Fens" and London fintech corridors are attracting significantly more private AI investment, acting as a magnet for foreign capital that supports the GBP.
Cyber & Technology: The Infrastructure Risk
A hidden driver of CAD weakness is the "Cyber Discount" applied to its energy sector.
* The Threat: 2025 has seen a disturbing spike in ransomware attacks targeting critical energy infrastructure. Canada’s vast pipeline network and industrial control systems are prime targets, creating operational risks that global investors are beginning to price in.
* UK Resilience: While London faces high attack volumes, its cyber-defence architecture (focused on financial services) is viewed as more mature and "battle-hardened" than the physical operational technology (OT) protecting Canadian resources.
Patents & Innovation: The "Grade D" Problem
Long-term currency value is driven by productivity, which is fueled by innovation.
* Canada’s Lag: Recent reports continue to grade Canada’s patent output as a "D," noting it punches below its weight in converting R&D into intellectual property.
* UK Leadership: In contrast, the UK maintains its status as an "Innovation Leader" (125% of the EU average), particularly in high-value sectors like Quantum Computing and Biotech. This intellectual property surplus creates a long-term "quality" bias for GBP over CAD.
Conclusion: The Structural Divergence
The GBP/CAD uptick is not a blip; it is a signal. The market is favouring the UK’s service-based, AI-integrated economy over Canada’s resource-dependent model, which is currently besieged by soft demand and cyber threats.
> Key Takeaway: The "Loonie" is no longer just an oil proxy; it is a tech laggard. Watch the UK’s AI investment flows if they accelerate, GBP/CAD has structural room to run.
Loonie

USDCAD plunges as BOC vs Fed divergence grows! Can it continue?USDCAD has broken sharply lower following Canada's surprise jobs blowout on Friday, with the pair now pricing in a divergence: the Bank of Canada is expected to hold rates Wednesday, while the Fed is expected to cut.
Canada added 54,000 jobs in November, and the unemployment rate plunged to 6.5%, taking a BOC cut off the table. Meanwhile, the Fed is 90% priced to cut by 25bps on Wednesday, narrowing the rate differential and weakening the US dollar against the loonie.
Key drivers
Canada jobs report beat expectations with +54k positions (vs expected loss), unemployment fell to 6.5% from 6.9% — three straight months of gains totalling 181k jobs.
BOC decision this week virtually certain to hold at 2.25% after cutting in October and signalling the easing cycle is likely over.
Fed FOMC decision on Wednesday priced in at 90% odds for a 25bps cut to 3.75–4%, the third consecutive cut driven by cooling US labour and dovish Fed commentary.
Technical: USDCAD corrected to 50% Fibonacci (1.4140–60) of the 1.4790–1.3543 impulse leg and is now breaking down in a potential head and shoulders pattern with neckline at 1.3543.
Downside targets: 1.3370–1.3396 (61.8% extension + 50% retracement confluence), 1.3068 (61.8% retracement), and 1.2895 (100% extension full measured move).
Risk scenario: Neckline hold above 1.3543 could see bounce back toward 1.36 or 1.43, but below 1.4140, the path of least resistance is lower.
Are you trading the USDCAD breakdown? Share your head and shoulders setups in the comments and follow for more central bank divergence and technical trade ideas.
This content is not directed to residents of the EU or UK. Any opinions, news, research, analyses, prices or other information contained on this website is provided as general market commentary and does not constitute investment advice. ThinkMarkets will not accept liability for any loss or damage including, without limitation, to any loss of profit which may arise directly or indirectly from use of or reliance on such information.

USD/CAD Outlook: The Bearish Reversal & BoC PivotThe currency markets are witnessing a decisive shift. After months of dominance, the US Dollar is faltering against the Canadian Dollar (Loonie), driving a sharp USD/CAD bearish reversal . Traders who previously bet on continued divergence are now scrambling to reprice their portfolios. This is not merely a technical correction; it is a fundamental realignment driven by surprising Canadian resilience and a cooling US rate trajectory.
Macroeconomics: The Great Divergence
The central narrative has flipped. For much of 2025, markets assumed the Bank of Canada (BoC) would cut rates aggressively while the Federal Reserve held firm. That assumption is dead.
* The BoC Pause: Traders now expect the BoC to have concluded its easing cycle at **2.25%**. With inflation sticky and growth rebounding, the "rate cut" trade is unwinding.
* The Fed Pivot: Conversely, swaps markets now price in **four 25-point cuts** from the Fed over the next year.
* The Impact: This narrowing yield spread reduces the incentive to hold USD, fueling downside momentum in USD/CAD.
Economics & Data Science: The Citi Surprise
Market sentiment is often driven by data deviations rather than absolute numbers. The Citi Economic Surprise Index quantifies this "shock factor."
* Canada (Red Line): At a reading of **30.7**, Canadian data is beating expectations at the highest rate since August.
* USA (Blue Line): While positive, US data is clouded by dated releases due to the recent government shutdown.
This divergence proves that Canada’s economy is outperforming consensus models, forcing algorithmic trading systems to buy CAD.
Geopolitics & Strategy: The Trade Tension Paradox
While macroeconomics drives the current reversal, geopolitics remains the "wild card." The BoC’s October guidance cited "trade tensions with the United States" as a key risk. However, the market’s reaction suggests investors believe these fears are priced in or overstated. The resilience of Canada's export sector, despite tariff rhetoric, demonstrates a geostrategic robustness that is supporting the Loonie. Traders are betting that the deep integration of North American supply chains will prevent a catastrophic breakdown.
Technical Analysis & High-Tech: The Bearish Engulfing
Algorithmic execution desks are reacting to a powerful signal on the weekly timeframe. The USD/CAD chart has printed a Bearish Engulfing Candle , a technical pattern where a week of gains is completely erased and overtaken by selling pressure.
* The Signal: This pattern, appearing after a prolonged uptrend, indicates buyer exhaustion.
* The Target: Quants and technical traders view this as a green light to initiate short positions, targeting lower support levels as we enter December.
Management & Leadership: The Governing Council
The psychology of central banking is shifting. The BoC’s Governing Council, led by Tiff Macklem, is pivoting from "defensive easing" to "data-dependent holding." Their guidance has moved from cautious to neutral. This leadership shift mirrors the Reserve Bank of New Zealand’s recent hawkish hold, which triggered a massive rally in its local currency. If the BoC confirms this stance on **December 10**, the USD/CAD sell-off could accelerate.
Conclusion: The December Catalyst
The USD/CAD pair stands at a precipice. The convergence of a hawkish BoC, a dovish Fed, and robust Canadian data has created a "perfect storm" for a bearish trend. The immediate focus turns to **Friday’s jobs report**; another strong print would hammer the final nail into the coffin of the 2025 USD bull run. For traders, the trend is clear: the path of least resistance is now lower.

CADJPY carry trade gains traction with iH&S, targets 118+The CADJPY carry trade is in focus as the yen stays weak and risk appetite lifts CAD toward a bigger breakout from an inverse head-and-shoulders base.
Japan’s new PM, Takaichi, leans pro‑stimulus, while the BOJ signals no December hike, leaving JPY structurally soft. At the same time, Canada benefits from improved risk tone and a stable BOC policy, which supports CAD strength.
Key drivers
Structural JPY weakness: A stimulus-first stance and low-rate BOJ keep carry demand elevated, but intervention talk remains a headline risk.
CAD tailwinds: US reopening-driven risk-on, oil support, and BOC on hold underpin the loonie.
Technicals: An inverse H&S with a neckline projection toward 116–117, with a recent retest near 108–109 holding the line and RSI having room to push higher.
Levels: supports at 110.00, then 109.50/108.30, and resistances at 111.50, 112.20, and 115.10, with the measured move pointing toward 116.5–118 from the neckline break.
Bias stays long above 110. Buy dips, invalidate below 108, and scale targets at 111.50, 112.20, and 115.10, leaving a runner at 116.5–118 if the first neckline peak holds.
This content is not directed to residents of the EU or UK. Any opinions, news, research, analyses, prices or other information contained on this website is provided as general market commentary and does not constitute investment advice. ThinkMarkets will not accept liability for any loss or damage including, without limitation, to any loss of profit which may arise directly or indirectly from use of or reliance on such information.

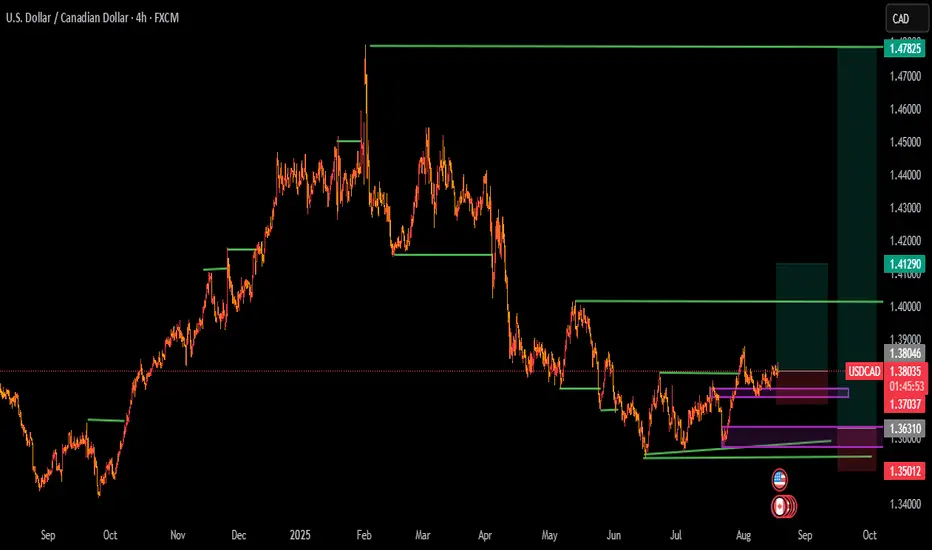
Why the US Dollar Dominates the Loonie?The USD/CAD pair trades near 1.4100, reflecting the US Dollar's (USD) persistent strength against the Canadian Dollar (CAD). This rally to seven-month highs stems from powerful structural and cyclical forces. We observe a widening monetary policy divergence and geopolitical uncertainty that favors the USD. Analyzing macroeconomics, fiscal policy, and trade reveals why the CAD struggles to sustain gains, despite positive Canadian data.
Geopolitics and Geostrategy: North American Trade Friction
Trade uncertainty directly pressures the CAD. Recent trade tensions with the US create significant CAD headwinds. Prime Minister Mark Carney apologized for an anti-tariff advertisement, but President Trump reportedly rejected resuming trade talks. This situation keeps bilateral trade risk elevated, undermining business confidence in Canada. US court proceedings over broad tariffs further inject political risk into the U.S.-Canada relationship, threatening key sectors like the auto industry.
The USD functions as the global reserve safe-haven anchor. Global investors gravitate toward USD assets during times of geopolitical friction. This geostrategic function offers the USD a structural advantage over the commodity-linked CAD, reinforcing the pair's upward momentum.
Macroeconomics: Diverging Rate Paths
The primary driver remains the widening interest rate differential. Strong US data bolsters the Federal Reserve's (Fed) hawkish stance. US ADP Employment climbed by 42,000 in October, reversing the prior decline. ISM Services PMI also rose to 52.4, exceeding forecasts. This resilience strengthens the USD.
The Fed maintains a cautious approach toward future rate cuts. CME FedWatch Tool data shows traders reduced the probability of a December Fed cut to 62% from 68%. Conversely, the Bank of Canada (BoC) has already cut its policy rate to 2.25%. Although the BoC signaled an easing cycle pause, markets focus on expected future divergence. This policy gap favors dollar-denominated assets, pushing the USD/CAD higher.
Economics and Fiscal Policy Headwinds
Canada's fiscal policy adds downward pressure on the CAD. The new Canadian budget projects the fiscal deficit will more than double this year. Deficit projections reach -2.5% of GDP for 2025/26 and -2.0% for 2026/27, representing material fiscal loosening. Markets interpret this spending as potentially inflationary without sufficient growth, weakening the CAD.
Furthermore, the CAD remains highly sensitive to crude oil prices. West Texas Intermediate (WTI) crude trades near $\$60.00$ per barrel, declining slightly. As a major oil exporter, softer energy prices negatively impact Canada's terms of trade and export revenue, directly pressuring the Loonie.
Technology and Patent Analysis: The Competitiveness Gap
Structural economic factors underpin the CAD weakness. Canada faces an ongoing competitiveness gap with the US, particularly in high-tech and innovation sectors. Persistent lower productivity growth in Canada compared to the US makes the Canadian economy less appealing for long-term capital investment.
The US economy demonstrates superior labor productivity growth and strong performance in advanced industries. This technology and innovation lag limits the CAD's potential for sustained appreciation. The US also benefits from acting as a "black hole" attraction for Canadian talent and intellectual property. This fundamental economic divergence provides structural support for the Greenback's long-term dominance.

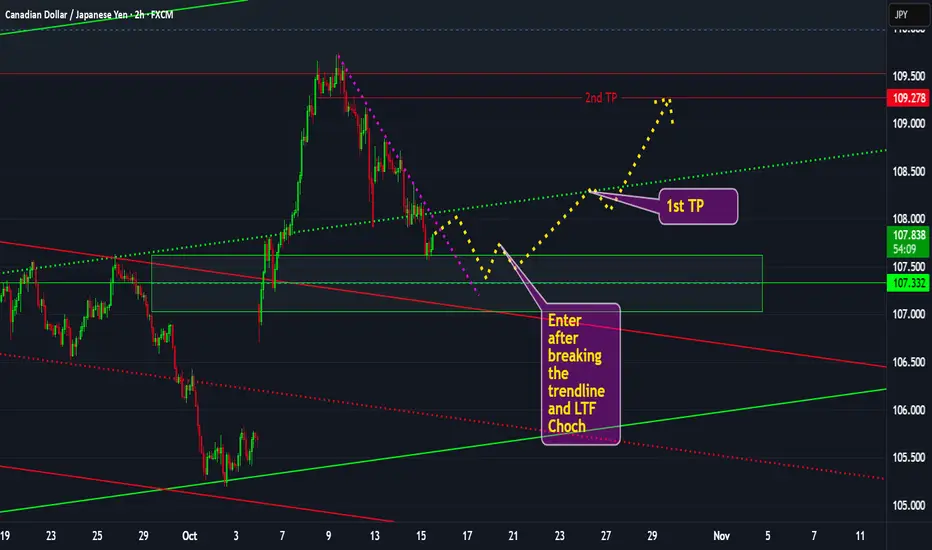
CADJPY: consider the SpreadHello traders,
I rarely trade low volume pairs, this analysis brought to you in request of a friend.
Take care and consider risk management.
Long-term trend is bearish
Mid-term is bullish
in the short term we are waiting for a break!
USD/CAD: Bearish Loonie SlideUSD/CAD: Bearish Loonie Slide Amid #Fed Cut Hype and #Forex Volatility Buzz? 1.39 Breakout Target in Sight?
USD/CAD is trading at 1.3795 today, up 0.17% amid a rebound from 1.3728 lows as markets eye the Fed's rate decision later, with 65% odds of a 50bps cut to 4.00-4.25% pressuring the dollar but offset by BoC's own easing signals.
This follows a 0.25% CAD gain earlier in the week on CPI data, but the pair remains range-bound with analysts forecasting a bearish tilt to 1.35 by year-end if Fed cuts deepen.
Just as #Fed surges with 15K mentions on X amid rate speculation, and #Forex trends spotlight policy divergence (e.g., BoC vs. Fed easing), USD/CAD's sensitivity to oil and CAD vulnerability position it for choppy action in the $1.8T daily forex market.
But with volatility at 3.88%, is USD/CAD undervalued for a bull run to 1.39, or will dovish Fed trigger a CAD rebound? Let's break down the fundamentals, SWOT, charts, and setups for September 18, 2025.
Fundamental Analysis
USD/CAD's trajectory hinges on diverging central bank paths, with the BoC's recent cuts weakening the loonie while Fed easing caps USD upside—yet oil prices above $70/bbl support CAD via Canada's export reliance.
Analysts project a 2025 average of 1.35, bearish on CAD amid #Fed cuts, but short-term resistance at 1.3800 could hold if US data softens. With #Forex volatility buzzing, the pair's undervaluation shines in a risk-on environment if Fed delivers 50bps, but sticky US inflation (2.6% core) risks a hawkish pivot.
- **Positive:**
- BoC easing and CAD vulnerability amid #Forex hype project USD strength to 1.3863 if Fed holds steady.
- Oil tailwinds and EM inflows (e.g., SA bonds) bolster CAD floors, undervaluing the pair at current levels vs. 1.40 peaks.
- Broader #Fed trends favor USD if dot plot signals fewer cuts, eyeing 0.5% monthly gains.
- **Negative:**
- Dovish Fed expectations weaken USD, clashing with #Fed optimism if 50bps cut confirms CAD rebound.
- Canada CPI resilience (2.0% YoY) could strengthen CAD if BoC pauses, pressuring the pair lower.
SWOT Analysis
**Strengths:** Policy divergence favors USD with Fed's relative hawkishness vs. BoC, amplified by #Fed relevance in dollar sentiment.
**Weaknesses:** High oil correlation exposes CAD upside; overbought momentum vulnerable in #Forex-shifting markets post-Fed.
**Opportunities:** Fed cut confirmation narrows spreads, with undervalued bull potential to 1.3891 amid #Fed boom.
**Threats:** Hawkish BoC surprises eroding gains; competition from AUD/CAD if commodity trends capitalize on #Forex volatility.
Technical Analysis
On the daily chart, USD/CAD rebounds in an ascending channel from 1.3728 support, with a pivot at 1.3800 mirroring #Fed volatility spikes. The weekly shows neutral bias with 1.3889 as key breakout. Current price: 1.3795, with VWAP at 1.3770 as intraday balance.
Key indicators:
- **RSI (14-day):** At 55, neutral—potential bull signal amid #Fed surge. 📈
- **MACD:** Histogram positive, crossover holding for upside.
- **Moving Averages:** Price above 21-day EMA (1.3750) but testing 50-day SMA (1.3820)—bullish if holds.
Support/Resistance: Support at 1.3728 (recent low), resistance at 1.3863 and 1.3891. Patterns/Momentum: Channel bounce targets 1.3863; fueled by #Forex momentum. 🟢 Bullish signals: Higher lows on volume. 🔴 Bearish risks: Failure at 1.3800 eyes 1.36.
Scenarios and Risk Management
- **Bullish Scenario:** Break above 1.3863 on hawkish Fed targets 1.3891; long on pullbacks to 1.3728, especially if #Fed signals fewer cuts.
- **Bearish Scenario:** Drop below 1.3728 eyes 1.3538; watch for CAD cross amid #Forex fade on dovish pivot.
- **Neutral/Goldilocks:** Range-bound 1.3728–1.3863 if dot plot mixed and #Fed cools.
Risk Tips: Use stops at 1.3700. Risk 1-2% per trade. Diversify to avoid correlation traps with #Fed-linked pairs like EUR/USD.
Conclusion/Outlook
Overall, a bullish bias if USD/CAD holds 1.3728, supercharged by today's #Fed and #Forex trends, with 0.7% upside to 1.39 on policy divergence. But watch the Fed outcome for confirmation—this fits September's rate volatility theme amid easing hype.
What’s your take? Bullish on USD/CAD amid #Fed cuts or fading the loonie? Share in the comments!

GBPCAD breakout or rejection? All eyes on 1.8850!GBPCAD is testing a major technical zone as macro and price catalysts align. Here's what traders need to know:
Catalysts & Macro Drivers
GBP : Supported by USD weakness (US shutdown, weak data), sticky UK inflation, and Bank of England caution. November’s UK budget looms as a key event.
CAD : Under pressure from falling oil prices (oversupply/weak demand) and a dovish Bank of Canada. Further rate cuts are possible, especially if oil stays low.
Technical Outlook
Weekly chart : Strong impulsive rally past 61.8% Fibonacci (1.8310), with 1.9490 (78.6% Fib) as the next longer-term upside target.
4h chart : Ascending triangle with resistance at 1.8850. Breakout/close above 1.8850 confirms bullish momentum, with targets at 1.90 and then 1.93–1.95.
RSI : Long-term RSI above 60 signals strength, but divergence is a risk factor. Watch for RSI reset or failure at highs.
Trading Scenarios
Bullish : Hold above 1.8850 for 3 sessions +, look for upside extension to 1.90/1.93/1.95.
Bearish : Failure to break 1.8850 or drop below 1.8600 could trigger reversal to 1.84/1.81 support.
Levels to Watch
Key resistance: 1.8850, 1.9000, 1.9340, 1.9490
Key support: 1.8600, 1.8400, 1.8310
This content is not directed to residents of the EU or UK. Any opinions, news, research, analyses, prices or other information contained on this website is provided as general market commentary and does not constitute investment advice. ThinkMarkets will not accept liability for any loss or damage including, without limitation, to any loss of profit which may arise directly or indirectly from use of or reliance on such information.

Any optimism for the Gopher or its all the time S&Ms?USDCAD just like many of the other main pairs seems to be commemcing a new trend, is the volume strong enough for the trend to start or everything is all Smoke and Mirrors?
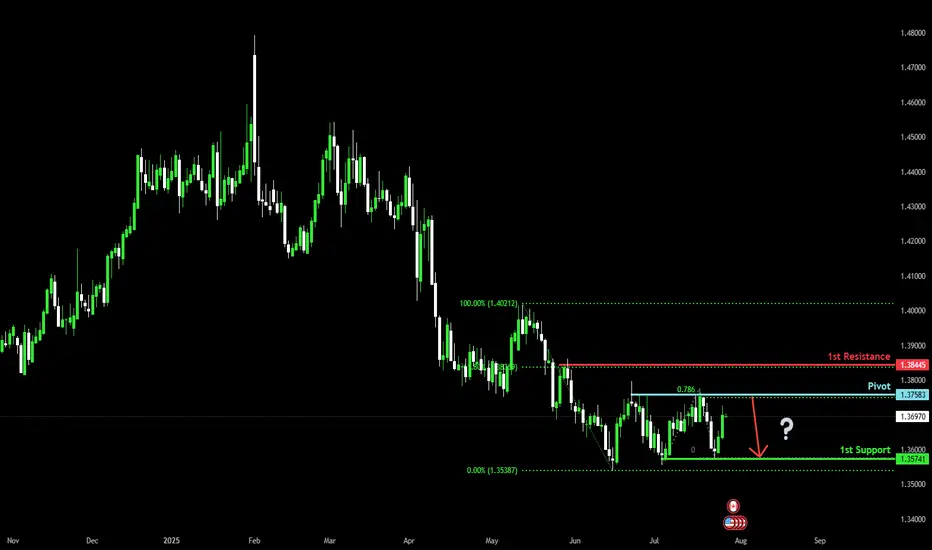
Heading into multi swing high resistance?The Loonie (USD/CAD) is rising towards the pivot and could reverse to the 1st support, which acts as a multi-swing high support.
Pivot: 1.3758
1st Support: 1.3574
1st Resistance: 1.3844
Risk Warning:
Trading Forex and CFDs carries a high level of risk to your capital and you should only trade with money you can afford to lose. Trading Forex and CFDs may not be suitable for all investors, so please ensure that you fully understand the risks involved and seek independent advice if necessary.
Disclaimer:
The above opinions given constitute general market commentary, and do not constitute the opinion or advice of IC Markets or any form of personal or investment advice.
Any opinions, news, research, analyses, prices, other information, or links to third-party sites contained on this website are provided on an "as-is" basis, are intended only to be informative, is not an advice nor a recommendation, nor research, or a record of our trading prices, or an offer of, or solicitation for a transaction in any financial instrument and thus should not be treated as such. The information provided does not involve any specific investment objectives, financial situation and needs of any specific person who may receive it. Please be aware, that past performance is not a reliable indicator of future performance and/or results. Past Performance or Forward-looking scenarios based upon the reasonable beliefs of the third-party provider are not a guarantee of future performance. Actual results may differ materially from those anticipated in forward-looking or past performance statements. IC Markets makes no representation or warranty and assumes no liability as to the accuracy or completeness of the information provided, nor any loss arising from any investment based on a recommendation, forecast or any information supplied by any third-party.
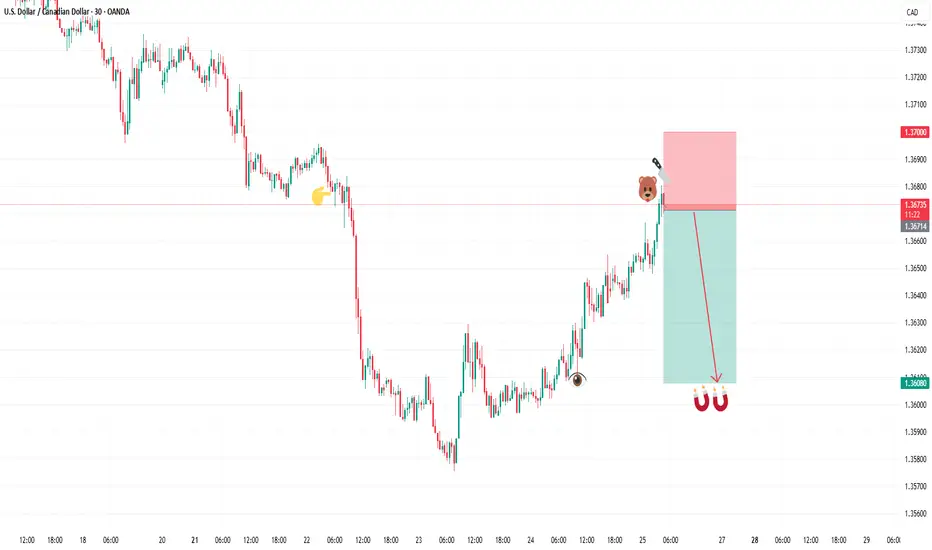
SELL USDCADIn todays session we are monitoring USDCAD for selling opportunities, we have our first entry at 1.36719 and our target is 1.36080 our stop is above 1.3700 , use proper risk management and risk what you can afford. Cheers fam.
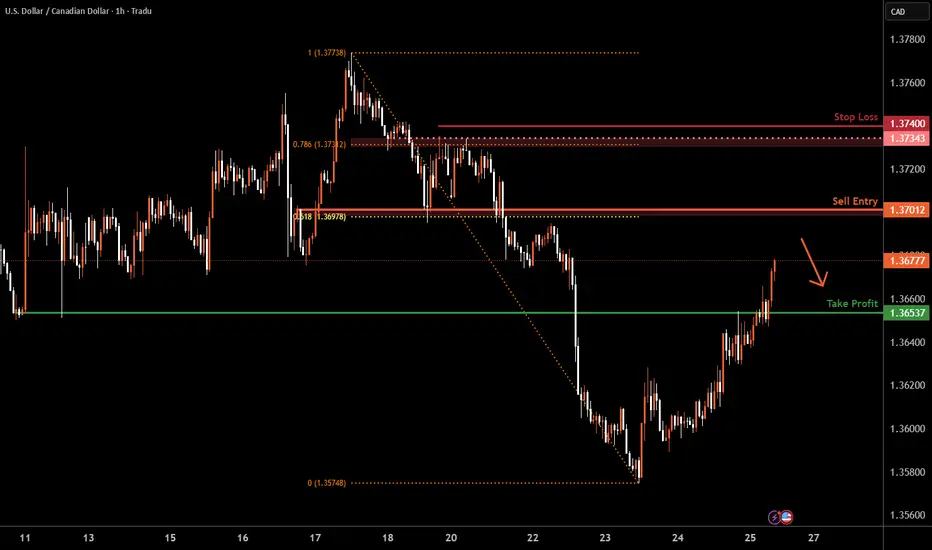
USD/CAD H4 | Potential bearish reversalUSD/CAD is rising towards an overlap resistance and could potentially reverse off this level to drop lower.
Sell entry is at 1.3701 which is an overlap resistance that aligns with the 61.8% Fibonacci retracement.
Stop loss is at 1.3740 which is a level that sits above the 78.6% Fibonacci retracement and an overlap resistance.
Take profit is at 1.3653 which is a pullback support.
High Risk Investment Warning
Trading Forex/CFDs on margin carries a high level of risk and may not be suitable for all investors. Leverage can work against you.
Stratos Markets Limited (tradu.com ):
CFDs are complex instruments and come with a high risk of losing money rapidly due to leverage. 66% of retail investor accounts lose money when trading CFDs with this provider. You should consider whether you understand how CFDs work and whether you can afford to take the high risk of losing your money.
Stratos Europe Ltd (tradu.com ):
CFDs are complex instruments and come with a high risk of losing money rapidly due to leverage. 66% of retail investor accounts lose money when trading CFDs with this provider. You should consider whether you understand how CFDs work and whether you can afford to take the high risk of losing your money.
Stratos Global LLC (tradu.com ):
Losses can exceed deposits.
Please be advised that the information presented on TradingView is provided to Tradu (‘Company’, ‘we’) by a third-party provider (‘TFA Global Pte Ltd’). Please be reminded that you are solely responsible for the trading decisions on your account. There is a very high degree of risk involved in trading. Any information and/or content is intended entirely for research, educational and informational purposes only and does not constitute investment or consultation advice or investment strategy. The information is not tailored to the investment needs of any specific person and therefore does not involve a consideration of any of the investment objectives, financial situation or needs of any viewer that may receive it. Kindly also note that past performance is not a reliable indicator of future results. Actual results may differ materially from those anticipated in forward-looking or past performance statements. We assume no liability as to the accuracy or completeness of any of the information and/or content provided herein and the Company cannot be held responsible for any omission, mistake nor for any loss or damage including without limitation to any loss of profit which may arise from reliance on any information supplied by TFA Global Pte Ltd.
The speaker(s) is neither an employee, agent nor representative of Tradu and is therefore acting independently. The opinions given are their own, constitute general market commentary, and do not constitute the opinion or advice of Tradu or any form of personal or investment advice. Tradu neither endorses nor guarantees offerings of third-party speakers, nor is Tradu responsible for the content, veracity or opinions of third-party speakers, presenters or participants.
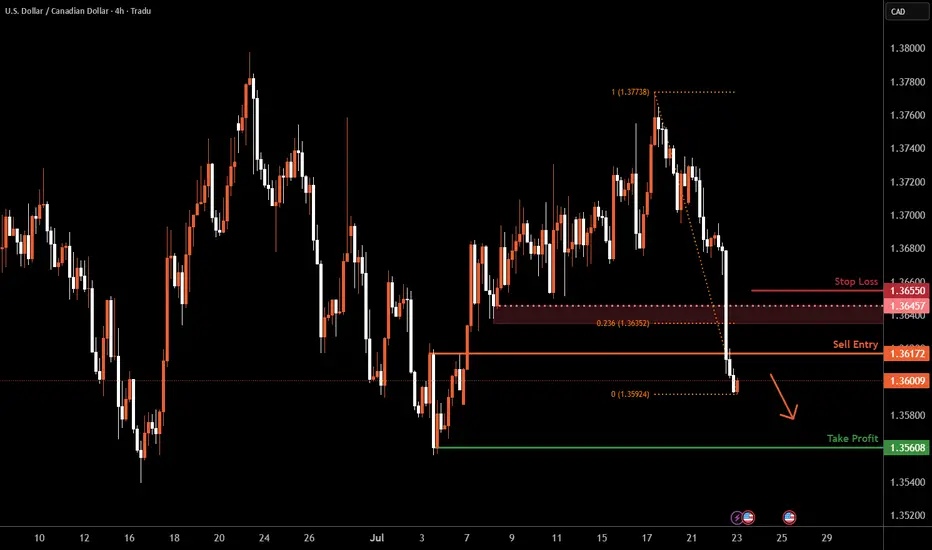
USD/CAD H4 | Potential bearish reversalUSD/CAD is rising towards a pullback resistance and could potentially reverse off this level to drop lower.
Sell entry is at 1.3617 which is a pullback resistance.
Stop loss is at 1.3655 which is a level that sits above the 23.6% Fibonacci retracement and a pullback resistance.
Take profit is at 1.3560 which is a swing-low support.
High Risk Investment Warning
Trading Forex/CFDs on margin carries a high level of risk and may not be suitable for all investors. Leverage can work against you.
Stratos Markets Limited (tradu.com ):
CFDs are complex instruments and come with a high risk of losing money rapidly due to leverage. 66% of retail investor accounts lose money when trading CFDs with this provider. You should consider whether you understand how CFDs work and whether you can afford to take the high risk of losing your money.
Stratos Europe Ltd (tradu.com ):
CFDs are complex instruments and come with a high risk of losing money rapidly due to leverage. 66% of retail investor accounts lose money when trading CFDs with this provider. You should consider whether you understand how CFDs work and whether you can afford to take the high risk of losing your money.
Stratos Global LLC (tradu.com ):
Losses can exceed deposits.
Please be advised that the information presented on TradingView is provided to Tradu (‘Company’, ‘we’) by a third-party provider (‘TFA Global Pte Ltd’). Please be reminded that you are solely responsible for the trading decisions on your account. There is a very high degree of risk involved in trading. Any information and/or content is intended entirely for research, educational and informational purposes only and does not constitute investment or consultation advice or investment strategy. The information is not tailored to the investment needs of any specific person and therefore does not involve a consideration of any of the investment objectives, financial situation or needs of any viewer that may receive it. Kindly also note that past performance is not a reliable indicator of future results. Actual results may differ materially from those anticipated in forward-looking or past performance statements. We assume no liability as to the accuracy or completeness of any of the information and/or content provided herein and the Company cannot be held responsible for any omission, mistake nor for any loss or damage including without limitation to any loss of profit which may arise from reliance on any information supplied by TFA Global Pte Ltd.
The speaker(s) is neither an employee, agent nor representative of Tradu and is therefore acting independently. The opinions given are their own, constitute general market commentary, and do not constitute the opinion or advice of Tradu or any form of personal or investment advice. Tradu neither endorses nor guarantees offerings of third-party speakers, nor is Tradu responsible for the content, veracity or opinions of third-party speakers, presenters or participants.
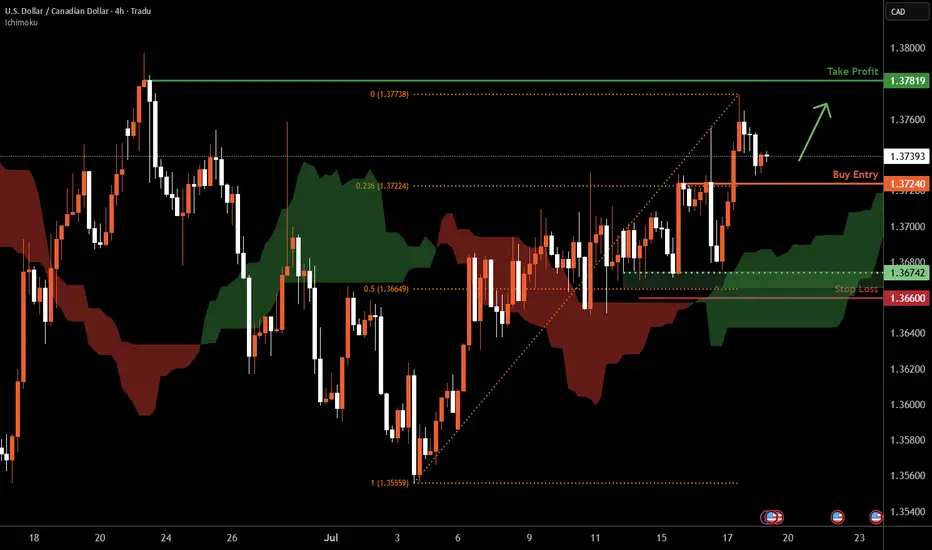
USD/CAD H4 | Potential bullish bounceUSD/CAD is falling towards a pullback support and could potentially bounce off this level to climb higher.
Buy entry is at 1.3724 which is a pullback support that aligns with the 23.6% Fibonacci retracement.
Stop loss is at 1.3660 which is a level that lies underneath a multi-swing-low support and the 50% Fibonacci retracement.
Take profit is at 1.3781 which is a swing-high resistance.
High Risk Investment Warning
Trading Forex/CFDs on margin carries a high level of risk and may not be suitable for all investors. Leverage can work against you.
Stratos Markets Limited (tradu.com ):
CFDs are complex instruments and come with a high risk of losing money rapidly due to leverage. 66% of retail investor accounts lose money when trading CFDs with this provider. You should consider whether you understand how CFDs work and whether you can afford to take the high risk of losing your money.
Stratos Europe Ltd (tradu.com ):
CFDs are complex instruments and come with a high risk of losing money rapidly due to leverage. 66% of retail investor accounts lose money when trading CFDs with this provider. You should consider whether you understand how CFDs work and whether you can afford to take the high risk of losing your money.
Stratos Global LLC (tradu.com ):
Losses can exceed deposits.
Please be advised that the information presented on TradingView is provided to Tradu (‘Company’, ‘we’) by a third-party provider (‘TFA Global Pte Ltd’). Please be reminded that you are solely responsible for the trading decisions on your account. There is a very high degree of risk involved in trading. Any information and/or content is intended entirely for research, educational and informational purposes only and does not constitute investment or consultation advice or investment strategy. The information is not tailored to the investment needs of any specific person and therefore does not involve a consideration of any of the investment objectives, financial situation or needs of any viewer that may receive it. Kindly also note that past performance is not a reliable indicator of future results. Actual results may differ materially from those anticipated in forward-looking or past performance statements. We assume no liability as to the accuracy or completeness of any of the information and/or content provided herein and the Company cannot be held responsible for any omission, mistake nor for any loss or damage including without limitation to any loss of profit which may arise from reliance on any information supplied by TFA Global Pte Ltd.
The speaker(s) is neither an employee, agent nor representative of Tradu and is therefore acting independently. The opinions given are their own, constitute general market commentary, and do not constitute the opinion or advice of Tradu or any form of personal or investment advice. Tradu neither endorses nor guarantees offerings of third-party speakers, nor is Tradu responsible for the content, veracity or opinions of third-party speakers, presenters or participants.
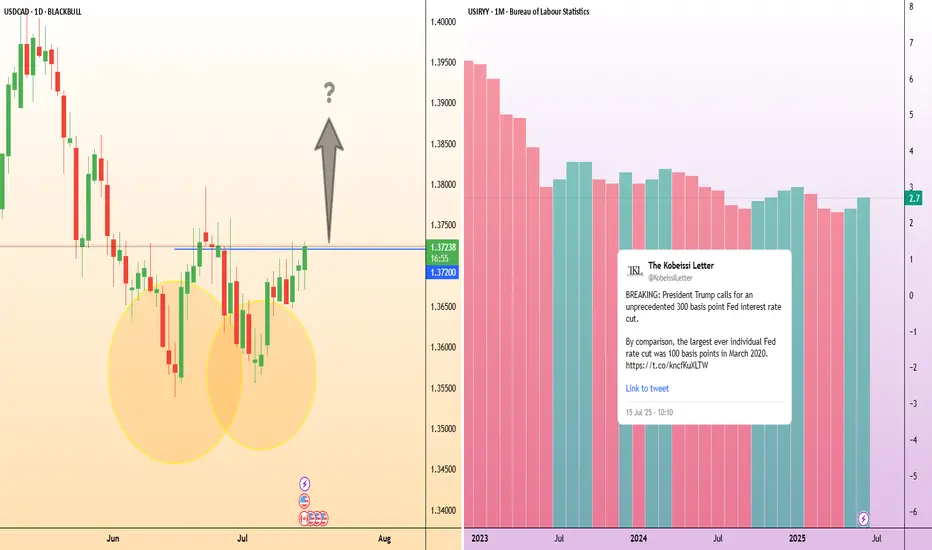
USD/CAD: Inflation gaps create opportunityIn the U.S., inflation accelerated for a second straight month, with headline CPI reaching 2.7% year-on-year in June as President Trump’s tariffs begin to push up the cost of a range of goods.
Increasing inflation could likely heighten the Federal Reserve’s reluctance to cut its interest rate, in defiance of Trump’s public demand. This could provide upward momentum for USD/CAD if expectations for rate cuts are delayed.
USD/CAD is showing signs of a potential trend reversal after finding strong support around 1.3600 in late June. Price action has since formed a series of higher lows, and the recent breakout attempt above 1.3720 suggests bullish momentum could be building.
Canada’s inflation rate, released at the same time as the US’s, edged up to 1.9%, staying below the Bank of Canada’s 2% target for a third consecutive month. With the BoC already signalling easing bias, this divergence in inflation paths may limit CAD strength.
Potential bearish drop?The Loonie (USD/CAD) has rejected off the pivot, which has been identified as an overlap resistance and could drop to the 61.8% Fibonacci support.
Pivot: 1.3688
1st Support: 1.3599
1st Resistance: 1.3743
Risk Warning:
Trading Forex and CFDs carries a high level of risk to your capital and you should only trade with money you can afford to lose. Trading Forex and CFDs may not be suitable for all investors, so please ensure that you fully understand the risks involved and seek independent advice if necessary.
Disclaimer:
The above opinions given constitute general market commentary, and do not constitute the opinion or advice of IC Markets or any form of personal or investment advice.
Any opinions, news, research, analyses, prices, other information, or links to third-party sites contained on this website are provided on an "as-is" basis, are intended only to be informative, is not an advice nor a recommendation, nor research, or a record of our trading prices, or an offer of, or solicitation for a transaction in any financial instrument and thus should not be treated as such. The information provided does not involve any specific investment objectives, financial situation and needs of any specific person who may receive it. Please be aware, that past performance is not a reliable indicator of future performance and/or results. Past Performance or Forward-looking scenarios based upon the reasonable beliefs of the third-party provider are not a guarantee of future performance. Actual results may differ materially from those anticipated in forward-looking or past performance statements. IC Markets makes no representation or warranty and assumes no liability as to the accuracy or completeness of the information provided, nor any loss arising from any investment based on a recommendation, forecast or any information supplied by any third-party.

USD/CAD H4 | Potential bearish breakoutUSD/CAD is falling towards a potential breakout level and could drop lower from here.
Sell entry is at 1.3601 which is a potential breakout level.
Stop loss is at 1.3662 which is a level that sits above an overlap resistance.
Take profit is at 1.3539 which is a swing-low support that aligns closely with a 161.8% Fibonacci extension.
High Risk Investment Warning
Trading Forex/CFDs on margin carries a high level of risk and may not be suitable for all investors. Leverage can work against you.
Stratos Markets Limited (tradu.com ):
CFDs are complex instruments and come with a high risk of losing money rapidly due to leverage. 63% of retail investor accounts lose money when trading CFDs with this provider. You should consider whether you understand how CFDs work and whether you can afford to take the high risk of losing your money.
Stratos Europe Ltd (tradu.com ):
CFDs are complex instruments and come with a high risk of losing money rapidly due to leverage. 63% of retail investor accounts lose money when trading CFDs with this provider. You should consider whether you understand how CFDs work and whether you can afford to take the high risk of losing your money.
Stratos Global LLC (tradu.com ):
Losses can exceed deposits.
Please be advised that the information presented on TradingView is provided to Tradu (‘Company’, ‘we’) by a third-party provider (‘TFA Global Pte Ltd’). Please be reminded that you are solely responsible for the trading decisions on your account. There is a very high degree of risk involved in trading. Any information and/or content is intended entirely for research, educational and informational purposes only and does not constitute investment or consultation advice or investment strategy. The information is not tailored to the investment needs of any specific person and therefore does not involve a consideration of any of the investment objectives, financial situation or needs of any viewer that may receive it. Kindly also note that past performance is not a reliable indicator of future results. Actual results may differ materially from those anticipated in forward-looking or past performance statements. We assume no liability as to the accuracy or completeness of any of the information and/or content provided herein and the Company cannot be held responsible for any omission, mistake nor for any loss or damage including without limitation to any loss of profit which may arise from reliance on any information supplied by TFA Global Pte Ltd.
The speaker(s) is neither an employee, agent nor representative of Tradu and is therefore acting independently. The opinions given are their own, constitute general market commentary, and do not constitute the opinion or advice of Tradu or any form of personal or investment advice. Tradu neither endorses nor guarantees offerings of third-party speakers, nor is Tradu responsible for the content, veracity or opinions of third-party speakers, presenters or participants.

USD/CAD H4 | Falling toward a pullback supportUSD/CAD is falling towards a pullback support and could potentially bounce off this level to climb higher.
Buy entry is at 1.3675 which is a pullback support that aligns closely with the 50% Fibonacci retracement.
Stop loss is at 1.3623 which is a level that lies underneath a swing-low support and the 61.8% Fibonacci retracement.
Take profit is at 1.3781 which is a swing-high resistance.
High Risk Investment Warning
Trading Forex/CFDs on margin carries a high level of risk and may not be suitable for all investors. Leverage can work against you.
Stratos Markets Limited (tradu.com ):
CFDs are complex instruments and come with a high risk of losing money rapidly due to leverage. 63% of retail investor accounts lose money when trading CFDs with this provider. You should consider whether you understand how CFDs work and whether you can afford to take the high risk of losing your money.
Stratos Europe Ltd (tradu.com ):
CFDs are complex instruments and come with a high risk of losing money rapidly due to leverage. 63% of retail investor accounts lose money when trading CFDs with this provider. You should consider whether you understand how CFDs work and whether you can afford to take the high risk of losing your money.
Stratos Global LLC (tradu.com ):
Losses can exceed deposits.
Please be advised that the information presented on TradingView is provided to Tradu (‘Company’, ‘we’) by a third-party provider (‘TFA Global Pte Ltd’). Please be reminded that you are solely responsible for the trading decisions on your account. There is a very high degree of risk involved in trading. Any information and/or content is intended entirely for research, educational and informational purposes only and does not constitute investment or consultation advice or investment strategy. The information is not tailored to the investment needs of any specific person and therefore does not involve a consideration of any of the investment objectives, financial situation or needs of any viewer that may receive it. Kindly also note that past performance is not a reliable indicator of future results. Actual results may differ materially from those anticipated in forward-looking or past performance statements. We assume no liability as to the accuracy or completeness of any of the information and/or content provided herein and the Company cannot be held responsible for any omission, mistake nor for any loss or damage including without limitation to any loss of profit which may arise from reliance on any information supplied by TFA Global Pte Ltd.
The speaker(s) is neither an employee, agent nor representative of Tradu and is therefore acting independently. The opinions given are their own, constitute general market commentary, and do not constitute the opinion or advice of Tradu or any form of personal or investment advice. Tradu neither endorses nor guarantees offerings of third-party speakers, nor is Tradu responsible for the content, veracity or opinions of third-party speakers, presenters or participants.

USD/CAD H1 | Overlap support at 38.2% Fibonacci retracementUSD/CAD is falling towards an overlap support and could potentially bounce off this level to climb higher.
Buy entry is at 1.3686 which is an overlap support that aligns closely with the 38.2% Fibonacci retracement.
Stop loss is at 1.3623 which is a level that lies underneath an overlap support and the 61.8% Fibonacci retracement.
Take profit is at 1.3773 which is a swing-high resistance.
High Risk Investment Warning
Trading Forex/CFDs on margin carries a high level of risk and may not be suitable for all investors. Leverage can work against you.
Stratos Markets Limited (tradu.com ):
CFDs are complex instruments and come with a high risk of losing money rapidly due to leverage. 63% of retail investor accounts lose money when trading CFDs with this provider. You should consider whether you understand how CFDs work and whether you can afford to take the high risk of losing your money.
Stratos Europe Ltd (tradu.com ):
CFDs are complex instruments and come with a high risk of losing money rapidly due to leverage. 63% of retail investor accounts lose money when trading CFDs with this provider. You should consider whether you understand how CFDs work and whether you can afford to take the high risk of losing your money.
Stratos Global LLC (tradu.com ):
Losses can exceed deposits.
Please be advised that the information presented on TradingView is provided to Tradu (‘Company’, ‘we’) by a third-party provider (‘TFA Global Pte Ltd’). Please be reminded that you are solely responsible for the trading decisions on your account. There is a very high degree of risk involved in trading. Any information and/or content is intended entirely for research, educational and informational purposes only and does not constitute investment or consultation advice or investment strategy. The information is not tailored to the investment needs of any specific person and therefore does not involve a consideration of any of the investment objectives, financial situation or needs of any viewer that may receive it. Kindly also note that past performance is not a reliable indicator of future results. Actual results may differ materially from those anticipated in forward-looking or past performance statements. We assume no liability as to the accuracy or completeness of any of the information and/or content provided herein and the Company cannot be held responsible for any omission, mistake nor for any loss or damage including without limitation to any loss of profit which may arise from reliance on any information supplied by TFA Global Pte Ltd.
The speaker(s) is neither an employee, agent nor representative of Tradu and is therefore acting independently. The opinions given are their own, constitute general market commentary, and do not constitute the opinion or advice of Tradu or any form of personal or investment advice. Tradu neither endorses nor guarantees offerings of third-party speakers, nor is Tradu responsible for the content, veracity or opinions of third-party speakers, presenters or participants.

USD/CAD H1 | Potential bounce off an overlap supportUSD/CAD is falling towards an overlap support and could potentially bounce off this level to climb higher.
Buy entry is at 1.3686 which is an overlap support that aligns with the 50% Fibonacci retracement.
Stop loss is at 1.3633 which is a level that lies underneath anoverlap support and the 50% Fibonacci retracement.
Take profit is at 1.3738 which is a swing-high resistance.
High Risk Investment Warning
Trading Forex/CFDs on margin carries a high level of risk and may not be suitable for all investors. Leverage can work against you.
Stratos Markets Limited (tradu.com ):
CFDs are complex instruments and come with a high risk of losing money rapidly due to leverage. 63% of retail investor accounts lose money when trading CFDs with this provider. You should consider whether you understand how CFDs work and whether you can afford to take the high risk of losing your money.
Stratos Europe Ltd (tradu.com ):
CFDs are complex instruments and come with a high risk of losing money rapidly due to leverage. 63% of retail investor accounts lose money when trading CFDs with this provider. You should consider whether you understand how CFDs work and whether you can afford to take the high risk of losing your money.
Stratos Global LLC (tradu.com ):
Losses can exceed deposits.
Please be advised that the information presented on TradingView is provided to Tradu (‘Company’, ‘we’) by a third-party provider (‘TFA Global Pte Ltd’). Please be reminded that you are solely responsible for the trading decisions on your account. There is a very high degree of risk involved in trading. Any information and/or content is intended entirely for research, educational and informational purposes only and does not constitute investment or consultation advice or investment strategy. The information is not tailored to the investment needs of any specific person and therefore does not involve a consideration of any of the investment objectives, financial situation or needs of any viewer that may receive it. Kindly also note that past performance is not a reliable indicator of future results. Actual results may differ materially from those anticipated in forward-looking or past performance statements. We assume no liability as to the accuracy or completeness of any of the information and/or content provided herein and the Company cannot be held responsible for any omission, mistake nor for any loss or damage including without limitation to any loss of profit which may arise from reliance on any information supplied by TFA Global Pte Ltd.
The speaker(s) is neither an employee, agent nor representative of Tradu and is therefore acting independently. The opinions given are their own, constitute general market commentary, and do not constitute the opinion or advice of Tradu or any form of personal or investment advice. Tradu neither endorses nor guarantees offerings of third-party speakers, nor is Tradu responsible for the content, veracity or opinions of third-party speakers, presenters or participants.

USD/CAD H1 | Bearish downtrend to extend deeper?USD/CAD is rising towards a pullback resistance and could potentially reverse off this level to drop lower.
Sell entry is at 1.3615 which is a pullback resistance.
Stop loss is at 1.3660 which is a level that sits above the 50% Fibonacci retracement and an overlap resistance.
Take profit is at 1.3565 which is a swing-low support.
High Risk Investment Warning
Trading Forex/CFDs on margin carries a high level of risk and may not be suitable for all investors. Leverage can work against you.
Stratos Markets Limited (tradu.com ):
CFDs are complex instruments and come with a high risk of losing money rapidly due to leverage. 63% of retail investor accounts lose money when trading CFDs with this provider. You should consider whether you understand how CFDs work and whether you can afford to take the high risk of losing your money.
Stratos Europe Ltd (tradu.com ):
CFDs are complex instruments and come with a high risk of losing money rapidly due to leverage. 63% of retail investor accounts lose money when trading CFDs with this provider. You should consider whether you understand how CFDs work and whether you can afford to take the high risk of losing your money.
Stratos Global LLC (tradu.com ):
Losses can exceed deposits.
Please be advised that the information presented on TradingView is provided to Tradu (‘Company’, ‘we’) by a third-party provider (‘TFA Global Pte Ltd’). Please be reminded that you are solely responsible for the trading decisions on your account. There is a very high degree of risk involved in trading. Any information and/or content is intended entirely for research, educational and informational purposes only and does not constitute investment or consultation advice or investment strategy. The information is not tailored to the investment needs of any specific person and therefore does not involve a consideration of any of the investment objectives, financial situation or needs of any viewer that may receive it. Kindly also note that past performance is not a reliable indicator of future results. Actual results may differ materially from those anticipated in forward-looking or past performance statements. We assume no liability as to the accuracy or completeness of any of the information and/or content provided herein and the Company cannot be held responsible for any omission, mistake nor for any loss or damage including without limitation to any loss of profit which may arise from reliance on any information supplied by TFA Global Pte Ltd.
The speaker(s) is neither an employee, agent nor representative of Tradu and is therefore acting independently. The opinions given are their own, constitute general market commentary, and do not constitute the opinion or advice of Tradu or any form of personal or investment advice. Tradu neither endorses nor guarantees offerings of third-party speakers, nor is Tradu responsible for the content, veracity or opinions of third-party speakers, presenters or participants.

USDCAD weekly overviewHello Traders,
War in Persian Gulf could change the direction of this analysis. Any conflict in the Middle ease could make out two white zones be red and suitable for shot trades. in normal situation, only 1.37732 is prepared for long trades.
***********************************************************
The indicated levels are determined based on the most reaction points and the assumption of approximately equal distance between the zones.
Some of these points can also be confirmed by the mathematical intervals of Murray.
You can enter with/without confirmation. IF you want to take confirmation you can use LTF analysis, Spike move confirmation, Trend Strength confirmation and ETC.
SL could be placed below the zone or regarding the LTF swings.
TP is the next zone or the nearest moving S&R, which are median and borders of the drawn channels.
*******************************************************************
Role of different zones:
GREEN: Just long trades allowed on them.
RED: Just Short trades allowed on them.
BLUE: both long and short trades allowed on them.
WHITE: No trades allowed on them! just use them as TP points

USD/CAD H1 | Overlap resistance at 38.2% Fibonacci retracementUSD/CAD is rising towards an overlap resistance and could potentially reverse off this level to drop lower.
Sell entry is at 1.3756 which is an overlap resistance that aligns close to the 38.2% Fibonacci retracement.
Stop loss is at 1.3807 which is a level that sits above the 61.8% Fibonacci retracement and an overlap resistance.
Take profit is at 1.3689 which is a swing-low support.
High Risk Investment Warning
Trading Forex/CFDs on margin carries a high level of risk and may not be suitable for all investors. Leverage can work against you.
Stratos Markets Limited (tradu.com ):
CFDs are complex instruments and come with a high risk of losing money rapidly due to leverage. 63% of retail investor accounts lose money when trading CFDs with this provider. You should consider whether you understand how CFDs work and whether you can afford to take the high risk of losing your money.
Stratos Europe Ltd (tradu.com ):
CFDs are complex instruments and come with a high risk of losing money rapidly due to leverage. 63% of retail investor accounts lose money when trading CFDs with this provider. You should consider whether you understand how CFDs work and whether you can afford to take the high risk of losing your money.
Stratos Global LLC (tradu.com ):
Losses can exceed deposits.
Please be advised that the information presented on TradingView is provided to Tradu (‘Company’, ‘we’) by a third-party provider (‘TFA Global Pte Ltd’). Please be reminded that you are solely responsible for the trading decisions on your account. There is a very high degree of risk involved in trading. Any information and/or content is intended entirely for research, educational and informational purposes only and does not constitute investment or consultation advice or investment strategy. The information is not tailored to the investment needs of any specific person and therefore does not involve a consideration of any of the investment objectives, financial situation or needs of any viewer that may receive it. Kindly also note that past performance is not a reliable indicator of future results. Actual results may differ materially from those anticipated in forward-looking or past performance statements. We assume no liability as to the accuracy or completeness of any of the information and/or content provided herein and the Company cannot be held responsible for any omission, mistake nor for any loss or damage including without limitation to any loss of profit which may arise from reliance on any information supplied by TFA Global Pte Ltd.
The speaker(s) is neither an employee, agent nor representative of Tradu and is therefore acting independently. The opinions given are their own, constitute general market commentary, and do not constitute the opinion or advice of Tradu or any form of personal or investment advice. Tradu neither endorses nor guarantees offerings of third-party speakers, nor is Tradu responsible for the content, veracity or opinions of third-party speakers, presenters or participants.
