AUDJPY getting bearish !well here we have a great point . to take a sell entry as i have given the sell limit and the target is around 80 pips .
Loss

Two loss today trading GBPUSD 1H London session- RealtyThe Reality of Trading..
Welcome to the last trading day of the week. Still testing the new methodology of trading An hour everyday. Its a intriguing experience so far & I'm enjoying it. We tool two loss today while trading our method and its part of the game.
Result so far!
1st week- -5r
2nd week- -2r
-4r

What not to do on OPEX daysNot a great day to trade. Perfect example of what not to do on boring slow OPEX days especially after a huge gap down. Should have avoided it or only take A+ set up trades. Got burned and ended up revenge trading in the power hour to gain some losses back, but still ended up red on the day. Anyway, HAPPY MEXICAN INDEPENDENCE DAY!!!

EURGBP Forecast: Will the price rally? EURO POUND NEWS AND ANALYSIS
Recent developments in the UK are pushing the price up. The ECB Press conference might say otherwise at 14:45.
Price is forming a bullish head and shoulder pattern on the monthly that's accompanied by a double bottom on the weekly time frame.
Fundamental Outlook
The pound has been rallying up lately. Market seems to be reacting to the appointment of the new UK's prime minister - Liz Truss, as a leader of the ruling conservative party. The campaign that was ran by Truss had a significant impact because it promised to support households through this time of soaring inflation with tax breaks cited as one of the mechanisms of easing the current cost of living crisis. In addition, Truss plans to assist in the region of 40 billion pounds to business with rising energy costs. Therefore, the promises of relief to households and businesses is likely to support the pound in the short-run.
Monthly Technical Outlook
As you can see, the current price is fully forming the head and shoulder pattern, bullish break and retesting the the 50 and 21 moving average to currently trying to do the same on the Monthly Half a Bat Neckline. If the price does that and continues to rally to break and retest the Monthly H&S Neckline together with bullish crossed short-term moving averages, that will signal an upcoming 3 level uptrend. But if the price bounces off the Monthly H&S Neckline with a bearish reversal pattern that leads the price to bearish break and retest the 50 and 8 moving average, that will signal an upcoming drop. With that said, we're looking at an either or situation.
Weekly Technical Outlook
In the weekly chart image, we have the price currently bullish running in the double bottoms 1st level. The pattern expects the 2nd and 3rd levels to be formed. That will happen if the price continues to bullish break and retest the monthly key levels that are in line with the weekly ones (as you can see). If the price bounces off the Monthly H&S Neckline, that will signal a rejection of both the monthly and weekly signal, which will likely drop the price for the monthly's bearish trend.
That's it for today. I hope you found value in this trade idea. If you have a different concept in mind, feel free to share in the comments section, I'd love to know your thoughts!
Stay Blessed,
Sphatrades.

Testing weekly resistance. Can try short with 2-3x leverageTitle, theres weekly support here. Because of volatile coin price, i recommend low leverage short position with 44$ stop-loss.

GBPUSD - Win, Lose, Breakeven? Hey everyone, so looks like another GBPUSD, to be honest, this trade took me by surprise but check out how the position played out to see why.

USDJPY pattern break well here we have a good point to take a sell trade for 100 pips around to downward .

BTCUSD Aug W.4: Long-term trend alert!Hi friends, I hope the week is unfolding for y'all as planned ;)
Today, we've got another possible long-term trade signal. These trades signals are only derived from this timeframe (Weekly). The monthly doesn't fully support them, and that makes the trades highly risky. I feel like the price won't drop to the last target. I think it will reverse on the 3rd Weekly Key Lvl to form the monthly's double top accumulation phase that will either retest the Monthly Neckline 2, ascending trend line, together with the 50 and bearish crossed short-term moving averages to fully confirm the bearish signal or break the key levels to trigger a bullish long-term trend signal. This is what I'm talking about:
Furthermore, as you can see on the chart, the price might continue to drop to the Monthly Support after bearish breaking and retesting the 2nd Monthly Key Lvl. That will half confirm the weekly's signals. Speaking about the weekly, let us take a look at how the bulls and bears might behave in triggering our trades and disconfirming them before or during the trade.
Bulls: -If the price bullish breaks and retests the Mini Weekly Neckline and 8 moving average, that will be our first dis-confirmation. It will likely lead the price to rally for the 2nd Weekly Key Lvl and 21 moving average for our 2nd disconfirmation. We will exploit that trend because it will be the monthly's counter-trend signal that will be anticipating the Monthly Neckline 2, ascending trend line, together with the 50 and bearish crossed short-term moving averages that expect retests.
Bears: -If the price bullish spikes or retests the Mini Weekly Neckline and the 8 moving average with a bearish candle formation or close (1st trade signal) that leads the price to bearish break and retest the 1st Monthly Key Lvl either on the current or lower time frame (2nd trade signal), that will fully confirm our trades and I call or grade these type of trades a "H&S C-E.1 signal".
That's it for today. I hope you found value in this trade idea. If you have a different concept in mind, feel free to share it in the comments section or in private, I'd love to know your thoughts!
Stay Blessed,
Sphatrades.

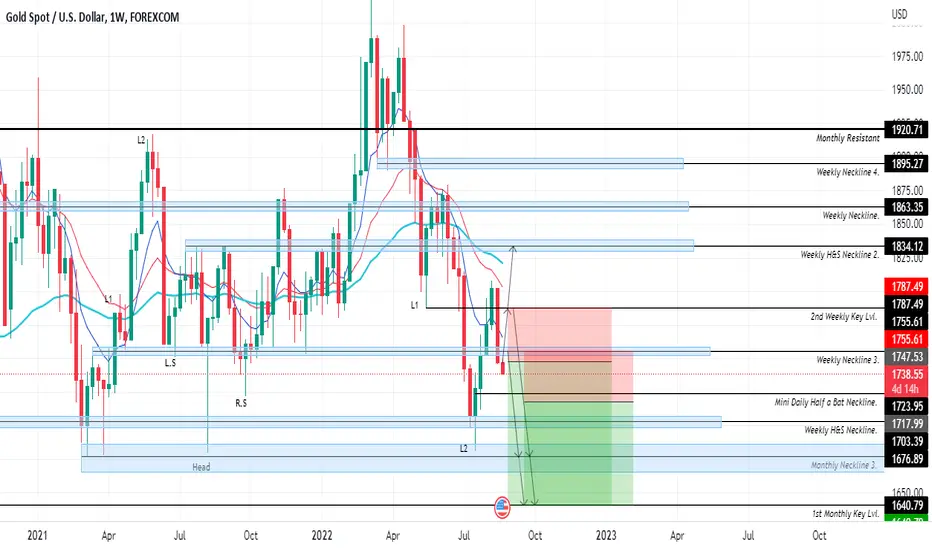
GOLD Aug W.4: Long-term trend alert!Hi friends, I hope y'all had a fantastic weekend, and are ready to tackle this week strong ;)
Today, we're looking at a possible long-term drop on this baby. These trades are derived from both the weekly and monthly. Starting with the monthly, the price is in the huge double tops 2nd leg formation that is bouncing off the bullish crossed short-term moving averages with a bearish shooting start candle pattern, triggering what I call a "Double Top A-E.1 signal".
The weekly, on the other hand, is currently bearish running in the double tops L2 and below the 50 moving average and bearish crossed short-term moving averages (8 and 21), triggering what I call a "Double Top A-E.1 signal", but it hasn't fully confirmed. Let us take a look at how this signal and its trades will trigger, and how it won't fully confirm our bias.
Bulls: -If the price bullish rallies to break and retest the 2nd Weekly Key Lvl and 8 m.a, that will dis-confirm both the weekly and monthly signals, and the price would be in prep to form a bullish reversal pattern that will be followed by a bullish trend.
Bears: -If the price bullish spikes or retests the Weekly Neckline 3 or 2nd Weekly Key Lvl and 8 m.a with a bearish candle pattern or reversal candle pattern formation/close (1st trade signal) that leads the price to bearish break and retest the Mini Daily Half a Bat Neckline (2nd trade signal), that will confirm our bias and the price will drop for this timeframes double top L3 and the monthly's double top accumulation phase.
That's it for today. I hope you found value in this trade idea. If you have a different concept in mind, feel free to share it in the comments section, I'd love to know you thoughts!
Stay Blessed.
XAUUSD ! are you sure ? suggestion allows here we have a crucial point if the gold sustain above this support then we'll go for buy entry
and if not sustain and fall down then we'll take sell entry after retracement

EURGBP Aug W.2: Long-term trend alert!Hi friends, I hope y'all having a profitable week ;)
Today, we're looking at a possible long-term trend that has a potential to reward us with +8%. These trade signals are derived from both the monthly and weekly. The monthly price is currently running in the bearish half a bats L1 that has last months price closed with a bearish reversal candle pattern that was followed by the current candle that is retesting the 3rd weekly key level and bearish crossed short-term m.a's to fully confirm the patterns 2 level trend. The weekly, on the other hand, has formed a bearish H&S pattern (that confirms the monthly's previous bearish reversal candle close) that has its price running in its accumulation phase above the neckline after it bounced off the 50 and bearish crossed short-term m.a's, signaling an upcoming 3 level trend. So, the monthly and weekly confirm each other for the drop, however, things can go south, meaning, the drop might not occur. With that said, let us see how the price will prove us right and wrong.
Bulls: -If the price bearish bounces off the Weekly H&S Neckline with a bullish reversal candle pattern that leads it to bullish rally to break and retest the 3rd Weekly Key Lvl/Weekly Neckline 3 together with the 50 and bullish crossed short-term m.a's, the price would've formed a bullish reversal pattern (probably a double bottom) that will dis-confirm our trades (proving use wrong).
Bears: -If the price bearish breaks and retest the Weekly H&S Neckline (1st trade signal) then continues to drop to break and retest the 4th Weekly Key Lvl (2nd trade signal), that will trigger what I call an "H&S A-E.3 signal" that fully confirms our trades anticipated 3 level trend (proving us right).
That's it for today. I hope you found value in this trade idea. If you have a different concept in mind, feel free to share it in the comments section, I'd love to know your thoughts!
Stay Blessed,
Spha Thwala.

UJI'm looking at this trade and I'm hysterical because I told myself that it's going to come back so move you SL. I said this before closing my laptop, but I guess it was louder in my head then the actual action of doing it.🤣🤣🤣🤣, it's one of those that are not bad because my plan accommodated the possibility of the loss.

EURUSD get bullish here we have a good point with perfect retracement and we take a buy entry and wait for our tp which is around 60 pips

GBPJPY Is it BEARISH OR BULLISH ?well here we have some conditions and if they work according to us then we'll take an entry

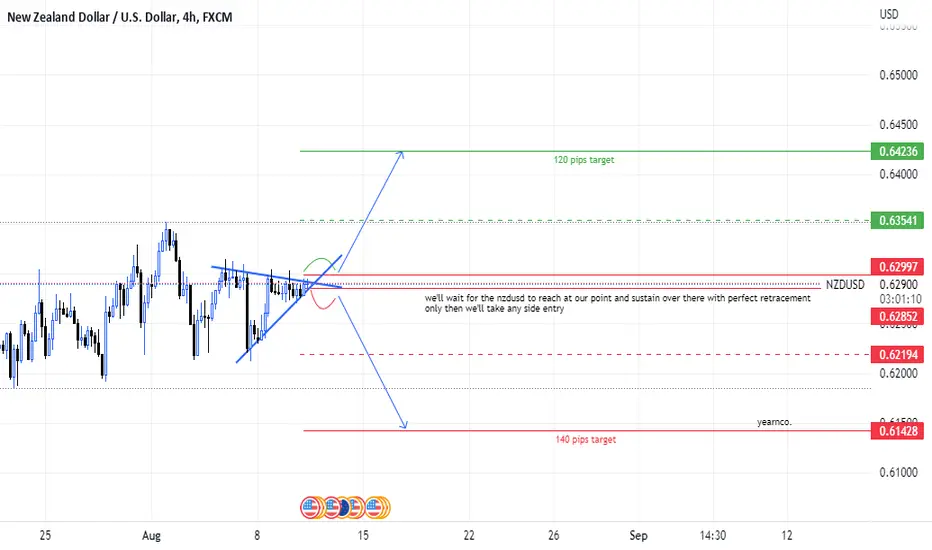
NZDUSD pattern ?well here we have a good pattern where we can easily take 120 to 140 pips on each side and all we need to wait and let the retracement happen after that we can take easy good pips by making entry
XRPUSD Aug W.2: Long-term trend alert!Hi friends, I hope y'all having a profitable week ;)
Today, we're looking at a possible long-term bearish drop. This trade idea is derived from this time frame only. The monthly is in a process of fully confirming it with a bearish reversal candle pattern formation. Having one time frame confirming a long-term signal, gives me an A- signal; if both the monthly and weekly confirmed the signal, that gives me an A+ signal. In this situation, the weekly is the only time frame. And that makes this trade idea a high risk one. With that said, let us take a look at how this trade triggered and how it will be dis-confirmed.
Bulls: -If the price bullish breaks and retests the Mini Weekly Neckline 2 and 8 m.a, that will dis-confirm the trade but it will trigger a medium-term buy signal that will lead to a rally to the monthly bullish key level targets that were previously bearish broken and not retested during the huge crash. I posted the trade idea of that signal last week when the price broke and closed in between the short-term m.a's (they play a huge role in confirming a signal).
Bears: -The price bounced off the Mini Weekly Neckline 2 with a bearish reversal candle pattern that led to a bearish break and retest of the 8 m.a, and that triggered the sell trade that will probably lead to a drop for the double tops L3. I call this type of trade signal a "Double Top C-E.1 signal".
That's it for today. I hope you found value in this trade idea. If you have a different concept in mind, feel free to share it in the comments section or in private, I'd love to know your thoughts!
Stay Blessed,
Doji-2k1.

EURCAD new ideas Here we have a good point for the breakout from the rectangle and once it goes the whatever direction we'll take that trade because it can simply make 40 pips in next momentum

CADJPY should be fall well it's good point from cadjpy can fall 200 pips down from here all we need to wait and take a entry at our point when it sustain below the line

EURGBP Aug 2022 W.2: Short-term trend!Hi friends, I hope y'all are having an amazing weekend ;)
Today, we're looking at a possible short-term trade signal. This trade is derived from the weekly where the price recently closed with a bullish reversal candle pattern in the H&S accumulation phase that aims to retest the 50 and bearish crossed short-term m.a's so that it will fully confirm the long-term bias of both the weekly and monthly. However, this counter-trend signal might be rejected, by having the price dramatically drop in direction of the overall trend. With that said, let us take a look at how the bulls and bears might behave in triggering our trade and dis-confirming it.
Bulls: -If the price bearish bounces off the Daily Half a Bat Neckline and 8 m.a with a bullish reversal candle pattern, that will trigger out trade or confirm our bias. I call this type of trade signal a "Double Bottom B-E.1".
Bears: -If the price forms a bearish reversal pattern that leads it to bearish break and retest the Daily Half a Bat Neckline together with the 50 and bearish crossed short-term m.a's, that will dis-confirm our trade or bias. The price would be preparing for the long-term trend I mentioned earlier on.
That's it for today. I hope you found value in this trade idea. If you have a different concept in mind, feel free to share it in the comments section or in private, I'd love to know your thoughts!
Stay Blessed,
Spha Thwala.

How to open positions (workflow)?In the picture you can see my pyramiding staggered stop strategy.
Low at comments for a link where you can read more about this!

EURCAD new possibility EURCAD has good chances with the price action so for now as you can see there are chances of fall but if the fundamental hit the technical and price get sustained above the buy zone then we can take a buy trade

Don't be liquidityThis chart shows the common stop-loss touch and bounce pattern. And this happened because I was liquidity.
The stop-loss was set at an "obvious" invalidation level, the previous supply level ($20,800). So, right below it, there was heavy bidding.
The stop-loss hunters will place their bids just slightly below presumed ask levels.

GBPJPY July W.3: Long-term trend signalHi friends, I hope y'all are having a profitable week ;)
Today, we have a long-term buy trade on this baby. This trade is derived from the monthly time frame that has a huge bullish head and shoulder pattern that has its current price running in the L1 (small consolidation) and above the 200 m.a and short-term m.a's that are bullish crossed and retested. Having the price closed with bullish reversal candle and current forming a bullish candle, signals that the price wants to continue the patterns trend to/for its L2 and L3 together for the key levels that were previously broken and not retested. So that's just the preface of the monthly's current market condition, now let us take a look at this time frame to find out how the bulls and bears might behave in triggering or dis-confirming our trades.
Bulls: If the price bullish breaks and run above (but retest on the 4 hour) the 6th Daily Key Lvl (1st trade signal), and proceeds to bullish break and retest the 5th Weekly Key Lvl (2nd trade signal), according to the weekly: the price will be in prep to rally for the double bottoms L1, L3, and L3 together for all the m.a's trend; and according to the monthly: the price would be in a bullish candle formation in and above the H&S L1 - in prep to rally for the patterns L2 and L3 together for the short-term m.a's trend, once that happens, then we should BUY!...(E.1 & E.2)
Bears: -If the price decides to bearish break and close below the Daily Half a Bat Neckline 4 and 21 m.a (red), that will dis-confirm both trades.
This is not financial advise, but if you would like to hop on these trades with me, there they are:
BUY E.1@: 165.576
Lot Size: 0.05
S.L @: 161.851 (-0.92%)
T.P 5@: 192.502 (+7.53%)
R/R/R: 1:8
BUY E.2 @: 168.833
Lot Size: 0.04
S.L @: 164.651 (-0.91%)
T.P 4@: 192.502 (+5.22%)
R/R/R: 1:6
That's it for today. I hope you found value in this trade idea. If you have a different concept in mind, feel free to share it in the comments section or in private, I'd love to know you thoughts!
Stay Blessed,
Doji.2k1
