LTCUSD (Litecoin) Cryptocurrency | Symmetrical TrianglesSee trend line formed at EMA 20 Close Price 156.67. Intersection of levels are good confluence factors.
Watch for bullish price action where levels intersect. See chart below where Trend Line, EMA 10, and EMA 20 intersects. A bullish engulfing candle formed.
Target Price is 162.18.
LTC-USD


💡Don't miss the great buy opportunity in LTCUSDTrading suggestion:
". There is a possibility of temporary retracement to the suggested support line (185.9).
. if so, traders can set orders based on Price Action and expect to reach short-term targets."
Technical analysis:
. LTCUSD is in a range bound, and the beginning of an uptrend is expected.
. The price is above the 21-Day WEMA, which acts as a dynamic support.
. The RSI is at 60.
Take Profits:
TP1= @ 195.5
TP2= @ 207.5
TP3= @ 219.7
TP4= @ 232.1
TP5= @ 248.1
SL= Break below S2
❤️ If you find this helpful and want more FREE forecasts in TradingView
. . . . . Please show your support back,
. . . . . . . . Hit the 👍 LIKE button,
. . . . . . . . . . Drop some feedback below in the comment!
❤️ Your support is very much 🙏 appreciated!❤️
💎 Want us to help you become a better Forex / Crypto trader?
Now, It's your turn!
Be sure to leave a comment; let us know how you see this opportunity and forecast.
Trade well, ❤️
ForecastCity English Support Team ❤️

💡Don't miss the great buy opportunity in LTCUSD Trading suggestion:
". There is a possibility of temporary retracement to the suggested support line (185.9).
. if so, traders can set orders based on Price Action and expect to reach short-term targets."
Technical analysis:
. LTCUSD is in a range bound, and the beginning of an uptrend is expected.
. The price is above the 21-Day WEMA, which acts as a dynamic support.
. The RSI is at 60.
Take Profits:
TP1= @ 195.5
TP2= @ 207.5
TP3= @ 219.7
TP4= @ 232.1
TP5= @ 248.1
SL= Break below S2
❤️ If you find this helpful and want more FREE forecasts in TradingView
. . . . . Please show your support back,
. . . . . . . . Hit the 👍 LIKE button,
. . . . . . . . . . Drop some feedback below in the comment!
❤️ Your support is very much 🙏 appreciated! ❤️
💎 Want us to help you become a better Forex / Crypto trader ?
Now, It's your turn !
Be sure to leave a comment; let us know how you see this opportunity and forecast.
Trade well, ❤️
ForecastCity English Support Team ❤️

LTC Long IdeaLooking for a bounce off the .5 fib or the .618 level, which is roughly around the next local support. I will be looking to catch in on the way back up to our resistance area. Should be a pretty easy 30% gain.

Potential LTC Swing Trade OpportunityThe price action has had two rejections at the 165 support area. We are in a third descending channel, headed for this strong support. If it holds and rejects, I will be buying on the way up, with a sell target between 185-190.
But really, this is crypto, so who knows. Waiting on daddy BTC to call the shot.
Trade safely.
This is not financial advice. This is for my reference and record as a hobby trader.

LTC could jump in price soonLTC approaching channel support, possible opportunity for long position.

LTC Breakout of Descending ChannelThis is just a chart idea I made before the fan broke out. I decided to publish after the breakout came. Lite coin had a bearish and bullish case, which is shown with red and green arrows. The Bullish case has played out. Short term target is in the low 170s. This will be my first potential short area depending on the price action.
This is not financial advice. This is for my record and reference as a hobby trader.


LTC/USD 1DLitecoin daily chart we have possible symmetrical triangle. Sym. triangles can be trusted with 5 or less contact points, so we have 3 at the bottom and 2 at resistance. A breakout through resistance confirms sym. triangle and open objective to $240 or daily pivot. PS. First confirmation of breakout can also be the break of descending dashed line. Breakdown of support invalidates this idea.

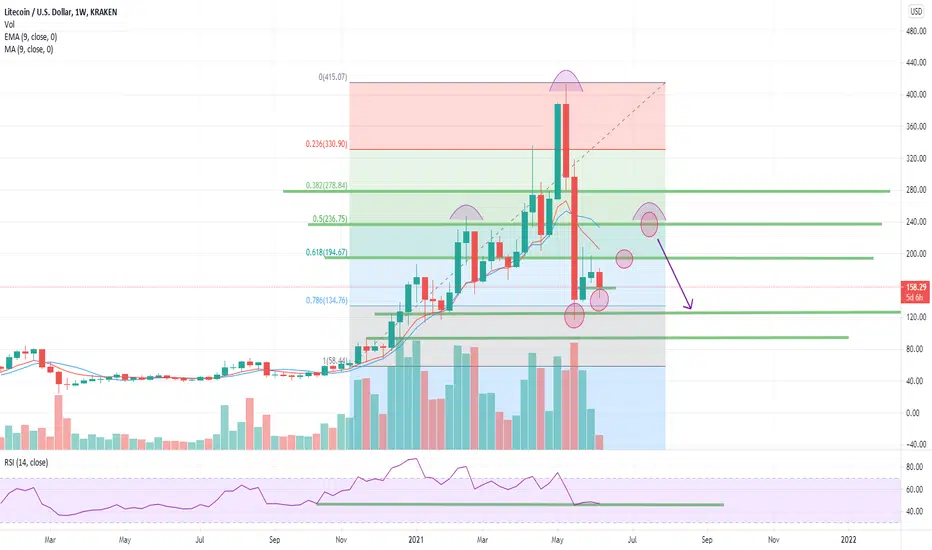
LTC Weekly Chart IdeaWe continued to the downside, contrary to what I was expecting. So now we are looking at the weekly chart.
This is just another iteration of my previous ideas. This time, you can see the levels of resistance and support align with the fib levels. This retracement has gone deep into the gains of the last impulse. The Chart shows a potential for continued higher lows. The rsi is at 47 at time of post. If the shoulder is completed, I see a potential short opportunity coming.
This is not financial advice. This is for my reference and record as a hobby trader.
Related ideas linked.
LTC HS and IHS patterns forming togetherLooks like a mini IHS could play into the larger HS shape forming.
This is just a chart idea.
This is not financial advise. This is for my reference and record as a hobby trader.


ltc ideasharing this cause its interesting that the rsi and price action is holding at the neckline of this larger shape in play.

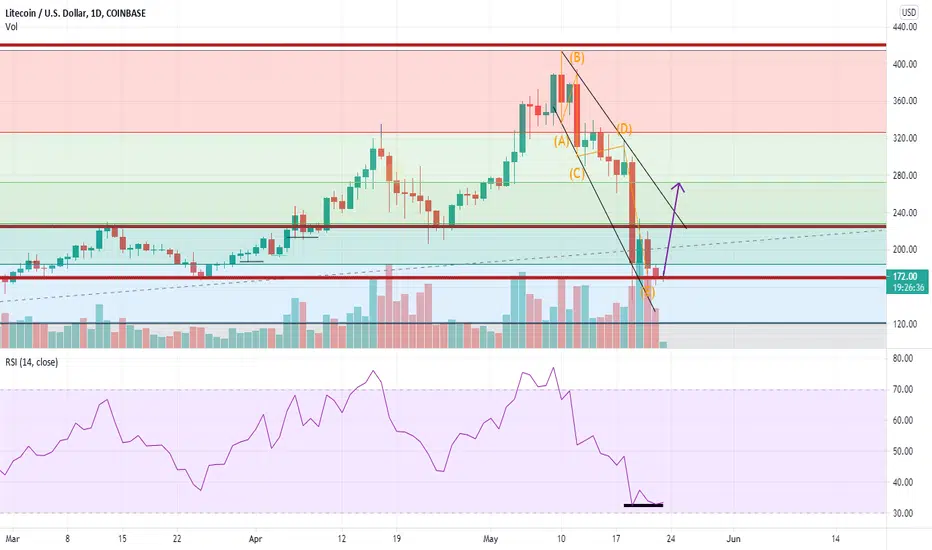
Elliot triangle Correction Idea LTC-USDHere is my first example of this concept put to practice. The final leg of these 5 points coincides with a large area of support. I hate to say bottom is in, but I am optimistic. The rsi is well neutral in all timeframes. Is the correction done, or will there be more blood? only time will tell!
This is not financial advice. This is for my reference and record as a hobby trader. This is for entertainment purposes only.
Dont be shy to comment!
LTC/USD Swing BullishThe Analysis has been done over daily and hourly Chart. Market is respecting Zone-1. Relatively sellers volume and rsi decreasing. Lets watch market towards resistance.
All the best!!

LTCUSDT - MORE BLOOD 🩸Price is moving within the descending correction leading up to the area of interest we marked out last week! Keep a close eye on this one!


LTC correction fibs and levels to watchIn this chart, im going with the 30 minute time frame to show the breakdown of the market.
The price action went bearish after the 330 peak.
The price started breaking down slowly at first, until a swift fall through the .236 fib.
The price ended up bottoming out right around the .618 fib, just shy of 239 at a key area of support.
Key levels in this breakdown:
271
251
232
This was the buy settup I was waiting for.
New Long Position opened with ATH on the horizon.
LTC is trading strong against BTC in the LTCBTC Pairing.
Man what a night!
This is not advice, this is for my record and reference as a hobby trader.
I have very little experience and knowledge. Know this.
Dont be shy to critique.


LTC USD (LITECOIN - US DOLLAR)Hi there.
Price is forming a continuation pattern to the upside.
Wait for the price to complete the pattern and watch strong price action for buy.

LTC USD diamond pattern in the make?Possible diamond pattern in the make. Let's see hw this plays out...
