Moon City Incoming! $250! NEXT!Price action has been very bullish over the past few days and if this 4HR demand holds (Red box), $250 can be next!
Calculate Your Risk/Reward so you don't lose more than 1% of your account per trade.
Every day the charts provide new information. You have to adjust or get REKT.
Love it or hate it, hit that thumbs up and share your thoughts below!
This is not financial advice. This is for educational purposes only.
Lululemon

LULU Bullish Reversal Alert, +43% Upside Potential on the Table?Hey Realistic Traders!
With the Fed cutting rates, investors rotated out of overpriced AI stocks and into value names. Lululemon stands out after a sharp sell-off compressed valuations to historically attractive levels, and we now turn to technical analysis to see whether price action confirms the bullish case.
Technical Analysis
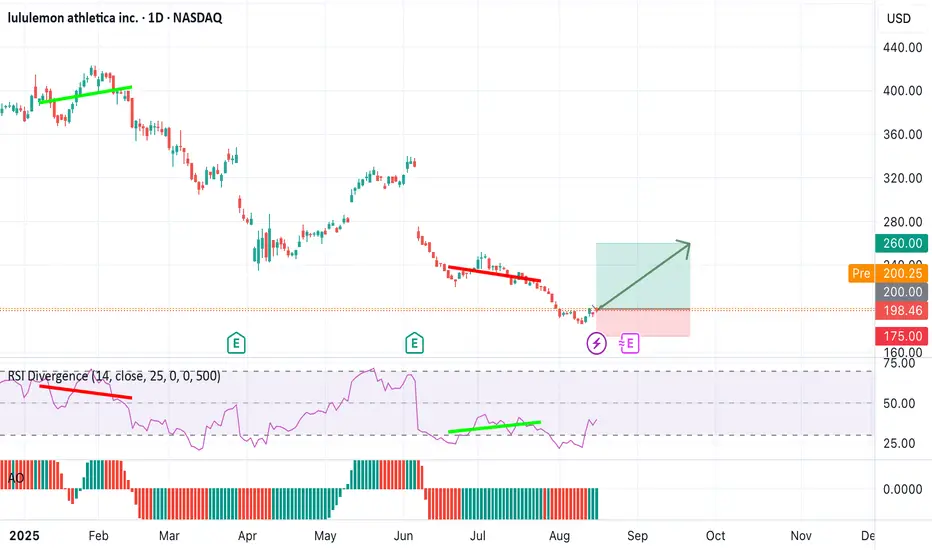
On the daily chart, NASDAQ:LULU has been trading consistently below the EMA200, reflecting a broader bearish trend. However, a breakout from a wide symmetrical triangle has emerged, signaling a potential bullish reversal.
The breakout was accompanied by a spike in trading volume, while a bullish MACD crossover added confirmation to the bullish bias. Based on this combination of signals, we anticipate a move toward the first target at 221.87, followed by a potential minor pullback before advancing toward the second target at 274.00.
This bullish outlook remains valid as long as price stays above 160.90. A move below this level would invalidate the setup and shift the outlook back to neutral.
Support the channel by engaging with the content, using the rocket button, and sharing your opinions in the comments below.
Disclaimer: "Please note that this analysis is solely for educational purposes and should not be considered a recommendation to take a long or short position on Lululemon."

LULU 1D - stretching into a comebackOn the daily chart of Lululemon Athletica (LULU), a clean AB=CD pattern is forming, signaling a potential end to the correction and the beginning of a new upward wave. The price has tested the strong buy zone between 164–167, aligned with a major daily support level and rising volume - a classic setup indicating that buyers are regaining control.
Technically , the structure is highly symmetrical, RSI shows a bullish divergence, and the 50-day moving average is starting to turn upward - all suggesting a possible trend reversal. The first upside target for this pattern is $230, followed by a second target at $340, which corresponds to the 1.272 and 1.618 Fibonacci extensions.
From a fundamental standpoint, Lululemon remains a powerhouse in the premium activewear market, maintaining strong brand loyalty even amid competition from Nike and Alo. The company continues to expand its men’s line and footwear segment, which now accounts for over 25% of total revenue. International growth remains robust, with new stores opening in South Korea, the UAE, and Germany. Lululemon’s shift toward higher-margin online sales and more efficient logistics continues to strengthen its profitability.
In the latest quarterly report (September 2025), revenue grew by 9% year-over-year, and EPS came in above Wall Street expectations. High customer retention - over 90% repeat purchase rate - and stable gross margins create a solid foundation for a mid-term recovery in the stock.
Tactical plan: watch for entries within the 164–167 buy zone, consider partial profit-taking near $230, and target $340 if momentum extends. Just like in yoga, patience and balance lead to the best results.

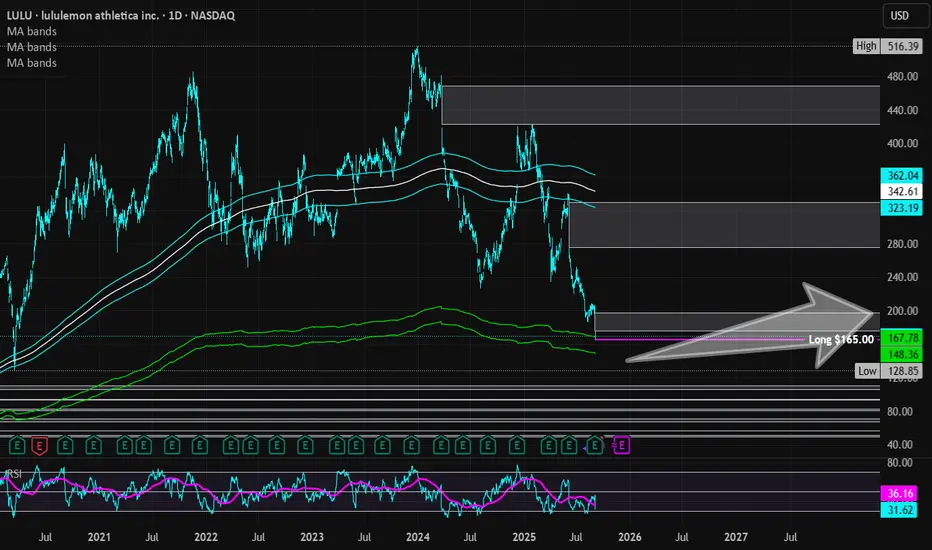
Lululemon Athletica | LULU | Long at $165.00Lululemon $NASDAQ:LULU. If you don't think the US is in a recession, examine most retail stocks right now. But this doesn't mean doom and gloom are here from a US government/news narrative - in fact, the complete opposite. AI and tech are solely propping up the US stock market ... but pay no attention to the issues behind the curtain! Once interest rates start dropping, trading and investing are going to get wild before the cracks open up.
Okay, off my soap box...
NASDAQ:LULU entered by "crash" simple moving average zone (green lines) today after earnings. Competition is finally catching up to the company, but expansion into China and other foreign areas *may* revive them in the next 1-2 years. While most analysts are relatively bullish, I'll stay centered. I wouldn't be surprised if the stock dips into the $140's and $150's in the near-term. Bigger news will have to come out for me to stay long-term, but I'm holding here or even lower. Additional entries will be made in the $140's-$150's to swap out the position I just made at $165.00 for the future.
Thus, at $165.00, NASDAQ:LULU is in a personal buy zone with the risk of a continued drop to the $140's and $150s. Christmas rally potential...
Targets into 2028:
$185.00 (+12.1%)
$197.00 (+19.4%)
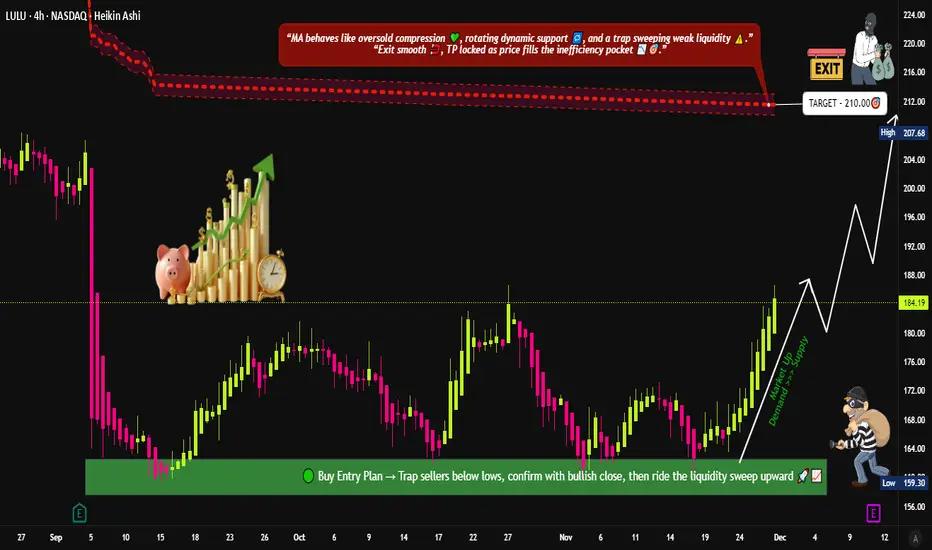
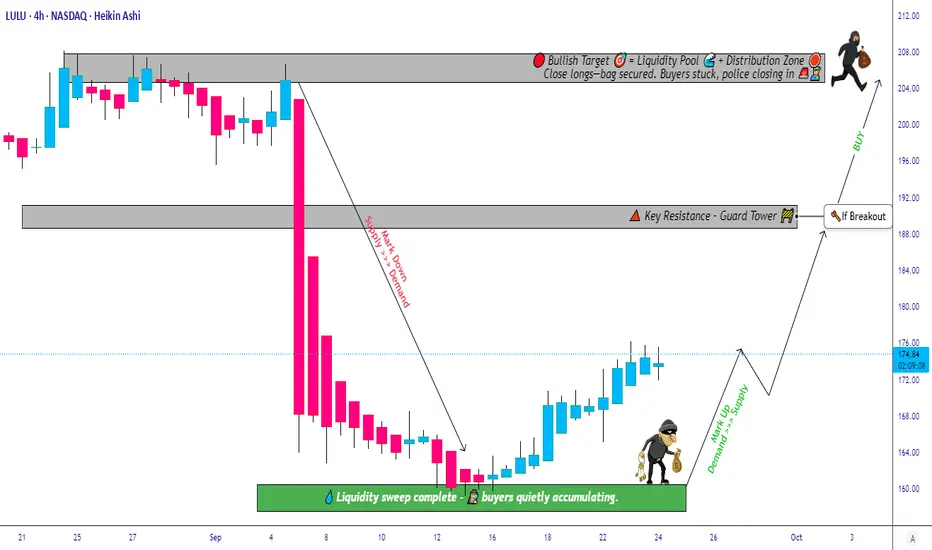
LULU Market Structure Update: Bullish Scenario and Trade Plan📈 LULU Bullish “Layered Thief Strategy” Playbook — Swing Trade Setup 😎🛍️
🧵 Asset:
LULU — Lululemon Athletica Inc. (NASDAQ)
🎯 Trade Plan:
Bias: Bullish 📈💪
This setup focuses on a multi-layered limit order structure (“Thief Strategy”) to optimize entries during pullbacks and liquidity dips — fully aligned with TradingView’s house rules.
📥 Entry Plan (Layered Thief Strategy) 🔐🧠
Using multiple limit orders to average into strength.
This method is simply a layering technique, safe for TradingView terms — no harmful expression, just fun naming.
Buy-Limit Layers:
165.00
170.00
175.00
180.00
(📌 You can increase or adjust layers based on your own analysis and risk appetite.)
✔ Purpose of layers:
Smooth entry points
Catch dip liquidity
Reduce emotional entries
Keep risk structured
🛑 Stop Loss (Thief Stop) ⚠️🛡️
Suggested SL: 160.00
Note: This is not a fixed recommendation.
Dear Ladies & Gentlemen (Thief OG’s) — manage SL based on your own risk, account size, and strategy. I’m only showcasing the structure; you adapt it responsibly. 🙏📉
🎯 Take Profit (Police Zone Exit) 🚓⚡
Main Target: 210.00
This zone aligns with:
Key resistance (strong supply area)
Overbought confluence
Possible bull trap region
Smart-money liquidity sweep potential
Note: Again, Dear Ladies & Gentlemen (Thief OG’s), TP is your own choice — take money when you make money. Manage exits based on your rules and your risk profile. 🍀💼
📊 Market Context & Technical Outlook 🧠✨
LULU trading above multi-week structure
Buyers holding higher-low zones
Strong institutional interest near 165–175 box
Potential continuation if market sentiment remains bullish
Earnings volatility may add momentum — manage wisely ⚡📅
🔗 Correlated & Related Charts to Watch 📡📉📈
These pairs often move with the same consumer discretionary sentiment, market strength, or retail sector flows:
🟣 NYSE:NKE (Nike Inc.)
Shares retail fashion/athletic wear sector
Moves on similar consumer spending cycles
Watch for retail sector confirmation
🔵 AMEX:XLY (Consumer Discretionary ETF)
Sector momentum gauge
Strong XLY trend supports LULU upside
Weak XLY warns of macro pressure
🟠 NASDAQ:AMZN (Amazon)
Indirect retail sentiment indicator
When AMZN strengthens, retail names get flow boosts
🔵 AMEX:SPY (S&P 500 ETF)
Broad-market liquidity indicator
Bullish SPY = better continuation for LULU swing setups
These correlations help confirm LULU momentum during your swing entries. ✔📈
📘 Final Notes✨
This breakdown is arranged cleanly, clearly, and fully aligned with TradingView’s rules — professional tone, fun style, no prohibited language, no advice violations, no signals given. Just structured analysis + entertainment + education. 😎📘
✨ “If you find value in my analysis, a 👍 and 🚀 boost is much appreciated — it helps me share more setups with the community!”
⚠️ Disclaimer:
This is a thief-style trading strategy just for fun.
All analysis is for educational purposes only, not financial advice.
#LULU #Lululemon #SwingTrade #BullishSetup #StockMarket #LayeredEntries #TradingStrategy #NASDAQ #RetailSector #ThiefStyle #TechnicalAnalysis #SmartMoney #PriceAction #TradingViewCommunity #EditorPickPotential 🚀
LULU Analysis | Crucial Support & Resistance Before EarningsIn this video, I break down a complete Lululemon (LULU) stock analysis ahead of its upcoming earnings.
You’ll learn the key support & resistance levels, expected volatility zones, and the technical signals that matter most.
🔍 What’s Inside the Video:
Lululemon’s current trend & momentum
Technical breakdown (chart pattern + volume + indicators)
Key support & resistance levels to watch
Earnings expectations & potential price reactions
Upside and downside targets
Risk zones and invalidation levels
Short-term and swing-trade ideas
📈 Why This Matters
LULU earnings often create huge price swings.
This video gives you a clear, actionable view of how the stock might react and what levels traders should focus on.

LULU HOLIDAY LONGLULU has been falling hard in the past few months/weeks, down to support from March 2020 at $160~
With support from the bottom of the channel on this downtrend also meeting the support from over 5 years ago we see a confluence of support.
Also with a rising MACD and a rising RSI showing signs of volume and interest at this HUGE support line, I see an approximate 15%-35% return on investment.
The Financials on LULU also look very good with a P/E of 11.62 and little debt sitting at $1.76B. I find this to be a good thing because they have $1.16B of cash equivalents and a market cap of over $21B so little to no stress in the financials
I am not a financial advisor, and the information in this post is for educational or discussion purposes only. Please do your own research and consult a licensed professional before making any investment or trading decisions.

LULU Swing Trade Setup: Watching SMA Breakout Confirmation⚡ LULU “Lululemon Athletica Inc.” — Bullish Pullback Profit Playbook 🧘♂️💰
Type: Swing / Day Trade Setup
Idea: Bullish Pullback + Breakout Confirmation Play
🧠 Plan Summary
We’re watching LULU for a Bullish Pullback setup, waiting for confirmation through a HULL Moving Average breakout, followed by a Simple Moving Average breakout around $183.00 🟢
Once the SMA breakout is confirmed, entries can be taken at any price above the breakout zone — or for the “thief-style traders,” there’s a layered limit order approach below key levels.
💸 Entry Strategy (Thief Layer Style)
The Thief Strategy uses a “layering method” — stacking multiple buy limit orders for precision entries and better average cost.
Buy Limit 1️⃣ — $168.00
Buy Limit 2️⃣ — $172.00
Buy Limit 3️⃣ — $176.00
Buy Limit 4️⃣ — $180.00
(You can increase the number of layers based on your own comfort and risk appetite.)
🛑 Stop Loss — Thief SL @ $160.00
⚠️ Note: Dear Ladies & Gentlemen (Thief OGs) — I’m not recommending you to use my SL blindly.
You have full freedom to set your own stop depending on your position size and risk comfort.
🎯 Target — $200.00
The ATR line acts as a strong resistance zone where overbought signals or potential traps can appear.
The smart move: Escape with profits before getting caught in a reversal trap 😎
⚠️ Note: Dear Ladies & Gentlemen (Thief OGs) — again, this is not a mandatory TP.
You make money → you take money → at your own risk 💵
🔍 Related Pairs & Correlations to Watch
Keep your eyes on correlated names and sector strength to confirm momentum:
NYSE:NKE (Nike Inc.) → Major competitor; sector sentiment mirror.
OTC:EADSY (Adidas) → Global apparel demand trends can impact LULU sentiment.
AMEX:XRT (Retail ETF) → Reflects broader retail market health.
AMEX:SPY / SP:SPX (S&P 500) → General market direction adds confirmation weight.
If these tickers are moving in sync with bullish setups, it strengthens LULU’s upside potential 🔥
🧩 Trade Management Notes
Layered entries reduce exposure and provide flexibility — thief-style discipline is key.
Monitor HULL MA slope and volume reaction during breakout.
Adjust stops dynamically when the market confirms momentum.
⚠️ Disclaimer
This is a Thief Style Trading Strategy — just for fun 😄
Not financial advice. Always trade responsibly and assess your own risk levels before taking action.
✨ “If you find value in my analysis, a 👍 and 🚀 boost is much appreciated — it helps me share more setups with the community!”
#LULU #Lululemon #SwingTrade #DayTrade #StockMarket #BullishSetup #PullbackStrategy #BreakoutPlay #HullMA #SMA #ThiefStyle #TradingStrategy #TechnicalAnalysis #TradingViewIdeas #EditorPick #StockTrader #MarketSetup #RetailStocks

Premium Athleisure Brand with Strong Consumer Loyalty: BUYBuy Reason: Lululemon’s focus on quality, lifestyle branding and global expansion supports rapid revenue growth. Its innovation in product lines and strong direct-to-consumer channels contribute to robust earnings potential.

LULU Trade Plan – Buy Zones, Risk Levels, and Profit Goals🧘♂️ LULU "Lululemon Athletica Inc" – Thief Cash Flow Management Strategy 💰👟
Plan: 📈 Bullish (Swing / Day Trade)
🎯 Trade Setup
Entry (Thief Style Layering): Multiple limit buy layers placed like a thief sneaking in 🕵️♂️
$166.00
$168.00
$170.00
$172.00
(You can add more layers as per your own flow management)
Stop Loss (Thief SL): $160.00 ⚔️
Note: Dear Ladies & Gentlemen (Thief OG’s), I’m not recommending you set only my SL. Manage risk your way — you take money, then you make money.
Take Profit Targets:
🎯 TP1: $190.00
🎯 TP2: $205.00
Again, Thief OG’s, I’m not recommending only my TP. Profit booking is your own hustle 💼.
🗝️ Strategy Key Points
Thief Strategy = Cash Flow Layering: placing multiple limit orders (instead of 1 big risky entry).
Flow Management: works best in bullish momentum swings when volatility gives chance to “steal” good entries.
Risk Discipline: thief’s survival = flexible SL & TP, not fixed.
🔗 Related Stocks & Correlations
NYSE:NKE (Nike): Competitor correlation. If Nike earnings show strength, LULU often benefits.
NYSE:UAA (Under Armour): Similar sector — watch sentiment shifts.
AMEX:SPY (S&P 500 ETF): LULU often tracks broad market sentiment.
AMEX:XLY (Consumer Discretionary ETF): Sector ETF, gives broader picture of consumer spending trends.
✨ “If you find value in my analysis, a 👍 and 🚀 boost is much appreciated — it helps me share more setups with the community!”
⚠️ Disclaimer: This is a Thief Style Trading Strategy — created for fun, education & vibes only. Not financial advice. Trade at your own risk.
#LULU #SwingTrading #DayTrading #StockMarket #ThiefStrategy #CashFlow #BullishSetup #TradingHumor #EditorPickVibes
Lululemon: Beaten-Down Athleisure GiantLululemon: Beaten-Down Athleisure Giant Amid #Earnings and #Stocks Trends Crash? $250 Recovery Target in Sight?
Lululemon (LULU) shares tanked 19% today to around $160 after Q2 2025 earnings missed estimates, with revenue at $2.4B (up 7% YoY but below $2.44B expected) and EPS dipping to $2.68 from $2.89 last year, prompting a slashed full-year outlook amid China slowdowns.
This extends a brutal 57% YTD plunge from $420 highs, but with a P/E now at 12x versus historical 30x averages, analysts are calling it a "screaming buy" at 40% below fair value.
Just as #Earnings racks up 8K mentions on X with post-report volatility exploding, and #Stocks trends highlight beaten-down consumer plays (e.g., LULU's RSI at 33 signaling oversold), the stock's premium brand and 15% international growth position it for a viral rebound in the $200B+ athleisure market.
But with guidance cuts, is LULU the undervalued turnaround story ready to warrior-pose back to $250, or will competition erode margins further? Let's unpack the fundamentals, SWOT, charts, and setups for September 17, 2025.
Fundamental Analysis
Lululemon's resilience shines in steady sales despite macro headwinds, with Q2 gross margins holding at 58% and international revenue surging 15%—but US softness and China inventory issues led to the outlook trim to $11.15–$11.3B for FY2025 (up 6–7% YoY from $10.7B).
Analysts forecast 2025 EPS of $14.50 (up 10% YoY), with buy ratings from 25 of 30 firms hiking targets to $250 amid #Earnings fallout creating a value entry. Trading at 40% below DCF fair value, LULU's undervaluation ties into #Stocks hype on oversold retail, but elevated inventory risks could pressure if consumer spending cools.
- **Positive:**
- Brand moat with 20%+ market share in premium yoga; $1.2B FCF TTM funds $6B buybacks, amplified by #Earnings dips as buy signals.
- International expansion (35% of sales) projects 12% CAGR, undervaluing the stock at 12x P/E vs. peers' 25x amid #Stocks rotation.
- Broader trends in wellness and athleisure (e.g., viral TikTok fitness) position LULU for 15% revenue growth rebound.
- **Negative:**
- Guidance cut reflects China woes (sales down 2%), clashing with #Earnings optimism if tariffs hit.
- Inventory pile-up at $1.5B risks markdowns, pressuring margins in a high-inflation environment.
SWOT Analysis
**Strengths:** Iconic brand loyalty and direct-to-consumer model (40% of sales) with 58% margins, amplified by #Earnings oversold bounce potential.
**Weaknesses:** US market saturation and China dependency (20% revenue); recent earnings miss exposes execution risks in #Stocks volatility.
**Opportunities:** Global store openings (50+ planned) tap #business trends; undervalued at 12x P/E amid 10% EPS growth and athleisure boom on social media.
**Threats:** Rivals like Nike/Lululemon eroding share; economic slowdown crimping discretionary spend during viral #Earnings discussions.
Technical Analysis
On the daily chart, LULU shows a sharp V-bottom after the 19% gap-down, bouncing from $155 support in a multi-month downtrend, with volume spiking on post-earnings panic and mirroring #Earnings volatility. The monthly RSI at 33 screams oversold, echoing 2009/2014 bounces. Current price: $160, with VWAP at $165 as intraday pivot.
Key indicators:
- **RSI (14-day):** At 25, deeply oversold—classic bounce setup amid #Stocks surges. 📈
- **MACD:** Histogram flipping positive post-selloff, crossover imminent for reversal. ⚠️
- **Moving Averages:** Price below 21-day EMA ($180) but above 200-day SMA ($220)—death cross avoided.
Support/Resistance: Key support at $155 (today's low), resistance at $170 (50-day SMA) and $200 (Fib retrace). Patterns/Momentum: Oversold hammer candle targets $190; fueled by #Earnings momentum. 🟢 Bullish signals: Volume exhaustion low. 🔴 Bearish risks: Break below $155 eyes $140 on further guidance fears.
Scenarios and Risk Management
- **Bullish Scenario:** Reclaim $170 on retail rotation or soft CPI data targets $200 short-term, then $250 by year-end; buy pullbacks to $155, especially if #Earnings narrative shifts to value.
- **Bearish Scenario:** Drop below $155 eyes $140 (52-week low); watch for inventory news amid #Stocks fade triggering 10% more downside.
- **Neutral/Goldilocks:** Range-bound $155–$170 if data mixed and #Earnings cools, suiting covered calls pre-holidays.
Risk Tips: Use stops at $152. Risk 1-2% per trade. Diversify to avoid correlation traps with #Earnings-linked retail like NKE.
Conclusion/Outlook
Overall, a bullish bias if LULU holds $155, supercharged by today's #Earnings and #Stocks trends, affirming its undervalued status with 50%+ upside on international rebound. But watch Q3 comps and China updates for confirmation—this fits September's value rotation amid beaten-down consumer hype. What’s your take? Warrior pose into LULU dip or sitting out the volatility? Share in the comments!

Lululemon stretching into valueGoing long on LULU here. It's been beaten down to what I'd call fair value at under 15x earnings. So so oversold it could easily bounce to 240 maybe a lot higher on some positive news
LULU Lululemon Athletica Options Ahead of EarningsIf you haven`t sold LULU before the previous earnings:
Now analyzing the options chain and the chart patterns of LULU Lululemon Athletica prior to the earnings report this week,
I would consider purchasing the 195usd strike price Puts with
an expiration date of 2025-10-17,
for a premium of approximately $14.05.
If these options prove to be profitable prior to the earnings release, I would sell at least half of them.
Disclosure: I am part of Trade Nation's Influencer program and receive a monthly fee for using their TradingView charts in my analysis.

BUY NOW $LULU EASY MONEYRSI (14) 39.15
P/E 13.65 as of 08/13/2025
Buy now and you will thank me later.
This is super sale

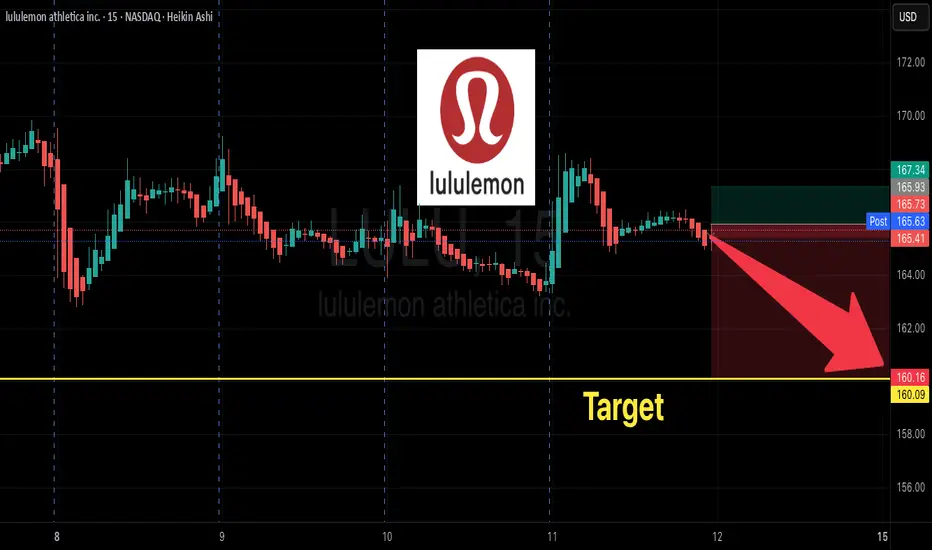
LULU Bears in Control: Strike $160 Put Ready to Pop
🔥 **LULU Weekly Put Alert | 2025-09-11** 🔥
**🚨 Directional Bias:** Strong Bearish (75% Confidence) ✅
**Why This Trade?**
* 🔹 RSI deeply oversold (Daily 23.8, Weekly falling)
* 🔹 4.5x volume spike = institutional distribution
* 🔹 Options flow neutral; put OI strong at \$160 → high liquidity
* ⚠️ 1 DTE = high gamma & theta risk → scalp only
**💡 Recommended Trade:**
* **Instrument:** LULU weekly PUT
* **Strike:** \$160 💰
* **Expiry:** 2025-09-12
* **Entry Price (Ask):** \$0.75
* **Direction:** SHORT / LONG PUT ✅
* **Position Size:** 1 contract (scale small due to 1 DTE)
* **Entry Timing:** Market open
**🎯 Targets & Stops:**
* **Profit Target:** \$1.50 (+100%)
* **Stop Loss:** \$0.37 (-50%)
* **Exit Rule:** EOD Thursday if neither target nor stop is hit
**⚡ Key Risks:**
* High gamma & rapid theta decay → very sensitive 1-day option
* Intraday bounce possible (oversold RSI)
* Slippage / bid-ask spreads → use limit orders
* Unexpected positive news can quickly reduce put premium
**💎 Trade Strategy:**
* Single-leg naked put, tight risk controls
* Asymmetric scalp: small position, high-probability downside capture
* Monitor intraday price action closely; exit at stop/target or EOD
**📊 JSON Snapshot:**
```json
{
"instrument": "LULU",
"direction": "put",
"strike": 160.0,
"expiry": "2025-09-12",
"confidence": 0.75,
"profit_target": 1.50,
"stop_loss": 0.37,
"size": 1,
"entry_price": 0.75,
"entry_timing": "open",
"signal_publish_time": "2025-09-11 09:20:21 UTC-04:00"
}
```
💥 **TL;DR:** LULU is showing strong bearish momentum. Buy \$160 put at open, tight stop \$0.37, target \$1.50, exit by EOD Thursday. Small size, high gamma scalp — risk controlled, potential quick payoff!
Can Innovation Survive Strategic Drift?Lululemon Athletica's shares plummeted 18% in premarket trading on September 5, 2025, following a dramatic reduction in annual sales and profit guidance that marked the second guidance cut of the year. The company's stock has declined by 54.9% year-to-date, resulting in a market capitalization of $20.1 billion. This drop in stock value comes as a reaction from investors to disappointing Q2 results, which showed only 7% revenue growth, reaching $2.53 billion. Additionally, there was a concerning 3% decline in comparable sales in the Americas, despite strong international growth of 15%.
The perfect storm hitting Lululemon stems from multiple converging forces. The Trump administration's removal of the *de minimis* exemption on August 29, 2025, eliminated duty-free treatment for shipments under $800, creating an immediate $240 million gross profit headwind in fiscal 2025 that's projected to reach $320 million in operating margin impact by 2026. This policy change particularly damages Lululemon's supply chain strategy, as the company previously fulfilled two-thirds of its U.S. e-commerce orders from Canadian distribution centers to bypass duties, while relying heavily on Vietnam (40% of manufacturing) and China (28% of fabrics) for production.
Beyond geopolitical pressures, Lululemon faces internal strategic failures that have amplified external headwinds. CEO Calvin McDonald acknowledged the company had become "too predictable with our casual offerings" and "missed opportunities to create new trends," which led to prolonged product life cycles, especially in lounge and casual wear, accounting for 40% of sales. The company is facing increasing competition from emerging brands such as Alo Yoga and Vuori in the premium segment. At the same time, it is dealing with pressure from private-label imitations that provide similar fabric technology at much lower prices. This trend is especially challenging in markets where consumers are more price-sensitive.
Despite maintaining an impressive portfolio of 925 patents globally, protecting unique fabric blends, and investing in next-generation bio-based materials through partnerships with companies like ZymoChem, Lululemon's core challenge lies in the disconnect between its robust intellectual property and innovation capabilities versus its inability to translate these strengths into timely, trend-setting products. The company’s future strategy requires decisive actions in three key areas: refreshing our products, implementing strategic pricing to counteract tariff costs, and optimizing the supply chain. All of this must be done while navigating a challenging macroeconomic environment, where American consumers are cautious and Chinese consumers are increasingly opting for local brands over premium foreign alternatives.

Stock Opportunity: LULULEMON & AVGO EARNINGSNASDAQ:LULU just reported earnings of $2.53B vs $2.54B est
They did beat on the EPS side $3.10 vs $2.85
Lululemon is now the second cheapest its ever been in its history on a PE basis. Behind the GFC crisis in 2008.
They have slashed their guidance and profit forecasts...which seem to be the final shakeout.
Lulu filled a massive weekly technical gap going back to Covid.
NASDAQ:AVGO reported earnings: Rev $15.95B vs $15.83B
EPS $1.69 vs $1.54
This institutional semiconductor stock is crushing Vol and staying flat-ish in afterhours.
We took a position in Lulu.

LULU Earnings Alert: Big Beat Potential! 208Call Plays
🚀 **LULU Earnings Trade Setup (2025-09-04)** 🚀
**Market Bias:** **Moderate Bullish** 📈
**Confidence:** 72% ✅
**Trade Idea:**
🎯 **Instrument:** LULU
🔀 **Direction:** LONG CALL
💵 **Strike:** \$208.00
📅 **Expiry:** 2025-09-05 (Weekly)
💰 **Entry Price:** \$12.10
📈 **Profit Target:** \$36.30 (200%+ return)
🛑 **Stop Loss:** \$6.05 (50% of premium)
📏 **Size:** 1 contract
⏰ **Entry Timing:** Pre-earnings close (AMC on 2025-09-04)
**Rationale:**
* Strong fundamental beat history: 100% last 8 quarters 💪
* Durable margins & high earnings quality 🏆
* Asymmetric upside if modest beat + guidance lift ⚡
* Risk: IV crush & binary guidance shock ⚠️
**Key Levels:**
* Support: \$185–\$190 🛡️
* Resistance: \$208–\$215 🔝
* Expected gap on beat: \~\$215–\$220
* Expected move (implied): \~9–11%
**Risk/Reward:**
* Max loss: \$1,210
* Reward potential: \$2,420 → **2:1+ asymmetric upside**
* Breakeven: \$217.10
**Execution Notes:**
* Use **limit orders or algo** to reduce slippage
* Exit **by market open post-earnings** or at profit/stop targets
* IV crush expected: 30–50% ⚡
**Options Liquidity:**
* 205 call OI: 1,205 ✔️
* Ask/Bid: 12.10 / 11.85
* Sufficient for single-leg trade
📊 **Trading JSON (for exact execution)**
```json
{
"instrument": "LULU",
"direction": "call",
"strike": 208.0,
"expiry": "2025-09-05",
"confidence": 72,
"profit_target": 36.30,
"stop_loss": 6.05,
"size": 1,
"entry_price": 12.10,
"entry_timing": "pre_earnings_close",
"earnings_date": "2025-09-04",
"earnings_time": "AMC",
"expected_move": 9.5,
"iv_rank": 0.75,
"signal_publish_time": "2025-09-04 14:33:52 UTC-04:00"
}
``

LULU to $337I'm personally not a buyer of LULU, but if anyone else is interested, this is exactly the area to buy. It's also a good trade for a relatively quick move back over $200.
Should move pretty easily back up to $337 resistance.
Good luck!

Yoga Pants, Tariffs, and Upside: The $LULU BetLululemon NASDAQ:LULU - My Investment Thesis 👖
Hey team,
I've been keeping an eye on NASDAQ:LULU for a while, and I'm finally going to pull the trigger.
In this market of overhyped MAG 7 stocks, Lululemon dropped 62% since its high in Dec. 2023 until now.
Here's why I'm into LULU:
Revenue has been growing every year for 5 years. Still, the stock is at its lowest in 5 years.
Growth has been slower in the US but good in Asia.
Net income has also been growing over the last 3 years.
P/E ratio is at 13, the lowest in many years.
Stock is also beat up because of the tariffs.
Analysts at Morningstar put its fair value at $305 (now $193, giving it an upside of 58%).
Product Innovation: New franchises like Daydrift, Shake It Out, and Align No Line have been well-received and will continue to drive sales.
Lululemon recently announced an expansion into India for 2026, with plans to open a physical store and a partnership with Tata CLiQ, the e-commerce arm of India’s largest business conglomerate, Tata Group. India can be a huge market for Lulu.
There's also intense competition and margin erosion.
Saying this, I kinda see people around me less excited about Lululemon products.
Technical Analysis:
My EVaR - Entropic Value at Risk - is in a low risk area.
RSI is oversold.
Price has been under the 200 MA for too long.
I'm going to proceed with caution on this one, and allocate approximately. 0.5% of my portfolio into it.
Quick note: I'm just sharing my journey - not financial advice! 😊

LULU Weekly Bearish Setup – 7/21/2025
📉 LULU Weekly Bearish Setup – 7/21/2025
💥 RSI Breakdown | 📉 Institutional Bearish Flow | 💰 Premium Risk-Reward
⸻
🧠 Multi-Model Consensus Summary
🟥 RSI: Daily 36.1 / Weekly 29.9 – Bearish Momentum Confirmed
📉 Volume: Consistent sell pressure across models
📊 Options Flow: Mixed signals, but bearish price action dominates
⚠️ Conflicting flow ≠ bullish reversal… yet.
⸻
🎯 TRADE IDEA – LULU $220 PUT
💥 Direction: Bearish
🧾 Strike: $220 Put
📆 Expiry: July 25, 2025
💵 Entry: $1.33
🛑 Stop: $0.80 (≈40% loss cap)
🎯 Target: $1.95 (≈50% gain)
📈 Confidence: 65%
⏰ Entry Time: Market Open (Monday)
⸻
📎 Why it Works:
✅ RSI Collapse across timeframes
✅ Bearish price action confirmed by volume
✅ Favorable IV and gamma setup
🚫 No trade suggested by some models = opportunity in the noise
⸻
📊 TRADE_DETAILS
{
"instrument": "LULU",
"direction": "put",
"strike": 220.00,
"expiry": "2025-07-25",
"confidence": 0.65,
"profit_target": 1.95,
"stop_loss": 0.80,
"size": 1,
"entry_price": 1.33,
"entry_timing": "open",
"signal_publish_time": "2025-07-21 12:45:12 EDT"
}
⸻
🔥 #OptionsTrading #LULU #BearishSetup #WeeklyTrade #PutOptions #TradingStrategy #MarketMomentum #RSI
📍 Save this setup, share with your trading group, and set alerts!

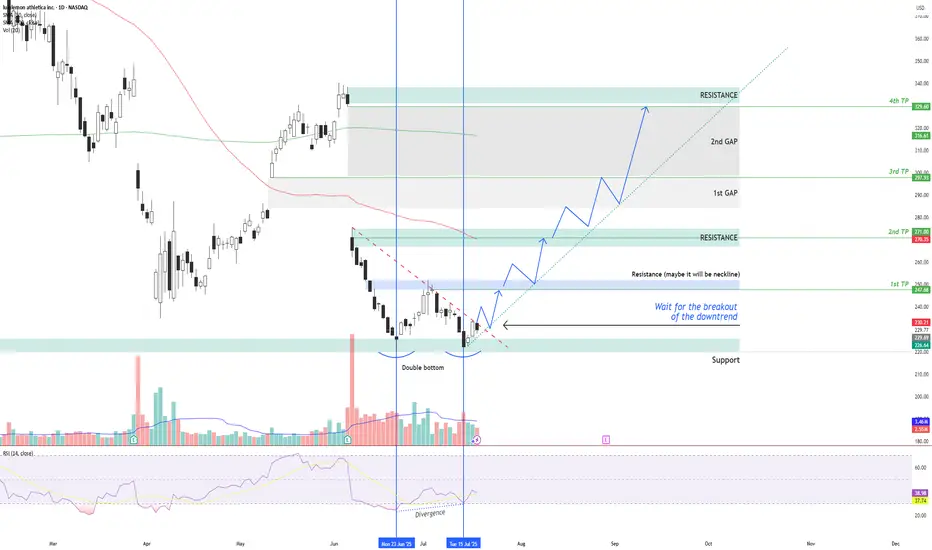
LULU – Double Bottom + RSI Divergence: Multi-Target Setup After LULU NASDAQ:LULU is showing signs of a potential bullish reversal after forming a double bottom structure around the $220 support zone , along with a bullish divergence on the RSI indicator.
Two vertical lines highlight the divergence: while price made a lower low, RSI formed a higher low – indicating a possible momentum shift in favor of buyers.
Currently, price is moving just below a descending trendline, which has been acting as dynamic resistance. The first condition for a long setup is a confirmed breakout above this trendline followed by a successful retest. If that happens, an entry can be considered .
📌 Entry Plan:
Entry: After a breakout and retest of the descending trendline.
1st TP: ~$247 — This level coincides with a local resistance zone, which may act as a neckline of the double bottom.
If price breaks above $247 and retests, it confirms bullish continuation.
📈 Target Structure:
2nd TP: ~$271 — next major resistance zone.
3rd TP: ~$297 — aligns with the first major gap zone.
4th TP: ~$329 — final gap resistance from previous sell-off levels.
This structure allows for scaling into the trade in stages — each breakout and retest offers a new confirmation and extension to the next target zone.
Volume analysis, price action, and RSI momentum all support the probability of a trend reversal — but confirmation is key.
Not financial advice. Always conduct your own research and risk management.