Lumens

This Repetitive Move Is Leading The Stellar Lumens (XLM) To $2Falling wedge:
As we have seen in my previous article that the priceline of Stellar was moving in a falling wedge pattern. When I published my last post at that time the priceline of XLM was at the support of this falling wedge and I was waiting for two more indicators to turn bullish to predict the bullish divergence for breakout. These two indicators are momentum indicator and the stochastic. The reason I am using these two indicators to predict the breakout here because the price action of lumens is very much synchronized with these two indicators. On the chart it can be easily observed that whenever the priceline of lumen hits the support and the momentum turns weak bearish from strong bearish that is a kind of bullish signal and stochastic gives bull cross then priceline takes a bullish divergence and hits the resistance of the wedge.
I was expecting the same move this time. I am sharing the both screenshots the previous one and the current situation. It can be easily obeserved that when I shared the chart in my previous article at that time the stochastic was oversold and momentum indocator was strong bearish. In the next screenshot you can see the current situation that when the momentum turned waek barish and the stochastic gave bull cross the price action again took powerful bullish divergence as it has been doing in the past and at this time the Stellar is attempting to breakout the resistance of this wedge.
The previous move:
The current move:
Volume profile and Bollinger bands:
here the two more indicators are playing very important role one is the volume profile indicator and other one is the bollinger bands. If we place the volume profile on the complete price action moving within the falling wedge pattern then we can see that the trader’s interest is very weak below $0.038. Therefore when the priceline moved down where the trader’s interest is low the XLM turned bullish and reached the resistance of the wedge. And if we see the bollinger bands then it can be noticed that when the priceline made its first attempt to breakout the resistance of the wedge in May 2019 then the bollinger bands was below the resistance of wedge therefore it stopped the priceline of Stellar to have a breakout. After that the priceline made another attempt to break out the resistance of the wedge in Feb 2020. At that time the bollinger bands was again below the resistance of falling wedge and became a strong hurdle for priceline to breakout. But this time we have some different situation the bollinger bands is above the resistance of the wedge. Therefore the price action of Lumens can easily move out from the resistance of wedge, moreover if we observe the movement of the bollinger bands then it can be easily seen that the bollinger bands is slightly moving up and showing its tendency that it is making the way for the priceline to move up.
Bullish Crab pattern:
During the strong bearish move in the month of March 2020 the XLM has completed the formation of bullish Crab pattern. I also have shown this pattern in my previous post. If we take a closer look on the chart then it can be easily noticed that the priceline has just hit the spike in the potential reversal zone and as per sequence of bullish Crab the price line was the supposed to move up in the Fibonacci projection area of A to D leg from 0.382 to 0.786 Fibonacci level. We can see that finally the price action took a powerful bullish divergence and produced more than 93% bullish rally. At this time the 0.786 Fibonacci level is a strong resistance for the Lumen. And we can observe at this time the price line is hitting at this level for third time this is the same level where we also have the resistance of the falling wedge pattern.
Simple moving averages.
The position of the simple moving averages on the daily chart also goes in the favour of the breakout from the falling wedge pattern. If we see on the daily chart then the priceline has aggressively crossed up the 25, 50, 100 and 200 simple moving averages. Now it has the strong support of all these SMAs. And the 25 simple moving average has formed the golden cross with 50 and 100 SMAs and moving forward to cross up the 200 simple moving average. Following the 25 simple moving average 50 simple moving average is also moving up to form the golden cross with 100 and 200 SMAs. The golden cross between 50 and 200 simple moving average is considered as a strong bullish signal among the traders community. They always take it as a strong buy signal. After that we can expect the 100 simple moving average will also form the golden cross with 200 simple moving average. And after all these golden crosses we can have a complete opened alligator mouth of the moving averages below the price action of XLM that can produce more powerful bullish rally.
Long term resistance levels:
Now if we switch back to the weekly long-term chart. Then we find two major resistance levels on the way of Stellar. The first resistance level is $0.09, We can see that upto 2019 this resistance level was working as a strong support for the price action but once it is broken down in August 2019 after that the Lumen never able to cross up this resistance level again even after 3 attempts. Once the priceline will be able to cross up the 9 cents resistance then the price action may re-test this previous resistance as a support and move up to break out the next major resistance at $0.14 after breaking out this resistance the XLM doesn’t have another other resistance upto $0.23, so we can expect a faster move from $0.14 to $0.23.
Powerful bullish move that can lead the XLM to hit $2:
Now I would like to show you my favourite part of this analysis and that is the harmonic move of Stellar. If we move back in 2017 the priceline formed a big bullish harmonic BAT pattern on long-term weekly chart. And from the potential reversal zone of this BAT pattern the price action moved up with very powerful bullish divergence that leaded the Stellar to hit $0.51 that was more than 4000% powerful bullish rally. Now if we switch to the more bigger time period monthly chart then we can observe that same as like the previous move of 2017 the price action has a gain formed another very big bullish BAT pattern. And from past 5 months the priceline was moving at the bottom of this is BAT and now it has retraced back in the potential reversal zone. The potential reversal zone of this BAT starts from $0.11 and ends up to $0.059. We can expect another very big powerful divergence from this PRZ level but if I talk realistically then as per Fibonacci sequence the price action of Lumens should enter in the Fibonacci projection area from 0.382 to 0.786 Fibonacci projection of A to D leg. That is from $0.23 up to $0.41 that is also upto 600% big gain. However for stop loss we should use the potential reversal zone to minimize our risk.
Note: This idea is education purpose only and not intended to be investment advice, please seek a duly licensed professional and do you own research before any investment.

Stellar Lumens ($XLMUSDT) Looks BullishKeep watching the 0.052 level. If its break, 0.060 level can be reach.

XLM/BTC 4H (Binance) Pumped on double bottom, time to retraceStellar Lumens surprised us by gaining +23% from double bottom.
Now it's back above MA200 but I'm expecting that more downtrend is coming!
Sell Entry= 0.00000708 - 0.00000720
Take Profit= 0.00000682 | 0.00000663 | 0.00000631
Stop Loss= 0.00000746
Risk/Reward= 1:1 | 1:1.59 | 1:2.59
Expected Profit= 4.48% | 7.14% | 11.62%
Possible Loss= -4.48%
Fib. Retracement= 0.236 | 0.382 | 0.618
Margin Leverage= 1x | 3x | 5x

Watch the RSI for bounce.In my previous TA I showed you the H&S pattern which completed. This fall (both BTC and XLM) was very obvious based on the trend and other circumstances worldwide.
We should wait now to see if RSI falls into that low 20s area and set up buys. Nothing falls forever and looking at previous we should have good support here. Historically .04c is a level that we should not go under.
Safe trading.

XLMUSD is forming bullish Butterfly for upto 129% big moveXLM is forming bullish buttefly for upto 129% plz use the stop PRZ level as stop loss.
Targets are:
Buy between: 0.0454 to 0.0335
Sell between: 0.0546 to 0.0770
enjoy and regards,
Atif Akbar (moon333)

XLMUSD : Head and Shoulders, Buyers BewareTextbook head and shoulders pattern. BTC/USD Chart ( ) shows very similar pattern which could mean lower prices to come. Watch chart closely but to me this looks like a time to wait it out and buy in at lower prices.

Stellar Lumens possible 120% increase over the next 2 monthsBased on RSI and wavetrends lining up with what looks like to be a bullish pennant.
Just collecting ideas to learn. Any feedback appreciated.

XLMUSD formed bullish BAT | Upto 46% bullish movePriceline of XLM / US Dollar cryptocurrency has formed a bullish BAT pattern and entered in potential reversal zone.
This PRZ area should be used as stop loss point in case of complete candle stick closes below this area.
I have used Fibonacci sequence to set the targets:
Buy between: 0.060290 to 0.056511
Sell between: 0.069304 to 0.082804
Regards,
Atif Akbar (moon333)

Xlmbtc: pump time!Short and simple.
Xlmbtc should pump while btc drops. Target indicated on chart. Will likely have subwaves along the way.

XLMUSD Has Formed Crab Within BAT And Competed The Bullish SetupIn my previous post I elaborated that how the price action of Stellar has formed a very big bullish BAT pattern on month chart and completed the bullish setup for upto 596% gains.
But the recent bearish move of price line that was started since Nov 2019 to Dec 2019 and leaded the price action more than 53% down.
The above bearish move pushed the forced the price action to hit the support of potential reversal zone of this big bullish BAT pattern even now the price action is hitting the spike beyond this PRZ support.
But now the price action of Stellar has shown another positive move that it doesn’t move down straight even it is moved down in another Fibonacci sequence which can be clearly seen on 2 day chart with Heikinashi candle sticks setup and it has formed bullish Crab pattern within this potential reversal zone of bigger bullish BAT pattern. For last leg the price action was required to retrace between 1.27 upto 1.618 Fibonacci sequence and if we measure its move then it has retraced upto 1.283 and full filled the requirement and confirmed that it is a bullish Crab:
The above harmonic move of Crab pattern has confirmed that the price action is ready to move up again and the next candle on month chart will be moved again within the potential reversal zone of big Bullish BAT pattern or sideways with the current candle and the fear of breaking down the support of this PRZ level is decreased even finished.
Now the targets can be two:
For mid term trade on 2 day bullish Crab pattern:
Buy between: $0.048953 to $0.038544
Sell between: $0.057035 to $0.076600
This trade setup has potential to give upto 98% profit.
For Long term trade on month chart bullish BAT pattern:
Buy between: $0.110241 to $0.059381
Sell between: $0.231517 to $0.413568
This trade setup has potential to give upto 596% profit.
But if the candle stick closes above the 0.786 Fibonacci projection of A to D leg of bullish BAT which is at $0.413568 then the price action may achieve the highest price ever in the history of xlm or atleast it will hit the final resistance of 0.41 dollar.
In both trades we can use the support of potential reversal zone as stop loss in case of complete candle stick closes below this PRZ level.
Regards,
Atif Akbar (moon333)

Wyckoff Porn: Sexy Stellar DistributesXlmusd possibly has begun Wyckoff Distribution. To confirm, price must close below bottom orange horizontal line.
Distribution can play out many ways. This chart depicts one such way by assuming an ABC type correction in descending parallel channel with indicated target price.

Distribution update Green falling wedge broke down. I think price will follow blue wedge formed with the blue dashed trend line and bottom line of parallel channel. Potential forecast indicated with pink arrows and trend line. Timeline not to scale and intended to be part of forecast.
See main idea for more context.

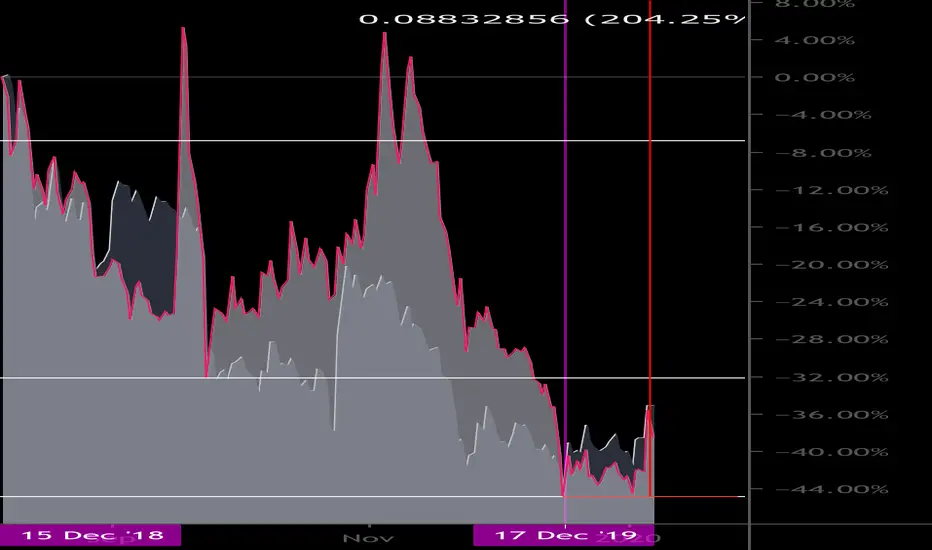
Xlmusd: Fun chart forecasts 200% growthFun chart to play around with. Xlmusd in foreground and Btcusd in background. White horizontal lines correspond to different Xlmusd accumulation phases that started in December ‘18.
Price should rise 200% from Dec ‘19 low.

XLM building to make 200%+ movement soonWavetrend and Volume oscilator indicators seem to be lining up to retrace back to the Major resistance 2 line. This may happen once XLM breaks Major resistance 1 line.
This isn't trading advice, just documenting and learning ideas.
Any feedback is appreciated.

Stellar Lumens - $XLM - Let it play out... Allowing the wave (2) low is in place at 0.05140.
XLM has continued its decline. Wave ((2)) has a downside limit of 0.0620. A breach wouldn't necessarily rule out a bullish count, but we would have to rethink it.
Key Levels: 0.05140, 0.05693, 0.0620, 0.0890
GOOD LUCK!
We go together
Together we are stronger
Share and like
I am not Bearish long term. I am a Bull of Bulls.
Thanks
God bless you!
Proverbs 19:8
8. The one who gets wisdom loves life;
the one who cherishes understanding will soon prosper.
===============================================================================
BlackMEX - PREMIUM
We are a BITMEX specialized channel.
Our philosophy focuses on capital preservation and good risk/return operations.
We'll share our analysis, calls, and share studies that can help you be a better trader.
Enjoy! ** 2 weeks free sign up
Telegram > t.me
===============================================================================
Twitter > twitter.com
===============================================================================
===============================================================================
CAUTION!
DISCLAIMER
Trading is risky.
Here s a small explanation about why Im giving insight into my trades. Crypto is all about trust and transparency and that is what ID like to bring. Dont expect me to tell you how much crypto I actually own because thats none of your business. But I Will tell you how big my position will be in regard to my trading portfolio.
Secondly and actually the main reason im doiing this, is to proof to all the HALTERS out there that you can earn money with trading crypto. Most people are skeptical about trading because they heard horror stories about people who lost all their money. Follow my journey and let me proof therm wrong.
At the end of the day, the most important thing is how good are you at risk control.
Booking some losses during trading is perfectly normal, so im not afraid to show those losses. Most traders dont give any insight in what they because they perfectly know they suck and dont have a clue what they are doing in regard to risk management.
Risk comes from not knowing what you're doing.
Just like every trader, Ive seen ups and downs in my journey. I started trading stocks. And you can guess what that meant for my portfolio. Yes thats right, it was almost completely wiped out.
But I pressed on, learned a lot about technical analysis and here we are. I have experience in trading stocks, options, and commodities .
So you can assume that I know how to deal with risks.
===============================================================================
$BTC $BCH $BNB $XLM $EOS $ETH $ADA $LTC $TRX $XRP $IOTA $LINK $XTZ $BTT $XMR $NEO $BTT $MATIC $XMR $MRK $XEM $ONT $DASH $BAT $ZRX $LSK $NANO $REP
#altcoins #bitcointrading #cryptocurrency #cryptotrading #CRYPTO #STELLAR #XLM #BuyTheFear #BuyTheDip

xlmusd attempting to breakout of a 4hr inv h&sThis could easily be a fakeout so I'm not picking a side just yet...however if it triggers XLM could be heading to 9.5 cents in the near future here. Price action is currently testing the neckline and throwing little wicks above it so it's still right in the fakeout zone but if we see 3-5 consecutive 4hr candle closes above the neckline and a surge in bullish volume that will be the signal that it is triggering the breakout. Not a fan of XLM, Jed McCaleb or the recent and very desperate burning of 50% of their total supply..however once thew upcoming bull market kicks in for alts I would not be surprised to see XLM gain 500% or so during that run despite its horrible fundamentals.

XLMBTC Cup and handle & Descending TriangleOn the 4H chart you can see a clear cup and handle pattern, on the 2H a descending triangle. Gains incoming??


85%+ For Stellar Lumens? Getting Ready For Another Jump...Stellar Lumens (XLMBTC) retraced after a strong breakout and is getting ready for its next move... Here is our previous chart:
Right now the chart is looking really bullish. EMA10 and EMA50 have been fully conquered and the next barrier is sitting at 0.00000839 which is EMA100. This target will be easily hit and additional growth will follow.
Chart signals for Stellar Lumens (XLMBTC)
Increasing bull volume.
Trading above resistance.
Very strong RSI.
Bullish TD Sequential.
Altcoins market bullish sentiment.
Bitcoin bouncing and continues strong.
All the details are found on the chart.
You can see multiple targets as well as the main potential bullish scenario marked with green arrows.
The bearish scenario is also possible but not relevant at the moment as it is less likely to happen... This chart is super bullish.
Namaste.

Stellar (XLMUSD) short.All description on the chart.
Please, don't forget to like and follow.
Thank you.

XLMBTC LONGLarge moves coming for alts. Dont sell the initial pumps. Wait for the home runs.
God Speed,
Mr. Manbearpig
