EURCAD Will Go Down! Sell!
Take a look at our analysis for EURCAD.
Time Frame: 1h
Current Trend: Bearish
Sentiment: Overbought (based on 7-period RSI)
Forecast: Bearish
The price is testing a key resistance 1.624.
Taking into consideration the current market trend & overbought RSI, chances will be high to see a bearish movement to the downside at least to 1.617 level.
P.S
We determine oversold/overbought condition with RSI indicator.
When it drops below 30 - the market is considered to be oversold.
When it bounces above 70 - the market is considered to be overbought.
Like and subscribe and comment my ideas if you enjoy them!
M-forex

AUD/USD Extends Uptrend as Market Sentiment Turns BullishMarket Analysis: AUD/USD Extends Uptrend as Market Sentiment Turns Bullish
AUD/USD started a fresh increase above 0.6500 and 0.6520.
Important Takeaways for AUD USD Analysis Today
- The Aussie Dollar started a decent increase above 0.6500 against the US Dollar.
- There is a short-term contracting triangle forming with support at 0.6540 on the hourly chart of AUD/USD.
AUD/USD Technical Analysis
On the hourly chart of AUD/USD, the pair started a fresh increase from 0.6420. The Aussie Dollar was able to clear 0.6500 to move into a positive zone against the US Dollar.
There was a close above 0.6520 and the 50-hour simple moving average. Finally, the pair tested 0.6560. A high was formed near 0.6559 and the pair recently started a short-term downside correction. There was a minor decline below 0.6550.
On the downside, initial support is near a short-term contracting triangle at 0.6540 and the 50-hour simple moving average. The next area of interest could be 0.6520. If there is a downside break below 0.6520, the pair could extend its decline toward the 0.6490 zone and the 50% Fib retracement level of the upward move from the 0.6421 swing low to the 0.6559 high.
Any more losses might signal a move toward 0.6475 and the 61.8% Fib retracement. On the upside, the AUD/USD chart indicates that the pair is now facing resistance near 0.6560.
The first major hurdle for the bulls might be 0.6580. An upside break above 0.6580 might send the pair further higher. The next stop is near 0.6620. Any more gains could clear the path for a move toward 0.6650.
This article represents the opinion of the Companies operating under the FXOpen brand only. It is not to be construed as an offer, solicitation, or recommendation with respect to products and services provided by the Companies operating under the FXOpen brand, nor is it to be considered financial advice.

EUR/GBP BEARS ARE GAINING STRENGTH|SHORT
Hello, Friends!
EUR/GBP pair is trading in a local downtrend which know by looking at the previous 1W candle which is red. On the 4H timeframe the pair is going up. The pair is overbought because the price is close to the upper band of the BB indicator. So we are looking to sell the pair with the upper BB line acting as resistance. The next target is 0.873 area.
Disclosure: I am part of Trade Nation's Influencer program and receive a monthly fee for using their TradingView charts in my analysis.
✅LIKE AND COMMENT MY IDEAS✅

USD/JPY BUYERS WILL DOMINATE THE MARKET|LONG
Hello, Friends!
We are going long on the USD/JPY with the target of 155.896 level, because the pair is oversold and will soon hit the support line below. We deduced the oversold condition from the price being near to the lower BB band. However, we should use low risk here because the 1W TF is red and gives us a counter-signal.
Disclosure: I am part of Trade Nation's Influencer program and receive a monthly fee for using their TradingView charts in my analysis.
✅LIKE AND COMMENT MY IDEAS✅

GOLD LONG FROM SUPPORT
GOLD SIGNAL
Trade Direction: long
Entry Level: 4,043.86
Target Level: 4,189.14
Stop Loss: 3,946.77
RISK PROFILE
Risk level: medium
Suggested risk: 1%
Timeframe: 9h
Disclosure: I am part of Trade Nation's Influencer program and receive a monthly fee for using their TradingView charts in my analysis.
✅LIKE AND COMMENT MY IDEAS✅

EUR/AUD SELLERS WILL DOMINATE THE MARKET|SHORT
Hello, Friends!
We are going short on the EUR/AUD with the target of 1.771 level, because the pair is overbought and will soon hit the resistance line above. We deduced the overbought condition from the price being near to the upper BB band. However, we should use low risk here because the 1W TF is green and gives us a counter-signal.
Disclosure: I am part of Trade Nation's Influencer program and receive a monthly fee for using their TradingView charts in my analysis.
✅LIKE AND COMMENT MY IDEAS✅

GOLD bounces back amid Fed signals and political turmoilOANDA:XAUUSD opened the Asian trading week with strong upward momentum, reflecting rising confidence that the Federal Reserve will cut interest rates as early as December. Spot gold reached $4,256.31/oz, gaining $37 within just a few hours — the highest level in five weeks.
Shifting rate-cut expectations remain the dominant driver. A series of dovish comments from Fed officials, combined with weakening economic data following the U.S. government shutdown, has led the market to price in an 87% probability of a rate cut, according to FedWatch. As the opportunity cost of holding gold decreases, capital is rapidly flowing into non-yielding safe-haven assets.
Long-term support remains intact: accelerating purchases by central banks and significant inflows into gold ETFs helped push prices to a historical peak of $4,380/oz in October. With an almost uninterrupted rally since the start of the year, gold is on track for its strongest annual performance since 1979.
However, the monetary-policy outlook is clouded by political uncertainty. President Trump announced he had chosen a successor to Chairman Jerome Powell and asked the nominee to commit to a more aggressive rate-cutting cycle.
Kevin Hassett, a senior White House economic advisor, is now estimated by markets to have a 64% probability of being appointed — a sharp rise from last week. A more politically influenced Fed could increase volatility across asset markets.
On the geopolitical front, early signs of reconciliation between the U.S. and Ukraine have temporarily reduced safe-haven demand, but not enough to slow gold’s upward momentum. Washington’s decision to send envoy Steve Witkov to Moscow this week signals a new diplomatic phase, though risk levels remain elevated.
Today’s main focus is the ISM Manufacturing PMI. A stronger-than-expected reading may support the USD in the short term, slowing gold’s advance. Conversely, weaker data would reinforce rate-cut expectations and continue to support the metal’s upward trend.
With rapidly changing policy expectations, firm technical momentum, and persistent geopolitical risk, the gold market enters December with a clearly bullish structure — but also heightened sensitivity as the Fed and the White House reshape policy direction simultaneously.
Technical Analysis & OANDA:XAUUSD Outlook
• Trend structure: Price is maintaining a medium-term ascending channel, continuously forming higher lows and higher highs, indicating that the primary uptrend remains intact.
• Key level has been reclaimed: Price closed above the 4,128–4,216 USD resistance zone (Fib 0.236 and horizontal resistance), while also holding above the short-term MA21. This satisfies both the necessary condition (holding above support/trendline) and the sufficient condition (breaking and confirming a key resistance zone) for an uptrend cycle to be considered underway.
• Momentum indicators: RSI has recovered above the mid-range and is not yet overbought, suggesting there is still room for upside momentum.
• Technical conclusion: With a close and sustained move above 4,216 USD, the bullish structure is confirmed. The next immediate technical target is to retest the all-time high around ~4,380 USD/oz, with the next extension zone near 4,500 USD in a strong capital-inflow scenario.
SELL XAUUSD PRICE 4331 - 4329⚡️
↠↠ Stop Loss 4335
→Take Profit 1 4323
↨
→Take Profit 2 4317
BUY XAUUSD PRICE 4191 - 4193⚡️
↠↠ Stop Loss 4187
→Take Profit 1 4199
↨
→Take Profit 2 4205

EURUSD Review December 1 2025Short-term price movement ideas.
The price is still located within the daily zone of interest, where it has already taken out the previous week’s high. That high acted as a daily trigger, creating conditions for continued downside movement. After the daily sweep, we received confirmation on the 4H timeframe, which now serves as our main working zone. Inside the 4H structure, there is an hourly high that also acts as a trigger. If this hourly high gets swept and confirmed, we can then consider opening a short position with the target of taking out the current low.
Be flexible, adapt to the market, and the results will come quickly. Good luck to everyone.

USDCAD: Bullish Move After Trap 🇺🇸🇨🇦
I see a bearish trap on USDCAD after a test of a key
daily support.
A formation of a bullish CHoCH on a 4h time frame
during the Asian session today suggests a strong buying interest.
I expect a rise to 1.402
❤️Please, support my work with like, thank you!❤️
I am part of Trade Nation's Influencer program and receive a monthly fee for using their TradingView charts in my analysis.

5 Key Trading Tips for BeginnersWelcome back everyone to another post! In this article we will be explaining 5 key pointers (tips) for new individuals entering the trading space.
When it comes to trading first there is “ understanding ” before we begin the 5 keys steps. Let me assist you in understanding what will happen when you take on trading.
Trading is a challenge. Not a video game challenge, not a math test challenge – a * Challenge * One that will break you. Trading will break you mentally, physically, spiritually and financially. It is an eye-opening journey.
Trading will teach you a lot about yourself, and it will teach you a lot about discipline, patience and how you can analyze markets.
I saw a quote somewhere, it said trading: “ Trading is the hardest way, to make easy money ” and they are right.
You will be learning how to manage risk, control your emotions, understand your own decision-making patterns. These are all invaluable lessons for life, as well as trading.
Sounds great! But then there are the losses, what you lose to gain all this. Trading isn’t something that you can learn overnight – all those posts you see about a young 17-year-old “ cracking the code ” is rubbish. Why? Because they haven’t learnt life lessons.
You can make money fast, but you will lose it faster if you don’t know how to manage it.
Trading will drain every bit of energy out of you. You will feel like you’re falling behind, you will eventually collapse at every loss and become frustrated. The market will test you; the market doesn’t give a damn about you – you accept the risk when you take on trading and since you’re the one making the trades, it’s you VS you.
You’re testing yourself. You agree to test your patience, your confidence, your mindset. Doing so will make progress feel nonexistent or slow.
Every day, and every trade you will question yourself, wondering if “trading” is even for you. Sometimes it will feel like you’re going in circles. You will continue to make mistakes repeatedly. It will become exhausting but remember – only experience and your own strengths will allow you to succeed. Only those who can endure the grind without giving up will make it.
So, let’s start off the 5 key pointers that will prepare you.
1) Prioritize Risk Management Over Profits:
Most newbies focus first on “ making money ” rather than safeguarding capital. The reality is that surviving in the market is way more important than winning every trade you see or come across.
Key Points:
Determine risk per trade: A common rule is risking no more than 1-2% of your trading account on a single trade. This way even a string of losses will not wipe you out.
Always use stoploss: A defined maximum loss per trade enforces discipline and emotions to stay in check.
Position sizing: Your sizing should be proportional to what you’re willing to lose on each trade. Bigger trades amplify the losses, but they also amplify the profits.
Why it matters:
Without strong risk management, even a high win-rate strategy can fail. Protecting capital ensures you’re still in the game when opportunities arise.
2) Develop a trading plan and stick to it .
Random reactive trading is the best way to lose money. Build your plan overtime.
Key points:
Define your strategy: Building your strategy is the longest part, constant back testing and forward testing, refining and rebuilding. You’re not “switching” your strategy if you’re adding something small to it, you’re changing it if you eliminate the whole thing.
Identify your form of trades, short, mid, long term or swing trades.
Set clear rules: Don’t leave anything to chance, for example “I only enter trades if price closes above the 50ema and RSI is above 50”
Journalling trades: Ensure to journal all your trades, “How do I journal” Easy. Record the time, date, symbol, pair, what model/system you used, images, your entry, tp and exit, why and for how long you’ll have it open.
Why it matters:
Consistency is a key, it pairs with discipline, psychology and lingers with risk management. Traders who follow a disciplined system perform better than those to trade off an impulsive feeling. Other words “Gamble”
3) Master one market and one system first:
Beginners usually spread themselves too thin, trying forex, crypto, stocks and commodities all at once – Unfortunately for me I made this mistake at the start which made it very difficult! – Don’t do this. Stick to one market.
Key points:
Pick one market: Each market has its own rhythm, volatility, and liquidity. Teaching one thoroughly allows you to understand everything about it.
Focus on one system: Instead of trying every new system from you tubes or forums, master one approach and refine it onwards e.g. – you trade FVGs, Win rate is 50% once you add Fibonacci it might be e.g. 65%
Avoid information overload: Social media and trading forums are filled with conflicting advice, stick to your chosen approach and refine it. People say you need to have 12-hour trading days. If you do this, you will FAIL. You will grind yourself into the ground and face burnout making it very difficult to get back up again. Limit yourself to how much trading and trading study you do a day. Eg 10 back test trades, 3 real trades, 3 journaled trades, 1 hour of studying and researching the market.
Without strong risk management, even a high win-rate strategy can fail. Protecting capital ensures you’re still in the game when opportunities arise.
Why it matters
Depth beats breadth early on. Mastering a single market and system will allow you to build confidence and improve your edge.
4) Understand the Psychology of trading.
Trading isn’t just numbers: as mentioned in “understanding” it’s a test of emotional control, fear, greed and impatience.
Key points:
Emotions vs logic: ensure you recognize emotional reactions like FOMO (Fear of missing out) or revenge trading. Pause before reacting to a trade that will go against you.
Set realistic expectations : Markets move slowly. Sometimes for months, don’t expect huge gains overnight. Just like DCA focus on compounding. Compound your knowledge and skill set.
Mindset training: Techniques like medication and journaling as well as visualization can help reduce stress and maintain discipline.
Why it matters:
Even a diamond system can still fail if emotions drive your actions. Psychology often determines long term success, more than technical skill.
5) Prioritize learning. Then earning.
Beginners fall into the trap of trading being a “get rich quick” scheme. But the real investment is learning how the market works.
Key points:
Paper and demo trade first: Practice on demo accounts before you use real money – you will be surprised how many times you will fail. It’s better to fail with simulation money than your McDonalds weekly wage.
Review every trade: Analyze your losing trades, but also your winning trades. Find patterns and areas to improve.
Continuously educate yourself: Read books about the mind, about habits, watch market analysis but critically, apply what you learn and don’t just collect information and not use it.
Why it matters:
Earnings are just the byproduct trading. The faster you learn and adapt, the sooner your profits will appear. Treat early losses as tuition. Not failure.
Thank you all so much for reading.
I hope this benefits all those who are starting off their trading journey. If you have any questions, let me know in the comments below!

Hellena | EUR/USD (4H): SHORT to the MIN of wave "3" 1.14647.We continue to monitor the decline in downward momentum. In the last forecast the target was almost reached, but the correction turned out to be stronger than we thought, which does not cancel the forecast, but just gives us an opportunity to enter a short position once again quite favorably.
I expect that the small wave “b” is either over or almost over and the price is about to start its decline to the support area at 1.14647.
This movement should be a confirmation of the completion of the large correction (red) “ABC”.
Manage your capital correctly and competently! Only enter trades based on reliable patterns!

AUD/JPY-Supply Zone Rejection Signals Potential Bearish ReversalAUD/JPY is showing signs of weakening bullish momentum as price reacts sharply from the Strong Supply Zone at the top of the chart. This area has historically acted as a major distribution zone, and the latest rejection suggests that sellers are stepping back into control.
After forming multiple double-bottom rallies, price pushed upward but failed to sustain momentum beyond the supply ceiling. The sharp rejection indicates that liquidity has been collected from trapped buyers, and the market may now be preparing for a deeper corrective move.
The structure around the neckline and mid-buyer zone is critical. A break below this area—especially below the 100.000 level—would confirm a bearish shift. The chart already highlights a possible breakout-retest scenario, where price could break the buyer zone, retest it from below, and continue downward.
If sellers maintain pressure, the next target lies near the Support Zone around 98.500, aligned with previous range lows. A deeper move could even reach the broader Demand Zone Area, completing a full bearish correction.
Overall, the chart is signaling a potential reversal from supply, with sellers gaining strength and momentum shifting toward the downside as long as price remains below the supply zone and fails to reclaim the neckline.

Bullish momentum to extend?USD/JPY is falling towards the pivot, which has been identified as a pullback support and could bounce to the 1st resistance.
Pivot: 154.41
1st Support: 151.03
1st Resistance: 158.33
Disclaimer:
The opinions given above constitute general market commentary and do not constitute the opinion or advice of IC Markets or any form of personal or investment advice.
Any opinions, news, research, analyses, prices, other information, or links to third-party sites contained on this website are provided on an "as-is" basis, are intended to be informative only, and are not advice, a recommendation, research, a record of our trading prices, an offer of, or solicitation for, a transaction in any financial instrument and thus should not be treated as such. The information provided does not involve any specific investment objectives, financial situation, or needs of any specific person who may receive it. Please be aware that past performance is not a reliable indicator of future performance and/or results. Past performance or forward-looking scenarios based upon the reasonable beliefs of the third-party provider are not a guarantee of future performance. Actual results may differ materially from those anticipated in forward-looking or past performance statements. IC Markets makes no representation or warranty and assumes no liability as to the accuracy or completeness of the information provided, nor any loss arising from any investment based on a recommendation, forecast, or any information supplied by any third party.

Bullish continuation?Loonie (USD/CAD) is falling towards the pivot which is an overlap support and could bounce to the 1st resistance.
Pivot: 1.3916
1st Support: 1.3761
1st Resistance: 1.4264
Disclaimer:
The opinions given above constitute general market commentary and do not constitute the opinion or advice of IC Markets or any form of personal or investment advice.
Any opinions, news, research, analyses, prices, other information, or links to third-party sites contained on this website are provided on an "as-is" basis, are intended to be informative only, and are not advice, a recommendation, research, a record of our trading prices, an offer of, or solicitation for, a transaction in any financial instrument and thus should not be treated as such. The information provided does not involve any specific investment objectives, financial situation, or needs of any specific person who may receive it. Please be aware that past performance is not a reliable indicator of future performance and/or results. Past performance or forward-looking scenarios based upon the reasonable beliefs of the third-party provider are not a guarantee of future performance. Actual results may differ materially from those anticipated in forward-looking or past performance statements. IC Markets makes no representation or warranty and assumes no liability as to the accuracy or completeness of the information provided, nor any loss arising from any investment based on a recommendation, forecast, or any information supplied by any third party.

Bullish bounce off major support?Swissie (USD/CHF) is falling towards the pivot and could bounce to the pullback resistance.
Pivot: 0.7875
1st Support: 0.7720
1st Resistance: 0.8165
Disclaimer:
The opinions given above constitute general market commentary and do not constitute the opinion or advice of IC Markets or any form of personal or investment advice.
Any opinions, news, research, analyses, prices, other information, or links to third-party sites contained on this website are provided on an "as-is" basis, are intended to be informative only, and are not advice, a recommendation, research, a record of our trading prices, an offer of, or solicitation for, a transaction in any financial instrument and thus should not be treated as such. The information provided does not involve any specific investment objectives, financial situation, or needs of any specific person who may receive it. Please be aware that past performance is not a reliable indicator of future performance and/or results. Past performance or forward-looking scenarios based upon the reasonable beliefs of the third-party provider are not a guarantee of future performance. Actual results may differ materially from those anticipated in forward-looking or past performance statements. IC Markets makes no representation or warranty and assumes no liability as to the accuracy or completeness of the information provided, nor any loss arising from any investment based on a recommendation, forecast, or any information supplied by any third party.

Headnig into pullback resistance?Cable (GBP/USD) is rising towards the pivot, which acts as a pullback resistance and could reverse to the 1st support, which has been identified as an overlap support.
Pivot: 1.3290
1st Support: 1.3002
1st Resistance: 1.3459
Disclaimer:
The opinions given above constitute general market commentary and do not constitute the opinion or advice of IC Markets or any form of personal or investment advice.
Any opinions, news, research, analyses, prices, other information, or links to third-party sites contained on this website are provided on an "as-is" basis, are intended to be informative only, and are not advice, a recommendation, research, a record of our trading prices, an offer of, or solicitation for, a transaction in any financial instrument and thus should not be treated as such. The information provided does not involve any specific investment objectives, financial situation, or needs of any specific person who may receive it. Please be aware that past performance is not a reliable indicator of future performance and/or results. Past performance or forward-looking scenarios based upon the reasonable beliefs of the third-party provider are not a guarantee of future performance. Actual results may differ materially from those anticipated in forward-looking or past performance statements. IC Markets makes no representation or warranty and assumes no liability as to the accuracy or completeness of the information provided, nor any loss arising from any investment based on a recommendation, forecast, or any information supplied by any third party.

Bearish reversal?Fiber (EUR/USD) is rising towards the pivot and could reverse to the swing low support.
Pivot: 1.1654
1st Support: 1.1403
1st Resistance: 1.1807
Disclaimer:
The opinions given above constitute general market commentary and do not constitute the opinion or advice of IC Markets or any form of personal or investment advice.
Any opinions, news, research, analyses, prices, other information, or links to third-party sites contained on this website are provided on an "as-is" basis, are intended to be informative only, and are not advice, a recommendation, research, a record of our trading prices, an offer of, or solicitation for, a transaction in any financial instrument and thus should not be treated as such. The information provided does not involve any specific investment objectives, financial situation, or needs of any specific person who may receive it. Please be aware that past performance is not a reliable indicator of future performance and/or results. Past performance or forward-looking scenarios based upon the reasonable beliefs of the third-party provider are not a guarantee of future performance. Actual results may differ materially from those anticipated in forward-looking or past performance statements. IC Markets makes no representation or warranty and assumes no liability as to the accuracy or completeness of the information provided, nor any loss arising from any investment based on a recommendation, forecast, or any information supplied by any third party.

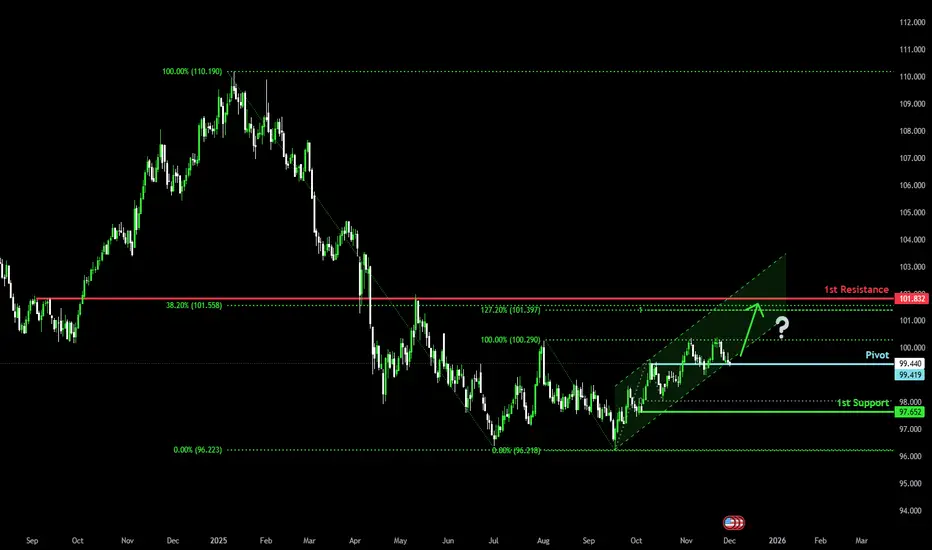
Could we see a bullish reversal?US Dollar Index (DXY) is reacting off the pivot and could bounce to the 1st resistance which lines up witht he 38.2% Fibonacci retracement.
Pivot: 99.41
1st Support: 97.65
1st Resistance: 101.83
Disclaimer:
The opinions given above constitute general market commentary and do not constitute the opinion or advice of IC Markets or any form of personal or investment advice.
Any opinions, news, research, analyses, prices, other information, or links to third-party sites contained on this website are provided on an "as-is" basis, are intended to be informative only, and are not advice, a recommendation, research, a record of our trading prices, an offer of, or solicitation for, a transaction in any financial instrument and thus should not be treated as such. The information provided does not involve any specific investment objectives, financial situation, or needs of any specific person who may receive it. Please be aware that past performance is not a reliable indicator of future performance and/or results. Past performance or forward-looking scenarios based upon the reasonable beliefs of the third-party provider are not a guarantee of future performance. Actual results may differ materially from those anticipated in forward-looking or past performance statements. IC Markets makes no representation or warranty and assumes no liability as to the accuracy or completeness of the information provided, nor any loss arising from any investment based on a recommendation, forecast, or any information supplied by any third party.
XRP outcome!XRP did a drop in the Asian session after markets opened up. Possible reversal near this zone going to the London session or a reversal at the bottom of the channel or near it.

Gold Is Loading Pressure — The Next Breakout Will Be Violent1. Market Structure Overview
Price is currently respecting a rising channel, showing a consistent sequence of higher highs – higher lows, but with gradually compressed momentum near the upper boundary and the resistance zone.
Key observations:
- Price is hovering near the upper trendline of the ascending channel.
- The resistance zone is directly above current price, causing hesitation and wicks.
- The chart shows a potential indecision → correction → continuation pattern forming.
This reflects a market preparing for a bullish continuation, but only after a controlled pullback.
2. Expected Scenarios for Today
✓ Primary Scenario – Bullish Retest Before Breakout (High Probability)
Price is likely to:
- Pull back toward the midline/lower edge of the ascending channel (yellow zone).
- Form a higher low within structure.
- Execute a clean retest of the ENTRY ZONE highlighted on your chart.
- Break above the Resistance Zone → Continue toward higher targets.
This matches your projected structure perfectly.
Entry Logic:
- Wait for price to retest the rising trendline and show bullish confirmation.
- The ENTRY ZONE is valid and aligns with trend continuation.
Upside Targets:
- TP1: 4,215–4,225
- TP2: 4,250+
- TP3 (extended): 4,280+ if the breakout is impulsive.
✓ Secondary Scenario – Compression Before Break
If price stays inside the channel and moves sideways:
- Market remains bullish but indecisive.
- This builds liquidity for a stronger breakout later.
- No selling is recommended unless structure breaks.
This scenario still favors bulls—just slower.
3. Trend Bias (Intraday)
The dominant trend is:
➡️ BULLISH – Buy the dip, do NOT chase breakouts
Signs confirming bullish bias:
- Higher lows remain intact.
- Structure respects the ascending channel perfectly.
- Resistance is tested multiple times → weakening.
- Volume spikes on bullish waves, fades on corrections.
4. Professional Conclusion
Gold remains in a strong bullish continuation structure inside the rising channel.
Your ENTRY ZONE is positioned perfectly for a high-quality retest trade.
Plan of Action:
- Wait for the pullback to the trendline.
- Confirm bullish rejection.
- Enter long within the zone.
- Target the liquidity sweep above resistance.
Smart, calculated, high-probability setup. 🔥

Falling towards key support?USD/CAD is falling towards the support level which is an overlap support that i slightly below the 38.2% Fibonacci retracement and could bounce from this level to our take profit.
Entry: 0.8006
Why we like it:
There is an overlap support that i slightly below the 38.2% Fibonacci retracement.
Stop loss: 0.7968
Why we like it:
There is a pullback support level that aligns with the 61.8% Fibonacci retracement.
Take profit: 0.8067
Why we like it:
There is a pullback resistance level.
Enjoying your TradingView experience? Review us!
Please be advised that the information presented on TradingView is provided to Vantage (‘Vantage Global Limited’, ‘we’) by a third-party provider (‘Everest Fortune Group’). Please be reminded that you are solely responsible for the trading decisions on your account. There is a very high degree of risk involved in trading. Any information and/or content is intended entirely for research, educational and informational purposes only and does not constitute investment or consultation advice or investment strategy. The information is not tailored to the investment needs of any specific person and therefore does not involve a consideration of any of the investment objectives, financial situation or needs of any viewer that may receive it. Kindly also note that past performance is not a reliable indicator of future results. Actual results may differ materially from those anticipated in forward-looking or past performance statements. We assume no liability as to the accuracy or completeness of any of the information and/or content provided herein and the Company cannot be held responsible for any omission, mistake nor for any loss or damage including without limitation to any loss of profit which may arise from reliance on any information supplied by Everest Fortune Group.

XAUUSD: Strong Growth and Buying OpportunityWith the prospect of a Fed interest rate cut and the weakening of the USD, XAUUSD is showing signs of a strong growth phase. Based on macroeconomic news and technical charts, we can see that the price of gold continues to hold steady above the uptrend line .
XAUUSD is currently pulling back to instant support at 4,120,000 USD . The uptrend is supported by the EMA (34, 89) indicators and the current upward trend. The strong support at 4,120,000 USD plays a crucial role in maintaining this upward momentum.
Short-Term Forecast:
XAUUSD could continue to rise to higher levels if it holds above 4,120,000 USD, with the next target being the TP1 level at 4,200,000 USD , and even the TP2 level at 4,250,000 USD . This is supported by market expectations that the Fed will continue to lower interest rates in December, weakening the USD and boosting demand for gold as a safe-haven asset.
Conclusion:
With a stable upward trend and support from both the market and chart indicators, XAUUSD is likely to continue its upward movement. If there is a pullback to the support level, it will provide an excellent opportunity for buying.

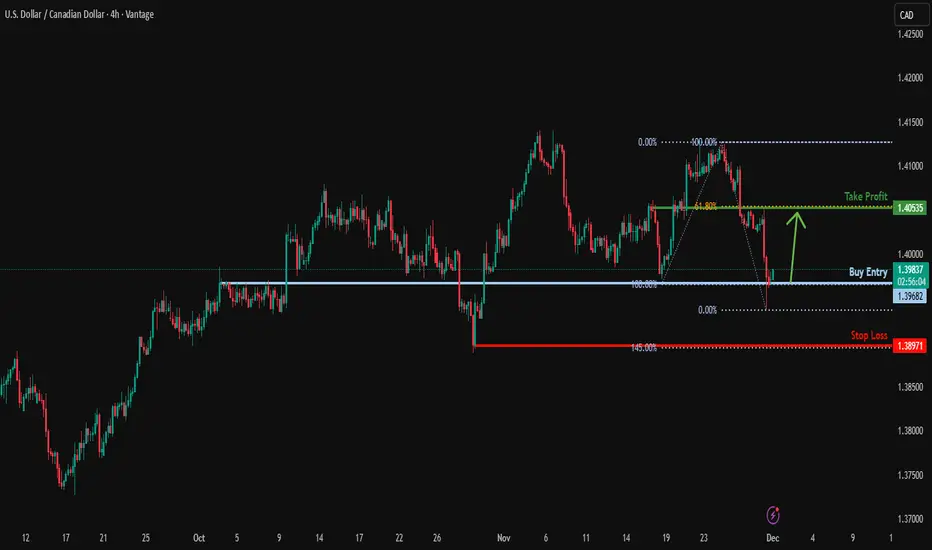
Potential bullish reversal?USD/CAD is reacting off the support level which is a pullback support and could bounce from this level to our take profit.
Entry: 1.3968
Why we like it:
There is a pullback support level.
Stop loss: 1.3897
Why we like it:
There is a swing low support level that aligns with the 145% Fibonacci extension.
Take profit: 1.4053
Why we like it:
There is a pullback resistance level that aligns with the 61.8% Fibonacci retracement.
Enjoying your TradingView experience? Review us!
Please be advised that the information presented on TradingView is provided to Vantage (‘Vantage Global Limited’, ‘we’) by a third-party provider (‘Everest Fortune Group’). Please be reminded that you are solely responsible for the trading decisions on your account. There is a very high degree of risk involved in trading. Any information and/or content is intended entirely for research, educational and informational purposes only and does not constitute investment or consultation advice or investment strategy. The information is not tailored to the investment needs of any specific person and therefore does not involve a consideration of any of the investment objectives, financial situation or needs of any viewer that may receive it. Kindly also note that past performance is not a reliable indicator of future results. Actual results may differ materially from those anticipated in forward-looking or past performance statements. We assume no liability as to the accuracy or completeness of any of the information and/or content provided herein and the Company cannot be held responsible for any omission, mistake nor for any loss or damage including without limitation to any loss of profit which may arise from reliance on any information supplied by Everest Fortune Group.