Downfall of DXY?!? Bears Flag The Possibility!Here on TVC:DXY we can see that last week it ended in a Bearish Breakout of an Ascending Channel, the perfect Bear Flag scenario!
Now price closed the week on the ascent possibly being the Retest of the Breakout.
If the Channel holds price on a successful retest, TVC:DXY will drop!
Fundamentally, USD has impactful news all week this week. Even so, with limited data from back logged events not available until after next FOMC Meeting, this means the Federal Reserve will continue to make decisions in "the dark" and with a high probability of a Rate Cut coming in December!
If the Bear Flag is successful in being a continuation pattern set-up, we could see price drop down to the prior Low of November under 99!
M-forex

Forex: Weekly Review It was very pleasing that, by and large, the week starting Monday 24 November was a 'risk on' week.
Following on from the 'WILLIAMS' comments the previous Friday, the positive mood was enhanced by some 'goldilocks' US data on Tuesday. And the 'risk on sentiment' remained for the rest of the week, briefly taking a pause during Thanksgiving. But returning for a final flourish on Friday.
Given how difficult the past few months have been, this week's 'narrative and price action' was comforting and encouraging , trading is much more straightforward when the overall mood is positive and I begin the new week continuing my bias for 'risk on' trades.
But it should be noted that it would only take some 'hot US data', or a 'hawkish comment' for the uncertainty to return. And that's without mentioning anything the BOJ or President Trump could send our way. And as ever I'll be keeping any eye on the VIX and the S&P along with keeping up to speed with the narrative.
In other news, the AUD, NZD and GBP had 'good weeks', obviously boosted by the positive environment but also their own fundamentals, 'hot' AUD CPI, a 'hawkish cut' from the RBNZ and the UK budget appeased GBP sentiment.
It's a slow process but peace in the UKRAINE creeps ever closer (EUR and GBP positive) and finally, 'hot GDP' boosted the CAD on Friday, it could well be that (similar to NZD) front loaded rare cuts are filtering through to the economy.
On a personal note, it was a week of two trades, both 'risk on' and both short USD. A EUR USD on Tuesday, post US data. And a GBP USD post UK budget. It is pleasing there could have actually been another trade or two in there. And any trade could have been any type of risk on concoction.
I unfortunately missed Friday due to (once again) out of the blue uncle John duties. Not to get too personal but I have a nephew who has down syndrome and autism and I'm happy to shoulder some if his care when it's required.
I begin the new week feeling a little more emboldened than the previous couple of months. But it is prudent to be aware that anything can happen at any moment to flip the narrative in its head.
Let's see what December brings.

EURJPY PULLBACK AHEAD|SHORT|
✅EURJPY Price is rejecting the supply zone after a sweep of highs, with a mitigation of the last bearish displacement candle pointing to bearish order flow targeting the next liquidity pocket below. Time Frame: 2H
SHORT🔥
✅Like and subscribe to never miss a new idea!✅

AUDUSD STRONG BREAKOUT|LONG|
✅ AUDUSD is breaking structure as it trades out of the demand block, signalling a continuation toward the upside liquidity pocket. With momentum shifting, the pair aims to draw toward the next clean inefficiency above before reaction. Time Frame 4H.
LONG🚀
✅Like and subscribe to never miss a new idea!✅

USD-JPY Will Grow! Buy!
Hello, Traders!
USDJPY shows price reacting around the rising trendline, with liquidity building beneath the minor swing lows. Smart Money may engineer a corrective move before a continuation toward the target level as the structure remains bullish and higher-timeframe momentum supports further expansion. Time Frame 7H.
Buy!
Comment and subscribe to help us grow!
Check out other forecasts below too!
Disclosure: I am part of Trade Nation's Influencer program and receive a monthly fee for using their TradingView charts in my analysis.

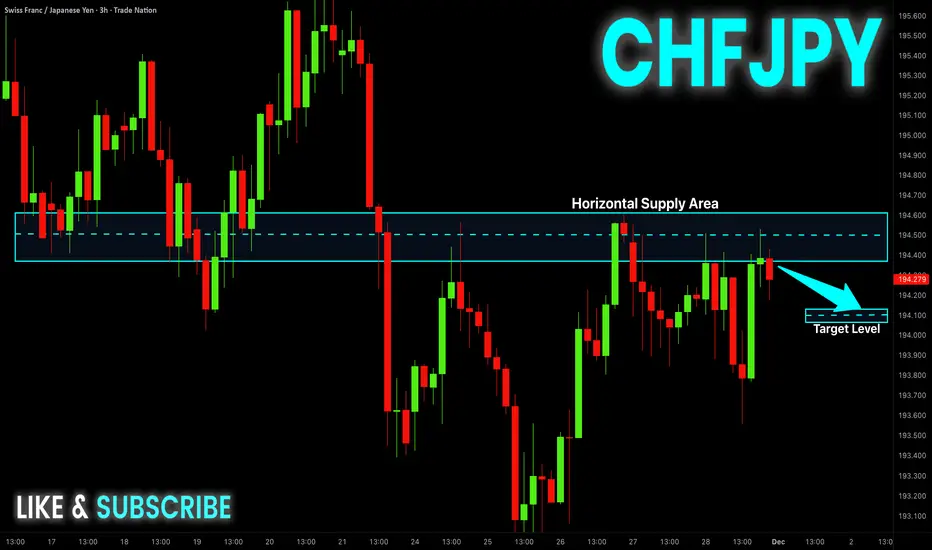
CHF-JPY Local Short! Sell!
Hello,Traders!
CHFJPY is reacting inside a major supply block after sweeping liquidity above the previous swing high. With structure shifting bearish, the pair is poised for a continuation lower toward the next downside inefficiency. Time Frame 3H.
Sell!
Comment and subscribe to help us grow!
Check out other forecasts below too!
Disclosure: I am part of Trade Nation's Influencer program and receive a monthly fee for using their TradingView charts in my analysis.
AUD-JPY Free Signal! Sell!
Hello,Traders!
AUDJPY tapped into a high-timeframe supply block and printed rejection wicks, signalling distribution after a premium sweep. With liquidity taken above the range, the setup aligns for a displacement down into the next draw-on-liquidity.
Sell!
Comment and subscribe to help us grow!
Check out other forecasts below too!
Disclosure: I am part of Trade Nation's Influencer program and receive a monthly fee for using their TradingView charts in my analysis.

The Hidden Skill Every Great Trader Masters; And It’s Not Chart!Most traders spend years perfecting chart patterns, indicators, and entries…
Yet only a handful ever master the real skill that separates professionals from the rest, the art of waiting.
📉 Anyone can draw support and resistance.
📈 But not everyone can wait for price to reach them.
The market rewards patience, not predictions.
It’s not about catching every move, it’s about being ready when your setup aligns perfectly.
That’s when you strike. That’s when probability works for you, not against you.
Think of trading like fishing 🎣:
You don’t chase the fish, you position your line where it’s most likely to bite, then you wait.
So next time you feel the urge to jump in early, remind yourself:
You’re not just a trader. You’re a waiter, paid in precision and patience.
📚 Key takeaway:
Great traders don’t predict, they prepare.
They let the market move first, then respond with clarity.
⚠️ Disclaimer: This is not financial advice. Always do your own research and manage risk properly.
All Strategies Are Good; If Managed Properly!
~Richard Nasr

EURUSD: Bearish Continuation is Expected! Here is Why:
The analysis of the EURUSD chart clearly shows us that the pair is finally about to tank due to the rising pressure from the sellers.
Disclosure: I am part of Trade Nation's Influencer program and receive a monthly fee for using their TradingView charts in my analysis.
❤️ Please, support our work with like & comment! ❤️

US100: Short Signal Explained
US100
- Classic bearish pattern
- Our team expects retracement
SUGGESTED TRADE:
Swing Trade
Sell US100
Entry - 25404
Stop - 25436
Take - 25348
Our Risk - 1%
Start protection of your profits from lower levels
Disclosure: I am part of Trade Nation's Influencer program and receive a monthly fee for using their TradingView charts in my analysis.
❤️ Please, support our work with like & comment! ❤️

QQQ: Market of Sellers
Looking at the chart of QQQ right now we are seeing some interesting price action on the lower timeframes. Thus a local move down seems to be quite likely.
Disclosure: I am part of Trade Nation's Influencer program and receive a monthly fee for using their TradingView charts in my analysis.
❤️ Please, support our work with like & comment! ❤️

USDCHF: Bullish Continuation & Long Signal
USDCHF
- Classic bullish formation
- Our team expects pullback
SUGGESTED TRADE:
Swing Trade
Long USDCHF
Entry - 0.8041
Sl - 0.8032
Tp - 0.8058
Our Risk - 1%
Start protection of your profits from lower levels
Disclosure: I am part of Trade Nation's Influencer program and receive a monthly fee for using their TradingView charts in my analysis.
❤️ Please, support our work with like & comment! ❤️

APPLE The Target Is DOWN! SELL!
My dear subscribers,
This is my opinion on the APPLE next move:
The instrument tests an important psychological level 278.82
Bias - Bearish
Technical Indicators: Supper Trend gives a precise Bearish signal, while Pivot Point HL predicts price changes and potential reversals in the market.
Target - 274.28
About Used Indicators:
On the subsequent day, trading above the pivot point is thought to indicate ongoing bullish sentiment, while trading below the pivot point indicates bearish sentiment.
Disclosure: I am part of Trade Nation's Influencer program and receive a monthly fee for using their TradingView charts in my analysis.
———————————
WISH YOU ALL LUCK

SPY Buyers In Panic! SELL!
My dear followers,
This is my opinion on the SPY next move:
The asset is approaching an important pivot point 683.34
Bias - Bearish
Safe Stop Loss - 688.64
Technical Indicators: Supper Trend generates a clear short signal while Pivot Point HL is currently determining the overall Bearish trend of the market.
Goal - 674.67
About Used Indicators:
For more efficient signals, super-trend is used in combination with other indicators like Pivot Points.
Disclosure: I am part of Trade Nation's Influencer program and receive a monthly fee for using their TradingView charts in my analysis.
———————————
WISH YOU ALL LUCK

SILVER Massive Short! SELL!
My dear friends,
Please, find my technical outlook for SILVER below:
The price is coiling around a solid key level - 56.402
Bias - Bearish
Technical Indicators: Pivot Points High anticipates a potential price reversal.
Super trend shows a clear sell, giving a perfect indicators' convergence.
Goal - 54.067
About Used Indicators:
The pivot point itself is simply the average of the high, low and closing prices from the previous trading day.
Disclosure: I am part of Trade Nation's Influencer program and receive a monthly fee for using their TradingView charts in my analysis.
———————————
WISH YOU ALL LUCK

GOLD MARKET ANALYSIS AND COMMENTARY - [Dec 01 - Dec 05]This week, international OANDA:XAUUSD prices rose from 4,040 USD/oz to 4,226 USD/oz and closed at 4,219 USD/oz.
Gold prices continued to rise this week because the market is “betting” that the FED will cut interest rates this coming December. In addition, gold demand surged in China as inventories at the Shanghai Gold Exchange (SGE) fell to their lowest level in a decade.
In reality, the slowdown in private-sector job growth and limited data from the U.S. government indicate weak economic activity and subdued inflation. This will continue to fuel expectations of a FED rate cut.
Next week, the market will receive several important data releases. On Monday, attention will be on the ISM Manufacturing PMI for November, followed by the ISM Services PMI on Wednesday, along with ADP private-sector employment data for October, which will be monitored more closely than usual due to the absence of NFP data. On Thursday, the U.S. will release weekly jobless claims, core PCE, and the preliminary University of Michigan Consumer Sentiment Survey for December.
📌Technically, on the H4 chart, the gold price has broken through the Downtrend line and is moving towards the next resistance zone around 4245. If it breaks this level, the gold price will approach the 4370-4380 zone. If it fails to break the 4245 barrier, the gold price will likely move sideways within the 4045-4245 range.
SELL XAUUSD PRICE 4276 - 4274⚡️
↠↠ Stop Loss 4280
BUY XAUUSD PRICE 4178 - 4180⚡️
↠↠ Stop Loss 4174

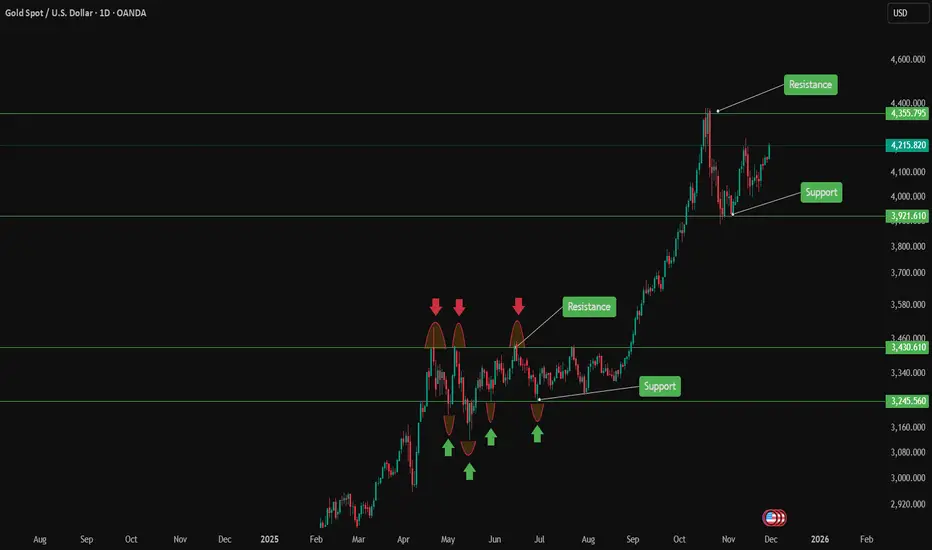
XAUUSD Sell Opportunity at ResistanceFOREXCOM:XAUUSD is now pushing into a key resistance zone, an area that has acted as a strong barrier in the past and triggered notable sell-offs. This level also aligns with a previous supply zone, where sellers once stepped in aggressively, making it a prime spot for anyone looking for potential short opportunities. With its historical importance, the way price reacts here could shape the next major move.
If bearish signals appear such as rejection wicks, bearish candlestick patterns or signs of weakening buying pressure, I expect price to drop toward the 4,230 level. However, if price breaks cleanly above this resistance, the bearish outlook may no longer hold and it can open the door for further upside momentum. This is a crucial zone where price action is likely to reveal a clearer direction.
This is just my personal view on support and resistance zones, not financial advice. Always confirm your setups and manage your risk properly.
Good luck out there!

EURUSD: Support & Resistance Analysis for Next Week 🇪🇺🇺🇸
Here is my latest structure analysis
and important supports and resistances for EURUSD
for next week.
Consider these structures for pullback/breakout trading.
❤️Please, support my work with like, thank you!❤️
I am part of Trade Nation's Influencer program and receive a monthly fee for using their TradingView charts in my analysis.

Unlock Hidden Trading Edges: Master Support & Resistance Levels Master Support & Resistance Levels – The Most Powerful Tool in Technical Analysis 📈🔥
Support and Resistance (S&R) are the foundation of price action.
Support = where price tends to stop falling (buyers step in) 🛡️
Resistance = where price tends to stop rising (sellers take control) ⚔️
These levels are not always exact, but when used correctly they give you high-probability entries and exits in Forex, Crypto, and Stocks.
How to Find Strong S&R Levels:
1-Look left → Previous swing highs & lows
The more times price has touched and bounced, the stronger the level becomes.
2-Round numbers & psychological levels
Examples: $50,000 BTC, 1.2000 EUR/USD, $200 AAPL – traders love these!
3-Use TradingView tools
Horizontal Line
Fibonacci Retracement (38.2%, 50%, 61.8%)
Volume Profile (High-volume nodes often act as S&R)
2Role Reversal – The Magic Trick ✨
Broken resistance → becomes new support
Broken support → becomes new resistance
This is where the big moves start!
Real Examples Right Now:
Bitcoin → $100,000 break support → now strong resistance
Pro Tips:
Always check multiple timeframes (Daily + 4H give the strongest levels)
Combine with RSI or volume for confirmation
Place stop-loss just below support / above resistance
When a level breaks with high volume → jump on the breakout!
Start drawing your S&R levels today and watch your win rate improve instantly.
Which market are you trading right now? Drop your favorite S&R level in the comments! 👇
XAUUSD: Channel Push Points to $4,220 as Next TargetHello everyone, here is my breakdown of the current Gold setup.
Market Analysis
Gold remains in a broader bullish structure, but the recent price action is developing inside a well-defined ascending channel, where price is currently moving from the lower boundary toward the upper one. After a sharp correction, XAUUSD found strong support at the $4,040 level, which aligns with the bottom of the channel and produced a fake breakout, signaling lack of bearish continuation.
Currently, price has started a new upward swing, respecting both the channel structure and the mid-line trend dynamics. However, despite the recovery, XAUUSD is still trading below the major $4,220 resistance, which previously acted as a strong reaction zone and remains the key obstacle for buyers.
My Scenario & Strategy
My scenario is bullish, as long as price stays above the support zone around $4,040 and maintains structure inside the ascending channel. I expect Gold to continue climbing toward the $4,220 resistance, where the upper channel boundary also converges, forming a strong confluence area.
Therefore, a clean breakout above $4,220 would open the way for higher targets and continuation of the broader trend. However, if price reaches this zone and shows strong rejection or weakness, we may see a pullback into the channel — but the bullish structure remains intact as long as the lower boundary holds. For now, the market supports a long bias, with the key objective being a retest of the $4,220 resistance zone, which is the next major level buyers are aiming for.
That's the setup I'm tracking. Thank you for your attention, and always manage your risk.

NG1! SENDS CLEAR BEARISH SIGNALS|SHORT
NG1! SIGNAL
Trade Direction: short
Entry Level: 4.849
Target Level: 4.149
Stop Loss: 5.315
RISK PROFILE
Risk level: medium
Suggested risk: 1%
Timeframe: 1D
Disclosure: I am part of Trade Nation's Influencer program and receive a monthly fee for using their TradingView charts in my analysis.
✅LIKE AND COMMENT MY IDEAS✅

AUD/USD BEARS ARE GAINING STRENGTH|SHORT
Hello, Friends!
We are now examining the AUD/USD pair and we can see that the pair is going up locally while also being in a uptrend on the 1W TF. But there is also a powerful signal from the BB upper band being nearby, indicating that the pair is overbought so we can go short from the resistance line above and a target at 0.649 level.
Disclosure: I am part of Trade Nation's Influencer program and receive a monthly fee for using their TradingView charts in my analysis.
✅LIKE AND COMMENT MY IDEAS✅

SILVER Will Move Higher! Long!
Please, check our technical outlook for SILVER.
Time Frame: 1D
Current Trend: Bullish
Sentiment: Oversold (based on 7-period RSI)
Forecast: Bullish
The market is trading around a solid horizontal structure 5,642.3.
The above observations make me that the market will inevitably achieve 6,175.7 level.
P.S
Overbought describes a period of time where there has been a significant and consistent upward move in price over a period of time without much pullback.
Like and subscribe and comment my ideas if you enjoy them!
