AUDUSD H4 | Bearish Reversal Off 61.8% Fibonacci ResistanceMomentum: Bearish
The price is rising toward the sell entry, which aligns with the 61.8% Fibonacci retracement.
Sell entry: 0.6516
Strong overlap resistance
61.8% Fibonacci retracement
Stop loss: 0.6537
Pullback resistance
Slightly below the 78.6% Fibonacci retracement.
Take profit: 0.6465
Overlap support
High Risk Investment Warning
Stratos Markets Limited (tradu.com ), Stratos Europe Ltd (tradu.com ):
CFDs are complex instruments and come with a high risk of losing money rapidly due to leverage. 70% of retail investor accounts lose money when trading CFDs with this provider. You should consider whether you understand how CFDs work and whether you can afford to take the high risk of losing your money.
Stratos Global LLC (tradu.com ): Losses can exceed deposits.
Please be advised that the information presented on TradingView is provided to Tradu (‘Company’, ‘we’) by a third-party provider (‘TFA Global Pte Ltd’). Please be reminded that you are solely responsible for the trading decisions on your account. Any information and/or content is intended entirely for research, educational and informational purposes only and does not constitute investment or consultation advice or investment strategy. The information is not tailored to the investment needs of any specific person and therefore does not involve a consideration of any of the investment objectives, financial situation or needs of any viewer that may receive it. Past performance is not a reliable indicator of future results. Actual results may differ materially from those anticipated in forward-looking or past performance statements. We assume no liability as to the accuracy or completeness of any of the information and/or content provided herein and the Company cannot be held responsible for any omission, mistake nor for any loss or damage including without limitation to any loss of profit which may arise from reliance on any information supplied by TFA Global Pte Ltd.
M-forex

XAUUSD continues to rise after the Adam & Eve patternOANDA:XAUUSD is really interesting right now. The price seems likely to rise further after the formation of the Adam & Eve pattern. With such an easy-to-remember name, the Adam & Eve pattern is one of the most memorable. I will explain below the reasons and how to recognize it easily.
The Adam pattern is characterized by a sharp drop, followed by a quick recovery, forming a "V" on the chart. High, sharp, and aggressive! One could say it's more "masculine."
On the other hand, the Eve pattern develops more slowly. The price becomes more rounded, forming a wider and smoother base before rising again, creating a shape similar to the letter "U." Softer, more curved, and more "feminine."
Combining these two elements gives us the Adam & Eve pattern, which often signals a potential trend reversal. Especially when accompanied by fundamental analysis or other strong technical indicators.
This pattern will stick in your mind when you connect its shapes to the male and female aspects. A pattern that is truly hard to forget.

GBP/JPY: Mild Growth in the Short TermGBP/JPY is currently showing a mild uptrend, supported by both macroeconomic and technical factors. With expectations that the Fed will lower interest rates in the near future, the low-interest-rate environment is helping GBP strengthen against JPY. The Japanese yen remains weak due to BoJ's easing policy , providing an opportunity for GBP/JPY to continue its upward move.
On the H4 chart, GBP/JPY is following a steady uptrend, supported by a solid trendline. The Ichimoku cloud also supports this trend, with the price consistently staying above the cloud , reinforcing the upward momentum.
In the short term, if 205.50 holds, GBP/JPY could continue to target the 206.20–206.40 range. However, the strong resistance at 208.00 should be monitored if the price continues its upward move.
In summary, the mild uptrend is expected to persist in the short term, with opportunities to buy on slight corrections , but it's important to pay attention to key support and resistance levels.

AUDJPY FREE SIGNAL|SHORT|
✅AUDJPY price swept the upper supply wick and tapped into a premium zone, triggering a clean bearish displacement. A corrective pullback into the breaker block is expected before continuation lower.
———————————
Entry: 102.29
Stop Loss: 102.49
Take Profit: 102.01
Time Frame: 2H
———————————
SHORT🔥
✅Like and subscribe to never miss a new idea!✅

GBP-NZD Free Signal! Sell!
Hello, Traders!
GBPNZD has executed a clean bearish breakout beneath the horizontal supply area, shifting order-flow decisively to the downside. The recent liquidity sweep above the structure acted as distribution, and price is now delivering into discount levels with bearish momentum.
--------------------
Stop Loss: 2.3145
Take Profit: 2.3026
Entry: 2.3097
Time Frame: 2H
--------------------
Sell!
Comment and subscribe to help us grow!
Check out other forecasts below too!
Disclosure: I am part of Trade Nation's Influencer program and receive a monthly fee for using their TradingView charts in my analysis.

EUR-JPY Bearish Bias! Sell!
Hello,Traders!
EURJPY is reacting inside a major H2 supply block after sweeping short-term liquidity, signalling distribution and a probable displacement lower toward inefficiencies below. Time Frame 2H.
Sell!
Comment and subscribe to help us grow!
Check out other forecasts below too!
Disclosure: I am part of Trade Nation's Influencer program and receive a monthly fee for using their TradingView charts in my analysis.

THE BEST TRADE IN 2025, CLEANEST PA I'VE EVER SEEN! NZDUSD!!Not gonna lie , this is the cleanest Structure i've seen and probably cleanest reversal on daily time frame in discount. So now only what i have to do is wait till pull back in daily FVG and discount and open long position till end of the year.
All information on the chart
Follow me for more interesting ideas and updates

EURNZD BEARISH BREAKOUT|SHORT|
✅EURNZD has broken down from the supply level and is now trading in a discount leg, with liquidity resting below recent equal lows. As long as order flow stays bearish, the draw remains toward the target zone. Time Frame 7H.
SHORT🔥
✅Like and subscribe to never miss a new idea!✅

SILVER: Forecast & Trading Plan
Remember that we can not, and should not impose our will on the market but rather listen to its whims and make profit by following it. And thus shall be done today on the SILVER pair which is likely to be pushed down by the bears so we will sell!
Disclosure: I am part of Trade Nation's Influencer program and receive a monthly fee for using their TradingView charts in my analysis.
❤️ Please, support our work with like & comment! ❤️

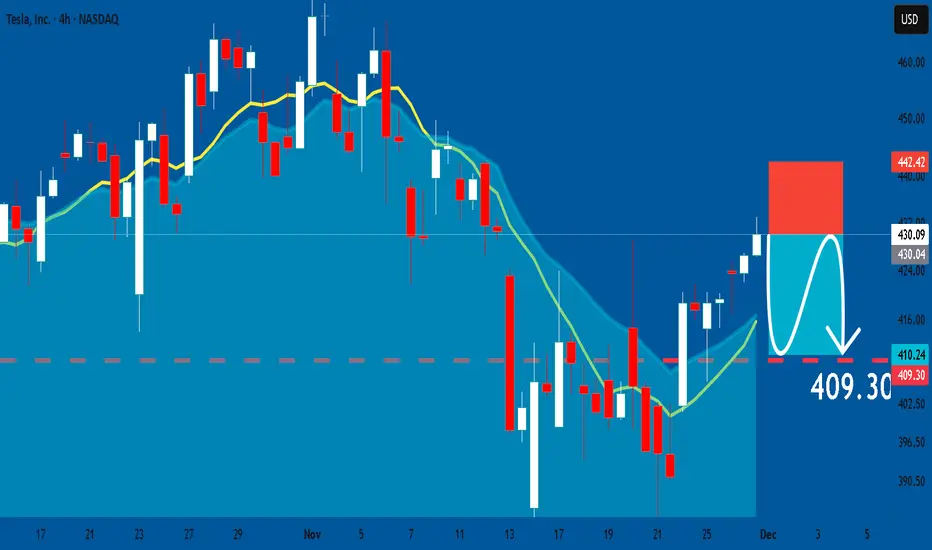
TESLA: Short Signal with Entry/SL/TP
TESLA
- Classic bearish setup
- Our team expects bearish continuation
SUGGESTED TRADE:
Swing Trade
Short TESLA
Entry Point - 430.09
Stop Loss - 442.42
Take Profit - 409.30
Our Risk - 1%
Start protection of your profits from lower levels
Disclosure: I am part of Trade Nation's Influencer program and receive a monthly fee for using their TradingView charts in my analysis.
❤️ Please, support our work with like & comment! ❤️
SPY: Will Keep Falling! Here is Why:
Balance of buyers and sellers on the SPY pair, that is best felt when all the timeframes are analyzed properly is shifting in favor of the sellers, therefore is it only natural that we go short on the pair.
Disclosure: I am part of Trade Nation's Influencer program and receive a monthly fee for using their TradingView charts in my analysis.
❤️ Please, support our work with like & comment! ❤️

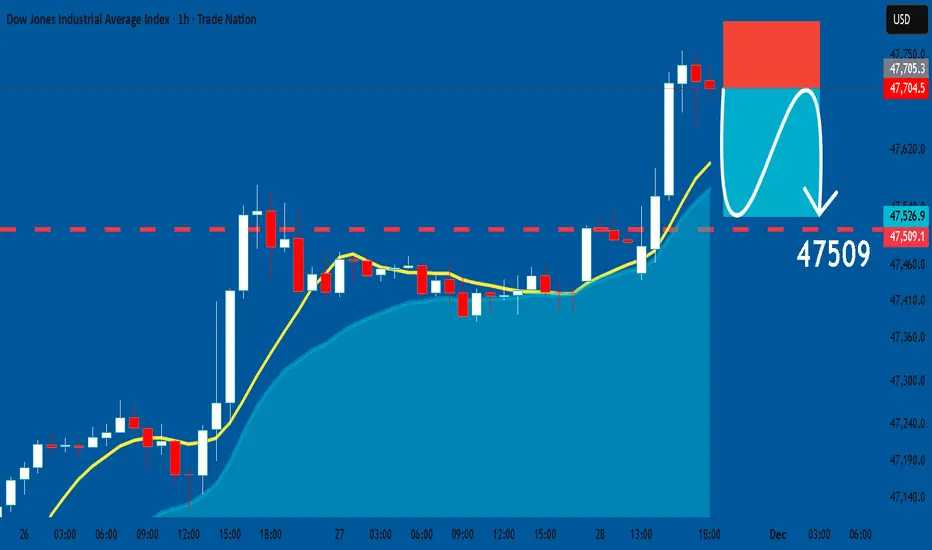
US30: Short Trade with Entry/SL/TP
US30
- Classic bearish formation
- Our team expects fall
SUGGESTED TRADE:
Swing Trade
Sell US30
Entry Level - 47705
Sl - 47798
Tp - 47509
Our Risk - 1%
Start protection of your profits from lower levels
Disclosure: I am part of Trade Nation's Influencer program and receive a monthly fee for using their TradingView charts in my analysis.
❤️ Please, support our work with like & comment! ❤️
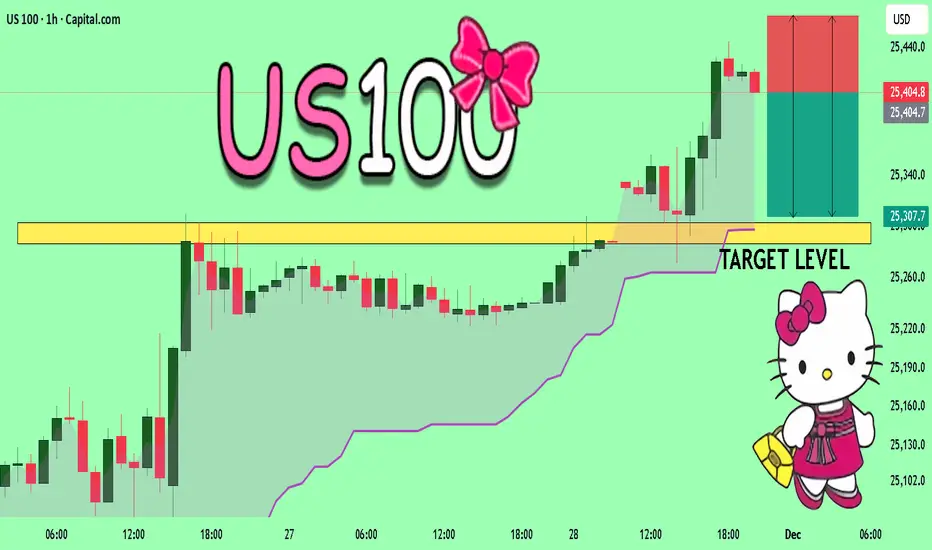
US100 Technical Analysis! SELL!
My dear followers,
I analysed this chart on US100 and concluded the following:
The market is trading on 25404 pivot level.
Bias - Bearish
Technical Indicators: Both Super Trend & Pivot HL indicate a highly probable Bearish continuation.
Target - 25303
Safe Stop Loss - 25465
About Used Indicators:
A super-trend indicator is plotted on either above or below the closing price to signal a buy or sell. The indicator changes color, based on whether or not you should be buying. If the super-trend indicator moves below the closing price, the indicator turns green, and it signals an entry point or points to buy.
Disclosure: I am part of Trade Nation's Influencer program and receive a monthly fee for using their TradingView charts in my analysis.
———————————
WISH YOU ALL LUCK
EURUSD A Fall Expected! SELL!
My dear subscribers,
EURUSD looks like it will make a good move, and here are the details:
The market is trading on 1.1596 pivot level.
Bias - Bearish
Technical Indicators: Both Super Trend & Pivot HL indicate a highly probable Bearish continuation.
Target - 1.1559
About Used Indicators:
The average true range (ATR) plays an important role in 'Supertrend' as the indicator uses ATR to calculate its value. The ATR indicator signals the degree of price volatility.
Disclosure: I am part of Trade Nation's Influencer program and receive a monthly fee for using their TradingView charts in my analysis.
———————————
WISH YOU ALL LUCK

QQQ Trading Opportunity! SELL!
My dear friends,
QQQlooks like it will make a good move, and here are the details:
The market is trading on 619.15 pivot level.
Bias - Bearish
Technical Indicators: Supper Trend generates a clear short signal while Pivot Point HL is currently determining the overall Bearish trend of the market.
Goal - 609.75
Recommended Stop Loss - 623.82
About Used Indicators:
Pivot points are a great way to identify areas of support and resistance, but they work best when combined with other kinds of technical analysis
Disclosure: I am part of Trade Nation's Influencer program and receive a monthly fee for using their TradingView charts in my analysis.
———————————
WISH YOU ALL LUCK

USDJPY BULLISH BIAS|LONG|
✅USDJPY is respecting the rising trendline as discount arrays continue to hold, suggesting a bullish continuation toward the next liquidity pocket above. With structure still shifting upward, the draw remains at the target zone. Time Frame 7H.
LONG🚀
✅Like and subscribe to never miss a new idea!✅

AUD-USD Bullish Breakout! Buy!
Hello,Traders!
AUDUSD broke the descending trendline after a liquidity grab beneath the recent swing low, shifting structure bullish. With demand now holding, price is likely to revisit the upside target as liquidity draws higher. Time Frame 5H.
Buy!
Comment and subscribe to help us grow!
Check out other forecasts below too!
Disclosure: I am part of Trade Nation's Influencer program and receive a monthly fee for using their TradingView charts in my analysis.

XAU/USD: Strong Uptrend, Ready to Break to New HighsHello traders! Today, we’ll analyze gold (XAU/USD), which is currently in a strong uptrend, and explore opportunities to capitalize on this momentum.
The latest news shows that gold has surged on November 26th, with the market anticipating that the Federal Reserve (Fed) might cut interest rates in December. Spot gold reached its highest level since mid-November, touching 4,170 USD/ounce. Factors such as mixed economic data from the U.S ., concerns about the labor market , and weakening consumer confidence have created a positive sentiment for gold.
From a technical analysis standpoint, the chart shows that XAU/USD is moving in a clear ascending wedge . The current price is near the support zone at 4,130 USD, with the potential for the uptrend to continue towards 4,240 USD if the price maintains its bullish momentum. Indicators like EMA 34 and EMA 89 both support the upward trend, reinforcing the potential for new highs.
Trading Strategy: Buy when the price adjusts to 4,130 USD and shows signs of reversal. The target for the uptrend could be 4,240 USD, and if the price breaks this level, we can expect gold to move towards 4,300 USD. A stop-loss can be placed around 4,120 USD to protect the account.
With positive market trends and technical support, gold is likely to continue its upward momentum in the near future. Stay updated and take advantage of this opportunity!

EUR/USD Daily Chart Analysis For Week of Nov 28, 2025Technical Analysis and Outlook:
In the most recent trading session, the Eurodollar currency posted a significant upsurge, marked by substantial price movements that pushed it past the Mean Resistance levels at 1.155 and 1.159, respectively.
Current market analysis suggests that the price action is poised for a retest of the critical Mean Resistance at 1.163, with the possibility of extending towards the additional Mean Resistance at 1.169.
Moreover, it is essential to monitor the breakout thresholds for this currency, with particular attention to the Mean Resistance of 1.163 on the upside and the Mean Support at 1.151 on the downside. There is also a potential scenario in which the price action may retest the Outer Currency Dip at 1.148, with the likelihood of a further extension to the subsequent Outer Currency Dip at 1.139.

EURAUD: Bearish Outlook Explained 🇪🇺🇦🇺
There is a high chance that EURAUD will continue falling next week.
A bearish breakout of a support line of a rising wedge pattern
suggests a strong bearish sentiment.
Expect a fall at least to 1.765
❤️Please, support my work with like, thank you!❤️
I am part of Trade Nation's Influencer program and receive a monthly fee for using their TradingView charts in my analysis.

AAPL SELLERS WILL DOMINATE THE MARKET|SHORT
AAPL SIGNAL
Trade Direction: short
Entry Level: 278.86
Target Level: 262.87
Stop Loss: 289.53
RISK PROFILE
Risk level: medium
Suggested risk: 1%
Timeframe: 6h
Disclosure: I am part of Trade Nation's Influencer program and receive a monthly fee for using their TradingView charts in my analysis.
✅LIKE AND COMMENT MY IDEAS✅

NZD/USD BEARISH BIAS RIGHT NOW| SHORT
Hello, Friends!
The BB upper band is nearby so NZD-USD is in the overbought territory. Thus, despite the uptrend on the 1W timeframe I think that we will see a bearish reaction from the resistance line above and a move down towards the target at around 0.554.
Disclosure: I am part of Trade Nation's Influencer program and receive a monthly fee for using their TradingView charts in my analysis.
✅LIKE AND COMMENT MY IDEAS✅

GBP/USD idea heading into next week.Clean example of how we use Fibonacci to project our TP1 TP2 areas when price is moving in a clear trend.
✓ Pullback aligns with structure support
✓ TP areas are mapped out using math not guess work
✓ Extensions give precision on each target
✓ Trend flow stays intact while buyers push through levels
Lets keep an eye on GBP next week for pullback buys or a break higher.
