EURGBP Aiming For 2023 Highs Or 2024 Lows?!?Here on OANDA:EURGBP , Price has been ranging relatively closely for the past couple months which seems to have begun to form an Ascending Triangle underneath a potentially strong Resistance Zone that formed Fall of 2023!
Now Ascending Triangles, over time, continue to rise Price into an area of Resistance until which that zone can no longer hold the Buying Pressure building up underneath and leads to a Bullish Breakout of the Horizontal Resistance zone.
Once Validated, this Price Action can lead to Long Opportunities as a Breakout and Retest of that Resistance Zone to which traders will want to see if it turns Support!
Statistics also show that Triangle Patterns tend to fail 1/3 of the time, so we must also consider the possibility that the Selling Pressure that could be at the Horizontal Resistance Zone helping form the Ascending Triangle, could overcome Bulls, creating a False Breakout and push Price down using the Rising Support of the Ascending Triangle as a potential Shorting Opportunity.
Now both Scenarios have Price Targets at the next levels of Resistance or Support depending upon which way we get a Breakout!
**Waiting for a Valid Breakout of a pattern can raise the success rate immensely! Patience Pays.
M-forex

CADJPY FREE SIGNAL|SHORT|
✅CADJPY has tapped into a premium supply zone after sweeping liquidity above previous highs. Smart money shows distribution signs with bearish displacement underway — targeting inefficiency below.
—————————
Entry: 109.230
Stop Loss: 109.610
Take Profit: 108.600
Time Frame: 2H
—————————
SHORT🔥
✅Like and subscribe to never miss a new idea!✅

EUR-JPY Free Signal! Sell!
Hello,Traders!
EURJPY SMC based signal. Price has reacted sharply from a premium supply zone, forming a bearish displacement and potential CHoCH on lower timeframes. Expecting a move into discount levels as liquidity below the recent equal lows gets targeted.
-------------------
Stop Loss: 177.959
Take Profit: 177.510
Entry: 177.744
Time Frame: 3H
-------------------
Sell!
Comment and subscribe to help us grow!
Check out other forecasts below too!
Disclosure: I am part of Trade Nation's Influencer program and receive a monthly fee for using their TradingView charts in my analysis.

APPLE: Price Action & Swing Analysis
The recent price action on the APPLE pair was keeping me on the fence, however, my bias is slowly but surely changing into the bearish one and I think we will see the price go down.
Disclosure: I am part of Trade Nation's Influencer program and receive a monthly fee for using their TradingView charts in my analysis.
❤️ Please, support our work with like & comment! ❤️

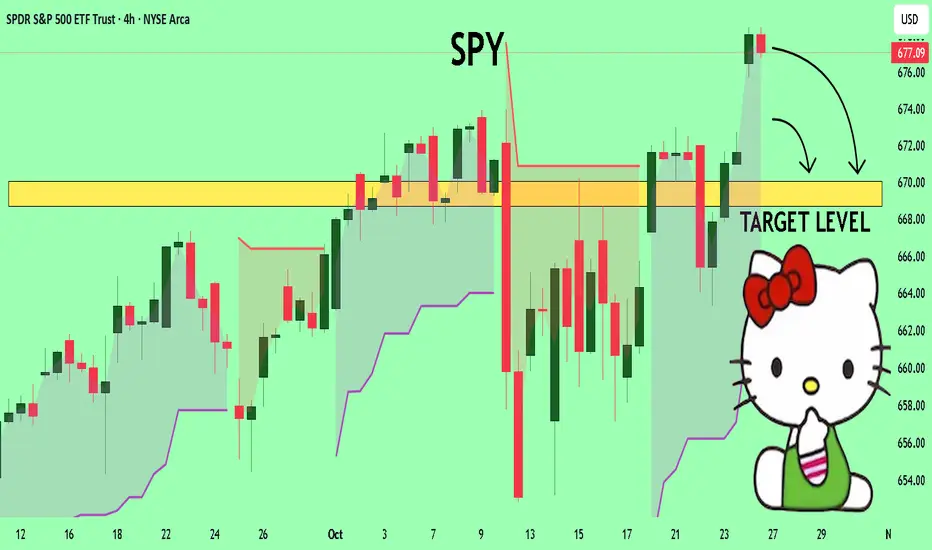
SPY The Target Is DOWN! SELL!
My dear friends,
SPY looks like it will make a good move, and here are the details:
The market is trading on 677.09 pivot level.
Bias - Bearish
Technical Indicators: Supper Trend generates a clear short signal while Pivot Point HL is currently determining the overall Bearish trend of the market.
Goal - 670.03
About Used Indicators:
Pivot points are a great way to identify areas of support and resistance, but they work best when combined with other kinds of technical analysis
Disclosure: I am part of Trade Nation's Influencer program and receive a monthly fee for using their TradingView charts in my analysis.
———————————
WISH YOU ALL LUCK
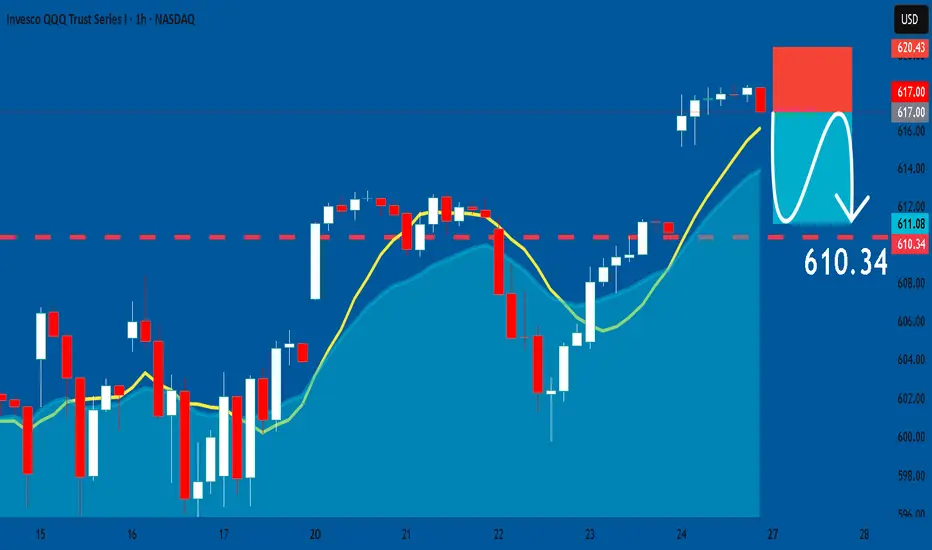
QQQ: Short Trading Opportunity
QQQ
- Classic bearish formation
- Our team expects fall
SUGGESTED TRADE:
Swing Trade
Sell QQQ
Entry Level - 617.00
Sl -620.43
Tp - 610.34
Our Risk - 1%
Start protection of your profits from lower levels
Disclosure: I am part of Trade Nation's Influencer program and receive a monthly fee for using their TradingView charts in my analysis.
❤️ Please, support our work with like & comment! ❤️
EURUSD: Weak Market & Bearish Continuation
It is essential that we apply multitimeframe technical analysis and there is no better example of why that is the case than the current EURUSD chart which, if analyzed properly, clearly points in the downward direction.
Disclosure: I am part of Trade Nation's Influencer program and receive a monthly fee for using their TradingView charts in my analysis.
❤️ Please, support our work with like & comment! ❤️

NATGAS: Short Trade Explained
NATGAS
- Classic bearish formation
- Our team expects pullback
SUGGESTED TRADE:
Swing Trade
Short NATGAS
Entry - 3.337
Sl - 3.372
Tp - 3.272
Our Risk - 1%
Start protection of your profits from lower levels
Disclosure: I am part of Trade Nation's Influencer program and receive a monthly fee for using their TradingView charts in my analysis.
❤️ Please, support our work with like & comment! ❤️

TESLA On The Rise! BUY!
My dear followers,
This is my opinion on the TESLA next move:
The asset is approaching an important pivot point 433.50
Bias - Bullish
Safe Stop Loss - 429.07
Technical Indicators: Supper Trend generates a clear long signal while Pivot Point HL is currently determining the overall Bullish trend of the market.
Goal -440.74
About Used Indicators:
For more efficient signals, super-trend is used in combination with other indicators like Pivot Points.
Disclosure: I am part of Trade Nation's Influencer program and receive a monthly fee for using their TradingView charts in my analysis.
———————————
WISH YOU ALL LUCK

USOIL Buyers In Panic! SELL!
My dear subscribers,
This is my opinion on the USOIL next move:
The instrument tests an important psychological level 61.43
Bias - Bearish
Technical Indicators: Supper Trend gives a precise Bearish signal, while Pivot Point HL predicts price changes and potential reversals in the market.
Target - 59.88
About Used Indicators:
On the subsequent day, trading above the pivot point is thought to indicate ongoing bullish sentiment, while trading below the pivot point indicates bearish sentiment.
Disclosure: I am part of Trade Nation's Influencer program and receive a monthly fee for using their TradingView charts in my analysis.
———————————
WISH YOU ALL LUCK

US30 Massive Short! SELL!
My dear friends,
Please, find my technical outlook for US30 below:
The instrument tests an important psychological level 47206
Bias - Bearish
Technical Indicators: Supper Trend gives a precise Bearish signal, while Pivot Point HL predicts price changes and potential reversals in the market.
Target - 46982
Recommended Stop Loss - 47329
About Used Indicators:
Super-trend indicator is more useful in trending markets where there are clear uptrends and downtrends in price.
Disclosure: I am part of Trade Nation's Influencer program and receive a monthly fee for using their TradingView charts in my analysis.
———————————
WISH YOU ALL LUCK

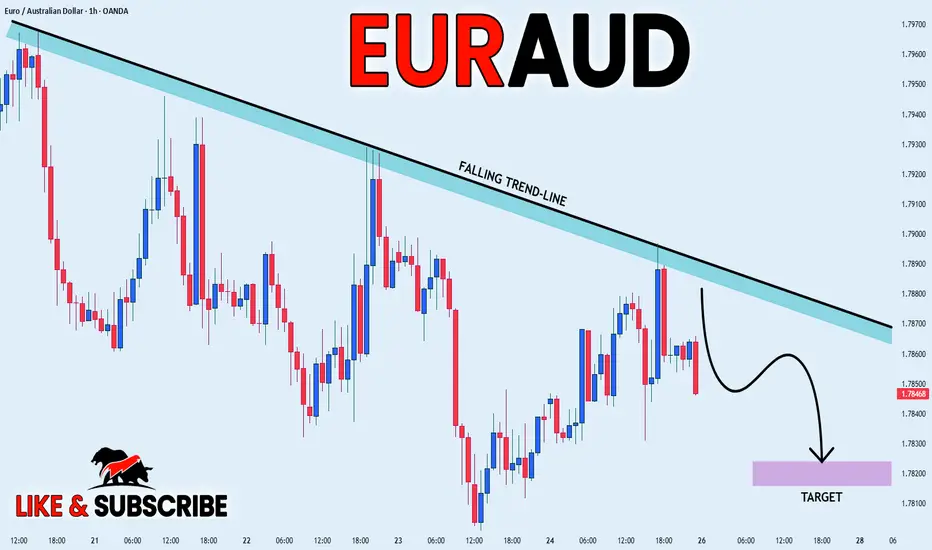
EURAUD WILL GO DOWN|SHORT|
✅EURAUD is respecting the falling trendline, showing rejection from premium levels. Liquidity has been collected above the recent swing, suggesting smart money may aim for the downside to rebalance inefficiency toward the target zone. Time Frame 2H.
SHORT🔥
✅Like and subscribe to never miss a new idea!✅
EUR-CHF Free Signal! Sell!
Hello,Traders!
EURCHF SMC based signal. Price tapped into a key supply zone, showing clear rejection with wicks and momentum shift to the downside. Expecting a short-term retracement toward the target zone below.
-------------------
Stop Loss: 0.9259
Take Profit: 0.9243
Entry: 0.9252
Time Frame: 3H
-------------------
Sell!
Comment and subscribe to help us grow!
Check out other forecasts below too!
Disclosure: I am part of Trade Nation's Influencer program and receive a monthly fee for using their TradingView charts in my analysis.

Wall Street Weekly Outlook - Week 44 2025 [27.10.- 31.10.2025]Wall Street Weekly Outlook – Week 44, 2025 📊💥
Let’s dive into another exciting trading week! 🚀
Rate decisions, month-end flows, and fresh quarterly earnings are setting the stage for strong market moves.
Sit back, enjoy the overview, and dive into the world of banks, hedge funds, and institutional flows — with exclusive insights into how the pros are positioning right now. 🧠💼📈
Extra Lessons: Strategies, setups, and market psychology — everything you need to know for the week ahead. ⚡️
**S&P500 Performance after FED rate cuts**
**Overview: The most important events of the week**
Have a great start to the trading week!
Meikel

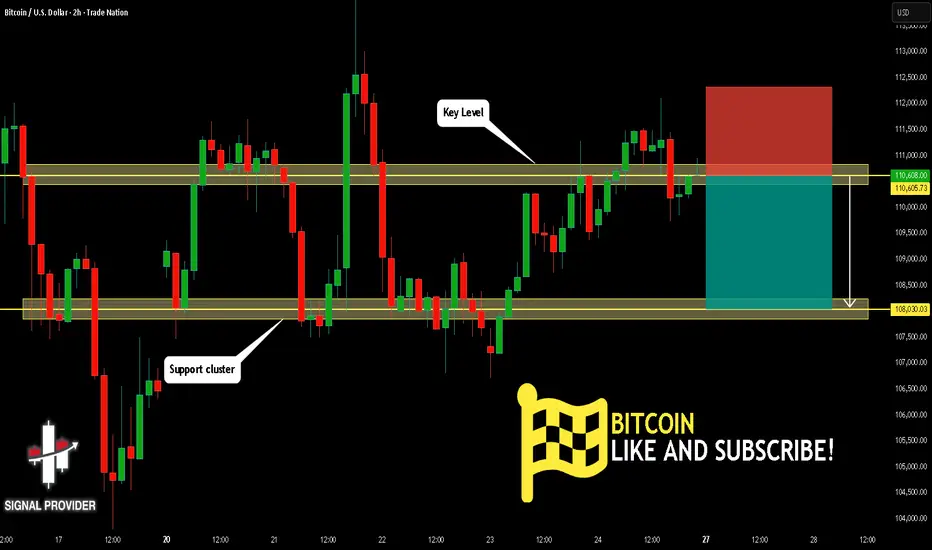
BITCOIN Will Go Lower! Sell!
Here is our detailed technical review for BITCOIN.
Time Frame: 2h
Current Trend: Bearish
Sentiment: Overbought (based on 7-period RSI)
Forecast: Bearish
The market is testing a major horizontal structure 110,605.73.
Taking into consideration the structure & trend analysis, I believe that the market will reach 108,030.03 level soon.
P.S
We determine oversold/overbought condition with RSI indicator.
When it drops below 30 - the market is considered to be oversold.
When it bounces above 70 - the market is considered to be overbought.
Like and subscribe and comment my ideas if you enjoy them!
CADJPY Will Go Up! Buy!
Take a look at our analysis for CADJPY.
Time Frame: 1D
Current Trend: Bullish
Sentiment: Oversold (based on 7-period RSI)
Forecast: Bullish
The market is approaching a key horizontal level 109.219.
Considering the today's price action, probabilities will be high to see a movement to 111.127.
P.S
Overbought describes a period of time where there has been a significant and consistent upward move in price over a period of time without much pullback.
Like and subscribe and comment my ideas if you enjoy them!

GBPJPY Will Move Higher! Long!
Please, check our technical outlook for GBPJPY.
Time Frame: 1D
Current Trend: Bullish
Sentiment: Oversold (based on 7-period RSI)
Forecast: Bullish
The market is approaching a significant support area 203.425.
The underlined horizontal cluster clearly indicates a highly probable bullish movement with target 206.227 level.
P.S
Please, note that an oversold/overbought condition can last for a long time, and therefore being oversold/overbought doesn't mean a price rally will come soon, or at all.
Like and subscribe and comment my ideas if you enjoy them!

USOIL SENDS CLEAR BEARISH SIGNALS|SHORT
USOIL SIGNAL
Trade Direction: short
Entry Level: 61.42
Target Level: 58.17
Stop Loss: 63.58
RISK PROFILE
Risk level: medium
Suggested risk: 1%
Timeframe: 6h
Disclosure: I am part of Trade Nation's Influencer program and receive a monthly fee for using their TradingView charts in my analysis.
✅LIKE AND COMMENT MY IDEAS✅

EUR/GBP BEARS ARE GAINING STRENGTH|SHORT
Hello, Friends!
EUR/GBP is trending down which is evident from the red colour of the previous weekly candle. However, the price has locally surged into the overbought territory. Which can be told from its proximity to the BB upper band. Which presents a great trend following opportunity for a short trade from the resistance line above towards the demand level of 0.869.
Disclosure: I am part of Trade Nation's Influencer program and receive a monthly fee for using their TradingView charts in my analysis.
✅LIKE AND COMMENT MY IDEAS✅

USD/JPY SELLERS WILL DOMINATE THE MARKET|SHORT
Hello, Friends!
USD/JPY pair is in the uptrend because previous week’s candle is green, while the price is clearly rising on the 8H timeframe. And after the retest of the resistance line above I believe we will see a move down towards the target below at 151.123 because the pair overbought due to its proximity to the upper BB band and a bearish correction is likely.
Disclosure: I am part of Trade Nation's Influencer program and receive a monthly fee for using their TradingView charts in my analysis.
✅LIKE AND COMMENT MY IDEAS✅

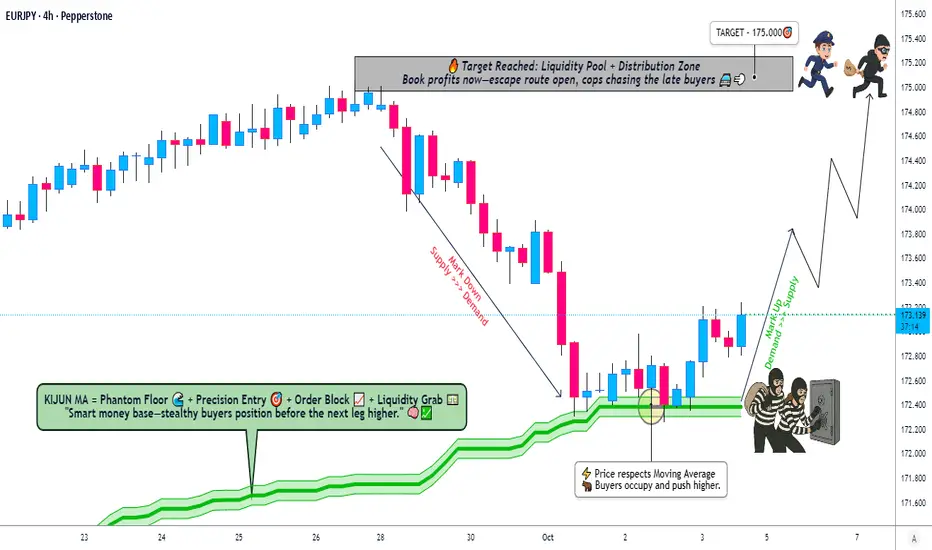
Is EURJPY Setting Up for a Powerful Bullish Run?🎯 EUR/JPY: "Euro vs. Yen" Wealth Heist Strategy 🤑 (Swing/Day Trade)
🚨 Thieves aka (Smart traders) of the Forex Market, Assemble! 🚨Get ready to pull off a slick bullish heist on EUR/JPY with this Thief-Style Trading Plan! We're leveraging a Kijun-Sen pullback to spot a juicy demand zone where the bulls are loading up to push prices higher. Let’s break into the market with style, precision, and a sprinkle of humor! 😎
📈 The Setup: Bullish Breakout Plan 🐂
Asset: EUR/JPY (Euro vs. Japanese Yen)
Market Context: The Kijun-Sen moving average (Ichimoku Cloud) has confirmed a bullish pullback, creating a demand zone at key support levels. Bulls are gathering strength to drive prices upward! 🚀
Trend: Swing/Day Trade with a bullish bias.
🕵️♂️ The Thief’s Entry Plan (Layered Limit Orders)
Our Thief Strategy uses multiple buy limit orders to layer entries like a mastermind stacking the deck. Here’s the plan:
Entry Levels:
🧳 172.400 (First layer, dip-buying opportunity)
🧳 172.600
🧳 172.800
🧳 173.000
Pro Tip: Feel free to add more layers based on your risk appetite and account size. Stack those orders like a pro! 📊
Entry Flexibility: You can enter at any price level within this demand zone, but layering ensures you maximize your position while managing risk.
🛑 Stop Loss: The Thief’s Escape Route
Stop Loss: Set at 172.000 (a tight, calculated exit to protect your loot).
Note: Dear Thieves (OGs and newbies alike), this SL is my suggestion, but it’s your heist, your rules. Adjust based on your risk tolerance and don’t get caught by the market police! 👮♂️
🎯 Take Profit: The Grand Getaway
Target: 175.000 (just shy of a strong resistance zone at 175.200).
Why?: The 175.200 level is a Police Barricade—a combo of strong resistance, overbought conditions, and a potential bear trap. Grab your profits at 175.000 to escape safely! 💰
Note: This TP is my call, but you’re the mastermind here. Take profits at your own discretion and secure the bag! 🤑
💡 Related Pairs to Watch (Correlations & Opportunities)
To make this heist even smoother, keep an eye on these correlated pairs for confirmation or additional setups:
FX:USDJPY : A strong bullish move in USD/JPY often supports EUR/JPY strength due to JPY weakness. Watch for similar demand zones or breakout patterns.
FX:EURUSD : If EUR is strong across the board, EUR/USD breakouts can reinforce our bullish bias on EUR/JPY. Check for alignment in trend direction.
OANDA:GBPJPY : Another JPY pair with high volatility. If GBP/JPY is also showing bullish momentum, it could signal broader JPY weakness, boosting our EUR/JPY play.
Key Correlation Insight: JPY tends to weaken in risk-on environments, so monitor global risk sentiment (e.g., equity indices like S&P 500 or Nikkei 225) for clues.
🔍 Key Points to Understand the Setup
Demand Zone Strength: The Kijun-Sen pullback aligns with historical support, making this a high-probability zone for bulls to step in.
Layered Entries: Using multiple limit orders reduces risk by averaging your entry price, perfect for volatile forex markets.
Risk Management: The tight stop loss at 172.000 keeps your downside limited, while the 175.000 target offers a solid risk-reward ratio (~1:10).
Market Traps: Be cautious at 175.200—overbought conditions and resistance could trigger a reversal. Exit early to avoid getting caught!
⚠️ Disclaimer
This is a Thief-Style Trading Strategy designed for fun and educational purposes. Trading involves risks, and you’re responsible for your own decisions. Always do your own analysis and manage your risk like a pro! 😎
✨ If you find value in my analysis, a 👍 and 🚀 boost is much appreciated — it helps me share more setups with the community!
#EURJPY #ForexTrading #SwingTrading #DayTrading #ThiefStrategy #BullishBreakout #TradingView
BTC - Liquidity Dynamics leading to new HighsMarket Context
Bitcoin has shown a constructive reaction from the recent lows, printing a clean double bottom structure that suggests short-term demand entering the market. After a previous buy-side liquidity sweep and rejection, price has rebalanced and is now challenging a fair value gap (FVG) that previously served as resistance. This marks a key decision zone where the next directional move will unfold.
Fair Value Gaps & Structure
The FVG overhead has already acted as resistance, capping the first impulsive move from the lows. Should price retrace slightly to take out the remaining sell-side liquidity below the double bottom before re-engaging higher, it would confirm the area as a springboard for a bullish continuation. A clean reclaim and hold above the FVG zone would signal a shift in order flow favoring buyers.
Liquidity Dynamics
The current setup offers both sides of the market clear liquidity targets: sell-side liquidity resting under the double bottom and buy-side liquidity resting above the prior high. Smart money could engineer a sweep of the lower side first to accumulate before expansion, or alternatively, break directly through resistance to trigger a larger bullish leg.
Final Thoughts
The structure reflects a balanced but bullish-leaning scenario — a classic accumulation and breakout setup. A deeper retest to clear out lower liquidity would strengthen the foundation for continuation, while sustained strength above the FVG opens the door for a reaction toward new highs.
If this analysis aligned with your view, drop a like — do you think we clear the lows first, or head straight for a bullish breakout?

EUR/USD Daily Chart Analysis For Week of Oct 24, 2025Technical Analysis and Outlook:
In the previous trading session, the Eurodollar market exhibited significant fluctuations between the critical Mean Resistance level of 1.165 and the Mean Support level of 1.159, with the current price oscillating between the two levels.
Market sentiment suggests the prevailing Active Inner Decline trend will continue. The ongoing market perspective continues to anticipate a price decrease toward the initial support level, indicated by Mean Support at 1.159, followed by secondary support at 1.155 and the Inner Currency Dip at 1.151. If this downward trajectory continues, it could extend further to the Outer Currency Dip at 1.145, alongside the Key Support level of 1.140.
Moreover, it is crucial to remain mindful of the potential emergence of an Active Inner Rebound at the Mean Support of 1.159, which may prompt a subsequent move toward the Mean Resistance of 1.165. Additionally, an Auxiliary Inner Rebound following the Outer Currency Dip at 1.145, in conjunction with the Key Support level of 1.140, will represent alternative rebound thresholds for the currency, along with the Mean Support at 1.155 situated above these levels.
