AUDJPY: Weak Market & Bearish Forecast
The charts are full of distraction, disturbance and are a graveyard of fear and greed which shall not cloud our judgement on the current state of affairs in the AUDJPY pair price action which suggests a high likelihood of a coming move down.
Disclosure: I am part of Trade Nation's Influencer program and receive a monthly fee for using their TradingView charts in my analysis.
❤️ Please, support our work with like & comment! ❤️
M-forex

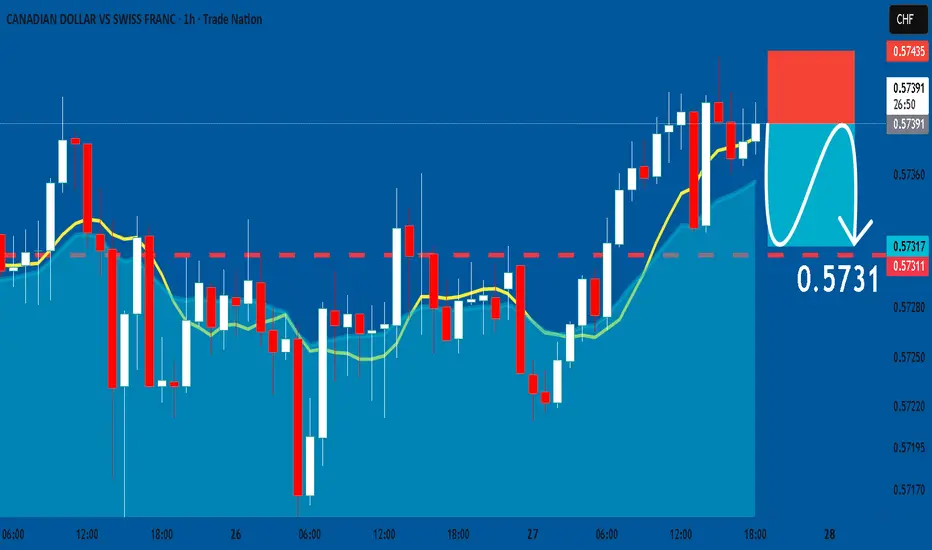
CADCHF: Bearish Continuation & Short Signal
CADCHF
- Classic bearish formation
- Our team expects pullback
SUGGESTED TRADE:
Swing Trade
Short CADCHF
Entry - 0.5739
Sl - 0.5743
Tp - 0.5731
Our Risk - 1%
Start protection of your profits from lower levels
Disclosure: I am part of Trade Nation's Influencer program and receive a monthly fee for using their TradingView charts in my analysis.
❤️ Please, support our work with like & comment! ❤️
AUDJPY Trading Opportunity! BUY!
My dear followers,
I analysed this chart on AUDJPY and concluded the following:
The market is trading on 100.92 pivot level.
Bias - Bullish
Technical Indicators: Both Super Trend & Pivot HL indicate a highly probable Bullish continuation.
Target - 101.16
Safe Stop Loss - 100.81
About Used Indicators:
A super-trend indicator is plotted on either above or below the closing price to signal a buy or sell. The indicator changes color, based on whether or not you should be buying. If the super-trend indicator moves below the closing price, the indicator turns green, and it signals an entry point or points to buy.
Disclosure: I am part of Trade Nation's Influencer program and receive a monthly fee for using their TradingView charts in my analysis.
———————————
WISH YOU ALL LUCK

CADJPY Will Collapse! SELL!
My dear followers,
This is my opinion on the CADJPY next move:
The asset is approaching an important pivot point 111.45
Bias - Bearish
Safe Stop Loss - 111.62
Technical Indicators: Supper Trend generates a clear short signal while Pivot Point HL is currently determining the overall Bearish trend of the market.
Goal - 111.13
About Used Indicators:
For more efficient signals, super-trend is used in combination with other indicators like Pivot Points.
Disclosure: I am part of Trade Nation's Influencer program and receive a monthly fee for using their TradingView charts in my analysis.
———————————
WISH YOU ALL LUCK

GBPNZD Massive Long! BUY!
My dear subscribers,
My technical analysis for GBPNZD is below:
The price is coiling around a solid key level - 2.3126
Bias - Bullish
Technical Indicators: Pivot Points Low anticipates a potential price reversal.
Super trend shows a clear buy, giving a perfect indicators' convergence.
Goal - 2.3243
About Used Indicators:
By the very nature of the supertrend indicator, it offers firm support and resistance levels for traders to enter and exit trades. Additionally, it also provides signals for setting stop losses
Disclosure: I am part of Trade Nation's Influencer program and receive a monthly fee for using their TradingView charts in my analysis.
———————————
WISH YOU ALL LUCK

GBPAUD Technical Analysis! BUY!
My dear friends,
My technical analysis for GBPAUD is below:
The market is trading on 2.0266 pivot level.
Bias - Bullish
Technical Indicators: Both Super Trend & Pivot HL indicate a highly probable Bullish continuation.
Target - 2.0284
Recommended Stop Loss - 2.0253
About Used Indicators:
A pivot point is a technical analysis indicator, or calculations, used to determine the overall trend of the market over different time frames.
Disclosure: I am part of Trade Nation's Influencer program and receive a monthly fee for using their TradingView charts in my analysis.
———————————
WISH YOU ALL LUCK

NZDUSD ShortThe overall direction of the trend has been bearish since July 2025. The trajectory has been on continual decline. Price to make another short bullish consolidation before another continual crash downwards.

Trading quiet markets: General rule of thumbAs North America celebrates Thanksgiving, US stock and bond markets are closed. The currency market continues as normal.
'In general' a good rule of thumb in quiet markets is that 'movent continues in the prevailing direction'. Although likely very slowly.
It is very pleasing that the recent 'risk on sentiment' and the currencies behaving as you would expect, has continued.
I wouldn't blame anyone for placing a risk on trade today, in fact, overall sentiment and currency movement invites a trade. (AUD USD long for example).
Personally, I prefer to wait until liquidity picks up again, which for me, means waiting until at least Friday's European session.
I realise it is easier to sit on the sidelines with two trades under my belt this week.
If you are trading, it is prudent to be aware that some platforms 'widen spreads' in quiet times.

USDCAD BEARISH BREAKOUT|SHORT|
✅USDCAD broke below the supply zone with clean displacement, leaving a fresh imbalance that may act as a breaker on any pullback. Expect price to draw toward sell-side liquidity resting near the lower target area. Time Frame 3H.
SHORT🔥
✅Like and subscribe to never miss a new idea!✅

AUD-USD Bullish Bias! Buy!
Hello,Traders!
AUDUSD pair reclaimed the demand zone after sweeping sell-side liquidity, shifting structure bullish. If momentum holds, price may target the premium inefficiency above as buy-side liquidity gets drawn. Time Frame 3H.
Buy!
Comment and subscribe to help us grow!
Check out other forecasts below too!
Disclosure: I am part of Trade Nation's Influencer program and receive a monthly fee for using their TradingView charts in my analysis.

EURAUD LOCAL LONG|
✅EURAUD has tapped the higher-timeframe demand after clearing sell-side liquidity, signaling a potential bullish reversal. If displacement confirms, algos may drive price toward the next buy-side liquidity target above. Time Frame 3H.
LONG🚀
✅Like and subscribe to never miss a new idea!✅

EUR-CHF Will Keep Growing! Buy!
Hello,Traders!
EURCHF is holding above the horizontal demand after a sweep of sell-side liquidity, hinting at accumulation. If bullish intent confirms, expect continuation toward the next buy-side liquidity at the target level.
Time Frame 8H.
Buy!
Comment and subscribe to help us grow!
Check out other forecasts below too!
Disclosure: I am part of Trade Nation's Influencer program and receive a monthly fee for using their TradingView charts in my analysis.

GBP/USD | Pound Hit All Targets and Looks Ready for Another DropBy analyzing the GBPUSD chart on the 2 hour timeframe, we can see that price moved exactly as expected. It dropped more than 120 pips to 1.30380, then bounced and climbed back into the second supply zone we marked. From that zone, GBPUSD immediately reacted with a 30 pip drop, showing the strong impact of these levels.
Right now price is around 1.3214, and I expect a deeper correction soon.
Keep in mind that before the main drop, GBPUSD might grab liquidity above 1.325, so the chances of a stop hunt are high. Stay tuned for the next updates on GBPUSD.
Please support me with your likes and comments to motivate me to share more analysis with you and share your opinion about the possible trend of this chart with me !
Best Regards , Arman Shaban

EURUSDHello Traders! 👋
What are your thoughts on EURUSD?
EUR/USD has broken its descending trendline and has now completed a clean pullback to the broken level. In this zone, we expect the pair to consolidate briefly and then move toward the identified resistance area.
A confirmed breakout above this resistance will open the way for the next upside targets and act as a strong confirmation of the continuation of the bullish move.
Don’t forget to like and share your thoughts in the comments! ❤️

EURAUD: Expecting Bullish Continuation! Here is Why:
Our strategy, polished by years of trial and error has helped us identify what seems to be a great trading opportunity and we are here to share it with you as the time is ripe for us to buy EURAUD.
Disclosure: I am part of Trade Nation's Influencer program and receive a monthly fee for using their TradingView charts in my analysis.
❤️ Please, support our work with like & comment! ❤️

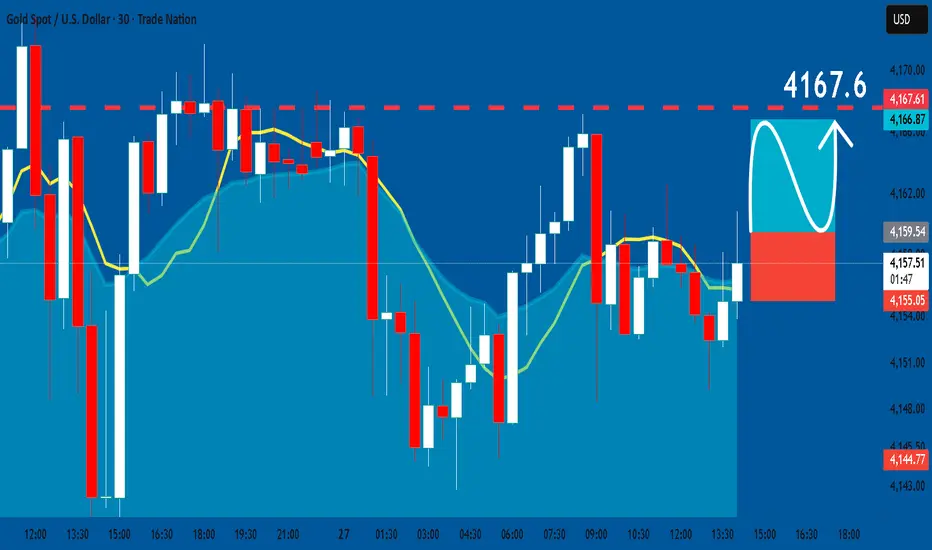
GOLD: Long Trade with Entry/SL/TP
GOLD
- Classic bullish formation
- Our team expects growth
SUGGESTED TRADE:
Swing Trade
Buy GOLD
Entry Level - 4159.5
Sl - 4155.0
Tp - 4167.6
Our Risk - 1%
Start protection of your profits from lower levels
Disclosure: I am part of Trade Nation's Influencer program and receive a monthly fee for using their TradingView charts in my analysis.
❤️ Please, support our work with like & comment! ❤️
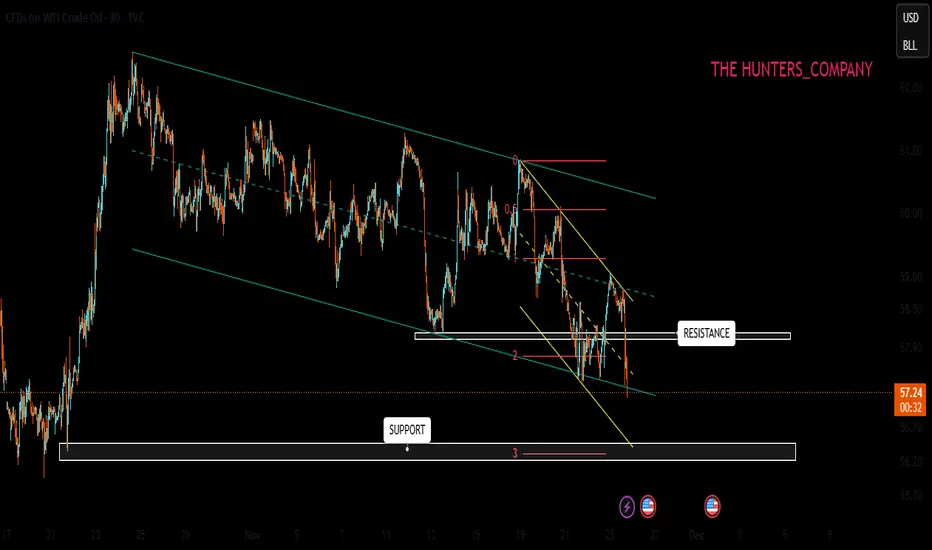
USOIL : Full analysisHello friends
Well, you see that we have a descending channel in which the price is moving, and considering that the price reached the ceiling of the channel, we had a Sharpe decline, and now it seems that the sellers want to break the channel, and the first support identified could be the buyers' stronghold, where we need to see if they support the price or not.
If they support, there is a significant resistance in their way. This area is full of sell orders and can naturally correct the price. In this regard, breaking this resistance is very important and vital for price growth.
Now what if the buyers cannot support the price in the support area and the price falls further?
Well, we need to find areas again for a sell trade because if the descending channel is broken, the fall will be heavier and it is better to move with the trend.
This analysis is purely technical and is not a buy or sell recommendation.
*Trade safely with us*
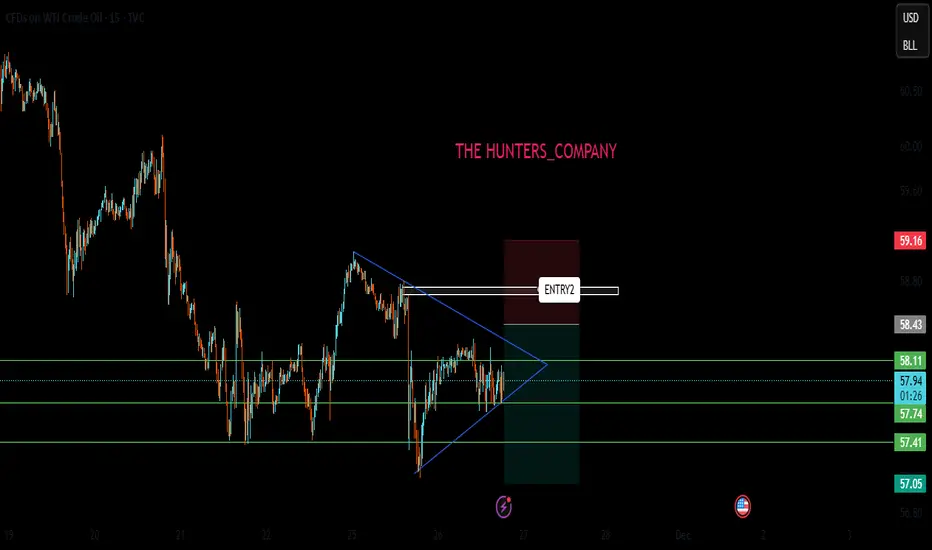
USOIL : LIVE TRADE
Hello friends
Well, considering the downtrend and the power of the sellers, we should also follow the trend and go to the side of the one who has the power.
Given the price drop, if the price pullbacks, we can see the price drop again.
This post is not a buy or sell offer and is only reviewed from a technical perspective.
Observe risk and capital management and avoid emotional movements.
*Trade safely with us*
EURUSD My Opinion! SELL!
My dear followers,
I analysed this chart on EURUSD and concluded the following:
The market is trading on 1.1593 pivot level.
Bias - Bearish
Technical Indicators: Both Super Trend & Pivot HL indicate a highly probable Bearish continuation.
Target - 1.1569
About Used Indicators:
A super-trend indicator is plotted on either above or below the closing price to signal a buy or sell. The indicator changes color, based on whether or not you should be buying. If the super-trend indicator moves below the closing price, the indicator turns green, and it signals an entry point or points to buy.
Disclosure: I am part of Trade Nation's Influencer program and receive a monthly fee for using their TradingView charts in my analysis.
———————————
WISH YOU ALL LUCK

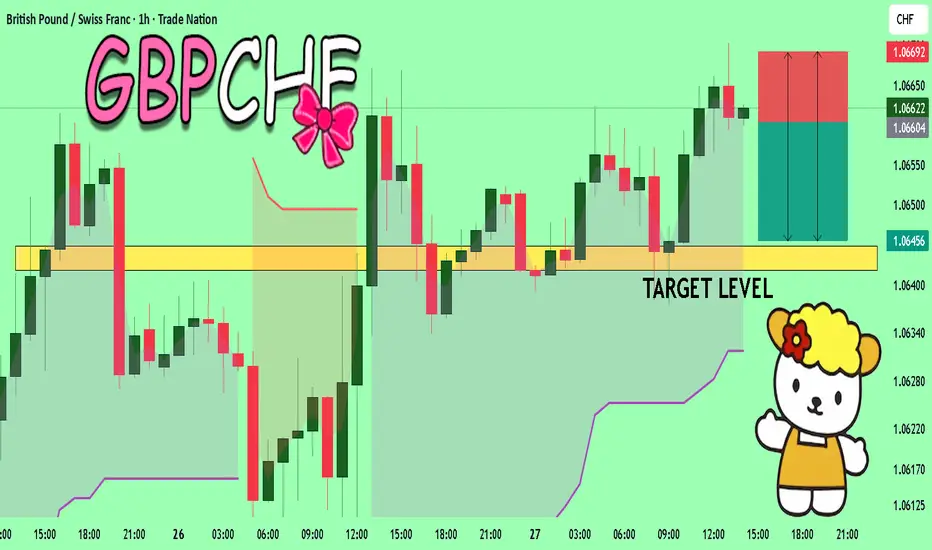
GBPCHF Set To Fall! SELL!
My dear subscribers,
GBPCHF looks like it will make a good move, and here are the details:
The market is trading on 1.0660 pivot level.
Bias - Bearish
My Stop Loss - 1.0669
Technical Indicators: Both Super Trend & Pivot HL indicate a highly probable Bearish continuation.
Target - 1.0644
About Used Indicators:
The average true range (ATR) plays an important role in 'Supertrend' as the indicator uses ATR to calculate its value. The ATR indicator signals the degree of price volatility.
Disclosure: I am part of Trade Nation's Influencer program and receive a monthly fee for using their TradingView charts in my analysis.
———————————
WISH YOU ALL LUCK
GBPJPY Strongly bullish long-termThe GBPJPY pair has been trading within a 6-year Channel Up and is currently on its 3rd Bullish Leg.
With the 1W MA100 (green trend-line) in firm Support, we expect this rally to continue long-term (even at a slower pace as per 1W RSI comparison with previous Legs) and rise by at least +36% in total (minimum on both previous Legs), targeting 240.00.
---
** Please LIKE 👍, FOLLOW ✅, SHARE 🙌 and COMMENT ✍ if you enjoy this idea! Also share your ideas and charts in the comments section below! This is best way to keep it relevant, support us, keep the content here free and allow the idea to reach as many people as possible. **
---
💸💸💸💸💸💸
👇 👇 👇 👇 👇 👇

EURUSD: Bullish Push to 1.167?FX:EURUSD is eyeing a bullish breakout on the 4-hour chart , with price rebounding from a key support zone near recent lows, converging with cumulative sell liquidation and a potential entry area that could spark upside momentum if buyers hold against short-term pullbacks. This setup hints at a reversal opportunity after the recent downtrend, targeting higher resistance levels with strong risk-reward.
Entry between 1.1490–1.1500 for a long position (aggressive entry right here with proper risk management is recommended). Targets at 1.1590 (first), 1.1670 (second). Set stop loss on a close below 1.14685 , delivering a clean risk-reward ratio of ~1:4+ (full run). Watch for bullish confirmation on lower timeframe breakout or strong green candle with volume surge.⚡
Fundamentally , peace talks between Russia and Ukraine are gaining traction in November 2025, with US officials (including Army Secretary Dan Driscoll) engaging in secret negotiations in Abu Dhabi under a proposed Trump-backed plan, where Ukraine has agreed in principle but minor details remain, though Russia shows reluctance and may reject revisions. This could positively impact the euro's upward trend by reducing geopolitical risks, stabilizing European energy markets, and boosting investor confidence in the region's economy.
📝 Trade Setup
🎯 Entry (Long):
1.1490 – 1.1500
(Aggressive entry at current levels is acceptable with strict risk management.)
🎯 Targets:
• TP1: 1.1590
• TP2: 1.1670
❌ Stop Loss:
• Close below 1.14685
⚖️ Risk-to-Reward:
• ~1:4+ full target
👇 Share your thoughts below! 👇

Forex Trading USDCHF BASIC HH‑LL STRATEGY
1. IDENTIFY TREND – Look for a series of HIGHER HIGHS + HIGHER LOWS (up‑trend) or LOWER LOWS + LOWER HIGHS (down‑trend).
2. ENTRY – Enter long when price breaks above the latest HIGH in an up‑trend; enter short when price breaks below the latest LOW in a down‑trend.
3. STOP LOSS – Place it just below the most recent LOW (for longs) or above the most recent HIGH (for shorts).
4. TARGET – Measure the height of the previous swing and project that distance from the entry point, or use a trailing stop to lock profits as the trend continues.
⚠️ Disclaimer:
This setup is shared for educational purposes only. It is not financial advice. Always do your own analysis and apply proper risk management before trading any setup.
