Hellena | EUR/USD (4H): SHORT to the MIN of wave "3" 1.14647.We continue to monitor the decline in downward momentum. In the last forecast the target was almost reached, but the correction turned out to be stronger than we thought, which does not cancel the forecast, but just gives us an opportunity to enter a short position once again quite favorably.
I expect that the small wave “b” is either over or almost over and the price is about to start its decline to the support area at 1.14647.
This movement should be a confirmation of the completion of the large correction (red) “ABC”.
Manage your capital correctly and competently! Only enter trades based on reliable patterns!
M-forex

AUD/JPY-Supply Zone Rejection Signals Potential Bearish ReversalAUD/JPY is showing signs of weakening bullish momentum as price reacts sharply from the Strong Supply Zone at the top of the chart. This area has historically acted as a major distribution zone, and the latest rejection suggests that sellers are stepping back into control.
After forming multiple double-bottom rallies, price pushed upward but failed to sustain momentum beyond the supply ceiling. The sharp rejection indicates that liquidity has been collected from trapped buyers, and the market may now be preparing for a deeper corrective move.
The structure around the neckline and mid-buyer zone is critical. A break below this area—especially below the 100.000 level—would confirm a bearish shift. The chart already highlights a possible breakout-retest scenario, where price could break the buyer zone, retest it from below, and continue downward.
If sellers maintain pressure, the next target lies near the Support Zone around 98.500, aligned with previous range lows. A deeper move could even reach the broader Demand Zone Area, completing a full bearish correction.
Overall, the chart is signaling a potential reversal from supply, with sellers gaining strength and momentum shifting toward the downside as long as price remains below the supply zone and fails to reclaim the neckline.

Bullish momentum to extend?USD/JPY is falling towards the pivot, which has been identified as a pullback support and could bounce to the 1st resistance.
Pivot: 154.41
1st Support: 151.03
1st Resistance: 158.33
Disclaimer:
The opinions given above constitute general market commentary and do not constitute the opinion or advice of IC Markets or any form of personal or investment advice.
Any opinions, news, research, analyses, prices, other information, or links to third-party sites contained on this website are provided on an "as-is" basis, are intended to be informative only, and are not advice, a recommendation, research, a record of our trading prices, an offer of, or solicitation for, a transaction in any financial instrument and thus should not be treated as such. The information provided does not involve any specific investment objectives, financial situation, or needs of any specific person who may receive it. Please be aware that past performance is not a reliable indicator of future performance and/or results. Past performance or forward-looking scenarios based upon the reasonable beliefs of the third-party provider are not a guarantee of future performance. Actual results may differ materially from those anticipated in forward-looking or past performance statements. IC Markets makes no representation or warranty and assumes no liability as to the accuracy or completeness of the information provided, nor any loss arising from any investment based on a recommendation, forecast, or any information supplied by any third party.

Bullish continuation?Loonie (USD/CAD) is falling towards the pivot which is an overlap support and could bounce to the 1st resistance.
Pivot: 1.3916
1st Support: 1.3761
1st Resistance: 1.4264
Disclaimer:
The opinions given above constitute general market commentary and do not constitute the opinion or advice of IC Markets or any form of personal or investment advice.
Any opinions, news, research, analyses, prices, other information, or links to third-party sites contained on this website are provided on an "as-is" basis, are intended to be informative only, and are not advice, a recommendation, research, a record of our trading prices, an offer of, or solicitation for, a transaction in any financial instrument and thus should not be treated as such. The information provided does not involve any specific investment objectives, financial situation, or needs of any specific person who may receive it. Please be aware that past performance is not a reliable indicator of future performance and/or results. Past performance or forward-looking scenarios based upon the reasonable beliefs of the third-party provider are not a guarantee of future performance. Actual results may differ materially from those anticipated in forward-looking or past performance statements. IC Markets makes no representation or warranty and assumes no liability as to the accuracy or completeness of the information provided, nor any loss arising from any investment based on a recommendation, forecast, or any information supplied by any third party.

Bullish bounce off major support?Swissie (USD/CHF) is falling towards the pivot and could bounce to the pullback resistance.
Pivot: 0.7875
1st Support: 0.7720
1st Resistance: 0.8165
Disclaimer:
The opinions given above constitute general market commentary and do not constitute the opinion or advice of IC Markets or any form of personal or investment advice.
Any opinions, news, research, analyses, prices, other information, or links to third-party sites contained on this website are provided on an "as-is" basis, are intended to be informative only, and are not advice, a recommendation, research, a record of our trading prices, an offer of, or solicitation for, a transaction in any financial instrument and thus should not be treated as such. The information provided does not involve any specific investment objectives, financial situation, or needs of any specific person who may receive it. Please be aware that past performance is not a reliable indicator of future performance and/or results. Past performance or forward-looking scenarios based upon the reasonable beliefs of the third-party provider are not a guarantee of future performance. Actual results may differ materially from those anticipated in forward-looking or past performance statements. IC Markets makes no representation or warranty and assumes no liability as to the accuracy or completeness of the information provided, nor any loss arising from any investment based on a recommendation, forecast, or any information supplied by any third party.

Headnig into pullback resistance?Cable (GBP/USD) is rising towards the pivot, which acts as a pullback resistance and could reverse to the 1st support, which has been identified as an overlap support.
Pivot: 1.3290
1st Support: 1.3002
1st Resistance: 1.3459
Disclaimer:
The opinions given above constitute general market commentary and do not constitute the opinion or advice of IC Markets or any form of personal or investment advice.
Any opinions, news, research, analyses, prices, other information, or links to third-party sites contained on this website are provided on an "as-is" basis, are intended to be informative only, and are not advice, a recommendation, research, a record of our trading prices, an offer of, or solicitation for, a transaction in any financial instrument and thus should not be treated as such. The information provided does not involve any specific investment objectives, financial situation, or needs of any specific person who may receive it. Please be aware that past performance is not a reliable indicator of future performance and/or results. Past performance or forward-looking scenarios based upon the reasonable beliefs of the third-party provider are not a guarantee of future performance. Actual results may differ materially from those anticipated in forward-looking or past performance statements. IC Markets makes no representation or warranty and assumes no liability as to the accuracy or completeness of the information provided, nor any loss arising from any investment based on a recommendation, forecast, or any information supplied by any third party.

Bearish reversal?Fiber (EUR/USD) is rising towards the pivot and could reverse to the swing low support.
Pivot: 1.1654
1st Support: 1.1403
1st Resistance: 1.1807
Disclaimer:
The opinions given above constitute general market commentary and do not constitute the opinion or advice of IC Markets or any form of personal or investment advice.
Any opinions, news, research, analyses, prices, other information, or links to third-party sites contained on this website are provided on an "as-is" basis, are intended to be informative only, and are not advice, a recommendation, research, a record of our trading prices, an offer of, or solicitation for, a transaction in any financial instrument and thus should not be treated as such. The information provided does not involve any specific investment objectives, financial situation, or needs of any specific person who may receive it. Please be aware that past performance is not a reliable indicator of future performance and/or results. Past performance or forward-looking scenarios based upon the reasonable beliefs of the third-party provider are not a guarantee of future performance. Actual results may differ materially from those anticipated in forward-looking or past performance statements. IC Markets makes no representation or warranty and assumes no liability as to the accuracy or completeness of the information provided, nor any loss arising from any investment based on a recommendation, forecast, or any information supplied by any third party.

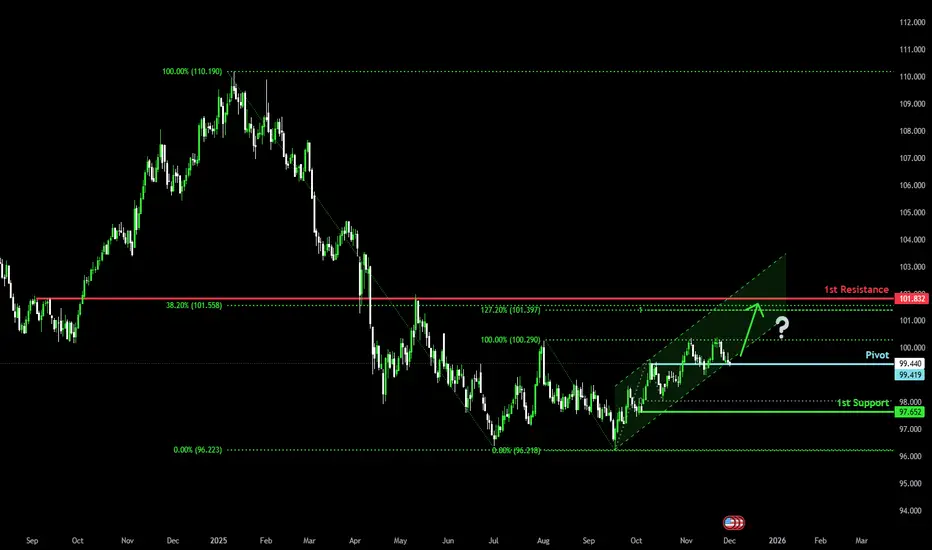
Could we see a bullish reversal?US Dollar Index (DXY) is reacting off the pivot and could bounce to the 1st resistance which lines up witht he 38.2% Fibonacci retracement.
Pivot: 99.41
1st Support: 97.65
1st Resistance: 101.83
Disclaimer:
The opinions given above constitute general market commentary and do not constitute the opinion or advice of IC Markets or any form of personal or investment advice.
Any opinions, news, research, analyses, prices, other information, or links to third-party sites contained on this website are provided on an "as-is" basis, are intended to be informative only, and are not advice, a recommendation, research, a record of our trading prices, an offer of, or solicitation for, a transaction in any financial instrument and thus should not be treated as such. The information provided does not involve any specific investment objectives, financial situation, or needs of any specific person who may receive it. Please be aware that past performance is not a reliable indicator of future performance and/or results. Past performance or forward-looking scenarios based upon the reasonable beliefs of the third-party provider are not a guarantee of future performance. Actual results may differ materially from those anticipated in forward-looking or past performance statements. IC Markets makes no representation or warranty and assumes no liability as to the accuracy or completeness of the information provided, nor any loss arising from any investment based on a recommendation, forecast, or any information supplied by any third party.
XRP outcome!XRP did a drop in the Asian session after markets opened up. Possible reversal near this zone going to the London session or a reversal at the bottom of the channel or near it.

Gold Is Loading Pressure — The Next Breakout Will Be Violent1. Market Structure Overview
Price is currently respecting a rising channel, showing a consistent sequence of higher highs – higher lows, but with gradually compressed momentum near the upper boundary and the resistance zone.
Key observations:
- Price is hovering near the upper trendline of the ascending channel.
- The resistance zone is directly above current price, causing hesitation and wicks.
- The chart shows a potential indecision → correction → continuation pattern forming.
This reflects a market preparing for a bullish continuation, but only after a controlled pullback.
2. Expected Scenarios for Today
✓ Primary Scenario – Bullish Retest Before Breakout (High Probability)
Price is likely to:
- Pull back toward the midline/lower edge of the ascending channel (yellow zone).
- Form a higher low within structure.
- Execute a clean retest of the ENTRY ZONE highlighted on your chart.
- Break above the Resistance Zone → Continue toward higher targets.
This matches your projected structure perfectly.
Entry Logic:
- Wait for price to retest the rising trendline and show bullish confirmation.
- The ENTRY ZONE is valid and aligns with trend continuation.
Upside Targets:
- TP1: 4,215–4,225
- TP2: 4,250+
- TP3 (extended): 4,280+ if the breakout is impulsive.
✓ Secondary Scenario – Compression Before Break
If price stays inside the channel and moves sideways:
- Market remains bullish but indecisive.
- This builds liquidity for a stronger breakout later.
- No selling is recommended unless structure breaks.
This scenario still favors bulls—just slower.
3. Trend Bias (Intraday)
The dominant trend is:
➡️ BULLISH – Buy the dip, do NOT chase breakouts
Signs confirming bullish bias:
- Higher lows remain intact.
- Structure respects the ascending channel perfectly.
- Resistance is tested multiple times → weakening.
- Volume spikes on bullish waves, fades on corrections.
4. Professional Conclusion
Gold remains in a strong bullish continuation structure inside the rising channel.
Your ENTRY ZONE is positioned perfectly for a high-quality retest trade.
Plan of Action:
- Wait for the pullback to the trendline.
- Confirm bullish rejection.
- Enter long within the zone.
- Target the liquidity sweep above resistance.
Smart, calculated, high-probability setup. 🔥

Falling towards key support?USD/CAD is falling towards the support level which is an overlap support that i slightly below the 38.2% Fibonacci retracement and could bounce from this level to our take profit.
Entry: 0.8006
Why we like it:
There is an overlap support that i slightly below the 38.2% Fibonacci retracement.
Stop loss: 0.7968
Why we like it:
There is a pullback support level that aligns with the 61.8% Fibonacci retracement.
Take profit: 0.8067
Why we like it:
There is a pullback resistance level.
Enjoying your TradingView experience? Review us!
Please be advised that the information presented on TradingView is provided to Vantage (‘Vantage Global Limited’, ‘we’) by a third-party provider (‘Everest Fortune Group’). Please be reminded that you are solely responsible for the trading decisions on your account. There is a very high degree of risk involved in trading. Any information and/or content is intended entirely for research, educational and informational purposes only and does not constitute investment or consultation advice or investment strategy. The information is not tailored to the investment needs of any specific person and therefore does not involve a consideration of any of the investment objectives, financial situation or needs of any viewer that may receive it. Kindly also note that past performance is not a reliable indicator of future results. Actual results may differ materially from those anticipated in forward-looking or past performance statements. We assume no liability as to the accuracy or completeness of any of the information and/or content provided herein and the Company cannot be held responsible for any omission, mistake nor for any loss or damage including without limitation to any loss of profit which may arise from reliance on any information supplied by Everest Fortune Group.

XAUUSD: Strong Growth and Buying OpportunityWith the prospect of a Fed interest rate cut and the weakening of the USD, XAUUSD is showing signs of a strong growth phase. Based on macroeconomic news and technical charts, we can see that the price of gold continues to hold steady above the uptrend line .
XAUUSD is currently pulling back to instant support at 4,120,000 USD . The uptrend is supported by the EMA (34, 89) indicators and the current upward trend. The strong support at 4,120,000 USD plays a crucial role in maintaining this upward momentum.
Short-Term Forecast:
XAUUSD could continue to rise to higher levels if it holds above 4,120,000 USD, with the next target being the TP1 level at 4,200,000 USD , and even the TP2 level at 4,250,000 USD . This is supported by market expectations that the Fed will continue to lower interest rates in December, weakening the USD and boosting demand for gold as a safe-haven asset.
Conclusion:
With a stable upward trend and support from both the market and chart indicators, XAUUSD is likely to continue its upward movement. If there is a pullback to the support level, it will provide an excellent opportunity for buying.

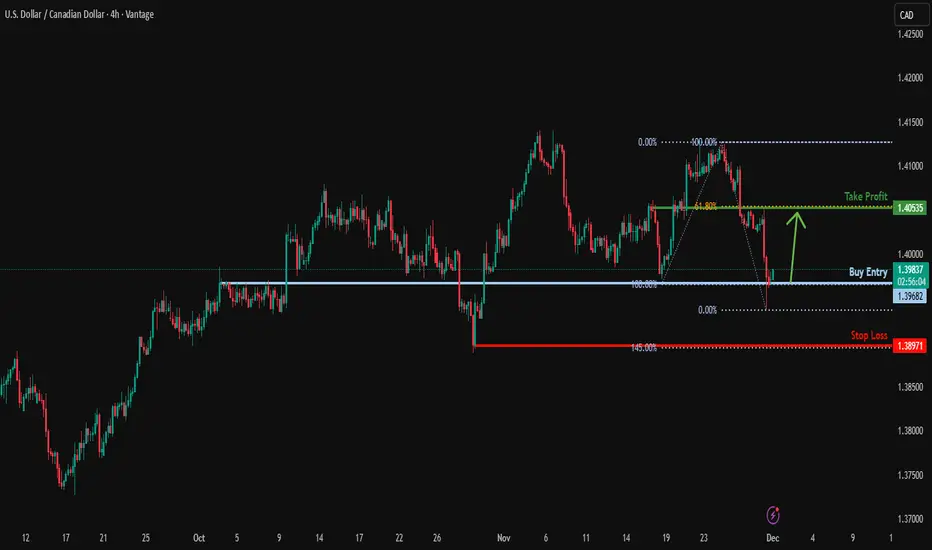
Potential bullish reversal?USD/CAD is reacting off the support level which is a pullback support and could bounce from this level to our take profit.
Entry: 1.3968
Why we like it:
There is a pullback support level.
Stop loss: 1.3897
Why we like it:
There is a swing low support level that aligns with the 145% Fibonacci extension.
Take profit: 1.4053
Why we like it:
There is a pullback resistance level that aligns with the 61.8% Fibonacci retracement.
Enjoying your TradingView experience? Review us!
Please be advised that the information presented on TradingView is provided to Vantage (‘Vantage Global Limited’, ‘we’) by a third-party provider (‘Everest Fortune Group’). Please be reminded that you are solely responsible for the trading decisions on your account. There is a very high degree of risk involved in trading. Any information and/or content is intended entirely for research, educational and informational purposes only and does not constitute investment or consultation advice or investment strategy. The information is not tailored to the investment needs of any specific person and therefore does not involve a consideration of any of the investment objectives, financial situation or needs of any viewer that may receive it. Kindly also note that past performance is not a reliable indicator of future results. Actual results may differ materially from those anticipated in forward-looking or past performance statements. We assume no liability as to the accuracy or completeness of any of the information and/or content provided herein and the Company cannot be held responsible for any omission, mistake nor for any loss or damage including without limitation to any loss of profit which may arise from reliance on any information supplied by Everest Fortune Group.
Bullish bounce off key supportGBP/USD is falling towards the support level, which is a pullback support that is slightly above the 38.2% Fibonacci retracement and could bounce from this level to our take profit.
Entry: 1.3194
Why we like it:
There is a pullback support that is slightly above the 38.2% Fibonacci retracement.
Stop loss: 1.3140
Why we like it:
There is a pullback support that is slightly above the 61.8% Fibonacci retracement.
Take profit: 1.3322
Why we like it:
There is a pullback resistance level that aligns with the 161.8% Fibonacci extension.
Enjoying your TradingView experience? Review us!
Please be advised that the information presented on TradingView is provided to Vantage (‘Vantage Global Limited’, ‘we’) by a third-party provider (‘Everest Fortune Group’). Please be reminded that you are solely responsible for the trading decisions on your account. There is a very high degree of risk involved in trading. Any information and/or content is intended entirely for research, educational and informational purposes only and does not constitute investment or consultation advice or investment strategy. The information is not tailored to the investment needs of any specific person and therefore does not involve a consideration of any of the investment objectives, financial situation or needs of any viewer that may receive it. Kindly also note that past performance is not a reliable indicator of future results. Actual results may differ materially from those anticipated in forward-looking or past performance statements. We assume no liability as to the accuracy or completeness of any of the information and/or content provided herein and the Company cannot be held responsible for any omission, mistake nor for any loss or damage including without limitation to any loss of profit which may arise from reliance on any information supplied by Everest Fortune Group.

Bullish bounce off?EUR/USD has bounced off the support level, which is a pullback support, and could rise from this level to our take profit.
Entry: 1.1552
Why we like it:
There is an overlap support level.
Stop loss: 1.1492
Why we like it:
There is a pullback support level.
Take profit: 1.1666
Why we like it:
There is a swing high resistance that aligns with the 100% Fibonacci projection.
Enjoying your TradingView experience? Review us!
Please be advised that the information presented on TradingView is provided to Vantage (‘Vantage Global Limited’, ‘we’) by a third-party provider (‘Everest Fortune Group’). Please be reminded that you are solely responsible for the trading decisions on your account. There is a very high degree of risk involved in trading. Any information and/or content is intended entirely for research, educational and informational purposes only and does not constitute investment or consultation advice or investment strategy. The information is not tailored to the investment needs of any specific person and therefore does not involve a consideration of any of the investment objectives, financial situation or needs of any viewer that may receive it. Kindly also note that past performance is not a reliable indicator of future results. Actual results may differ materially from those anticipated in forward-looking or past performance statements. We assume no liability as to the accuracy or completeness of any of the information and/or content provided herein and the Company cannot be held responsible for any omission, mistake nor for any loss or damage including without limitation to any loss of profit which may arise from reliance on any information supplied by Everest Fortune Group.

USD/JPY: Seeking a Swing LowThe daily chart of USD/JPY shows an established uptrend, though prices have been retracing lower for the past seven trading days. I am therefore on the lookout for a swing low in anticipation of a move back to at least 157.
The daily RSI (2) has not yet reached oversold and momentum on the lower timeframes is currently bearish. But with the 155 handle, 155.20 weekly VPOC and monthly pivot point at 155.62 nearby for potential support, perhaps a swing low is near.
Bulls could seek dips towards 155 in anticipation of a move top 157.
Matt Simpson, Market Analyst at City Index

Downfall of DXY?!? Bears Flag The Possibility!Here on TVC:DXY we can see that last week it ended in a Bearish Breakout of an Ascending Channel, the perfect Bear Flag scenario!
Now price closed the week on the ascent possibly being the Retest of the Breakout.
If the Channel holds price on a successful retest, TVC:DXY will drop!
Fundamentally, USD has impactful news all week this week. Even so, with limited data from back logged events not available until after next FOMC Meeting, this means the Federal Reserve will continue to make decisions in "the dark" and with a high probability of a Rate Cut coming in December!
If the Bear Flag is successful in being a continuation pattern set-up, we could see price drop down to the prior Low of November under 99!

Forex: Weekly Review It was very pleasing that, by and large, the week starting Monday 24 November was a 'risk on' week.
Following on from the 'WILLIAMS' comments the previous Friday, the positive mood was enhanced by some 'goldilocks' US data on Tuesday. And the 'risk on sentiment' remained for the rest of the week, briefly taking a pause during Thanksgiving. But returning for a final flourish on Friday.
Given how difficult the past few months have been, this week's 'narrative and price action' was comforting and encouraging , trading is much more straightforward when the overall mood is positive and I begin the new week continuing my bias for 'risk on' trades.
But it should be noted that it would only take some 'hot US data', or a 'hawkish comment' for the uncertainty to return. And that's without mentioning anything the BOJ or President Trump could send our way. And as ever I'll be keeping any eye on the VIX and the S&P along with keeping up to speed with the narrative.
In other news, the AUD, NZD and GBP had 'good weeks', obviously boosted by the positive environment but also their own fundamentals, 'hot' AUD CPI, a 'hawkish cut' from the RBNZ and the UK budget appeased GBP sentiment.
It's a slow process but peace in the UKRAINE creeps ever closer (EUR and GBP positive) and finally, 'hot GDP' boosted the CAD on Friday, it could well be that (similar to NZD) front loaded rare cuts are filtering through to the economy.
On a personal note, it was a week of two trades, both 'risk on' and both short USD. A EUR USD on Tuesday, post US data. And a GBP USD post UK budget. It is pleasing there could have actually been another trade or two in there. And any trade could have been any type of risk on concoction.
I unfortunately missed Friday due to (once again) out of the blue uncle John duties. Not to get too personal but I have a nephew who has down syndrome and autism and I'm happy to shoulder some if his care when it's required.
I begin the new week feeling a little more emboldened than the previous couple of months. But it is prudent to be aware that anything can happen at any moment to flip the narrative in its head.
Let's see what December brings.

EURJPY PULLBACK AHEAD|SHORT|
✅EURJPY Price is rejecting the supply zone after a sweep of highs, with a mitigation of the last bearish displacement candle pointing to bearish order flow targeting the next liquidity pocket below. Time Frame: 2H
SHORT🔥
✅Like and subscribe to never miss a new idea!✅

AUDUSD STRONG BREAKOUT|LONG|
✅ AUDUSD is breaking structure as it trades out of the demand block, signalling a continuation toward the upside liquidity pocket. With momentum shifting, the pair aims to draw toward the next clean inefficiency above before reaction. Time Frame 4H.
LONG🚀
✅Like and subscribe to never miss a new idea!✅

USD-JPY Will Grow! Buy!
Hello, Traders!
USDJPY shows price reacting around the rising trendline, with liquidity building beneath the minor swing lows. Smart Money may engineer a corrective move before a continuation toward the target level as the structure remains bullish and higher-timeframe momentum supports further expansion. Time Frame 7H.
Buy!
Comment and subscribe to help us grow!
Check out other forecasts below too!
Disclosure: I am part of Trade Nation's Influencer program and receive a monthly fee for using their TradingView charts in my analysis.

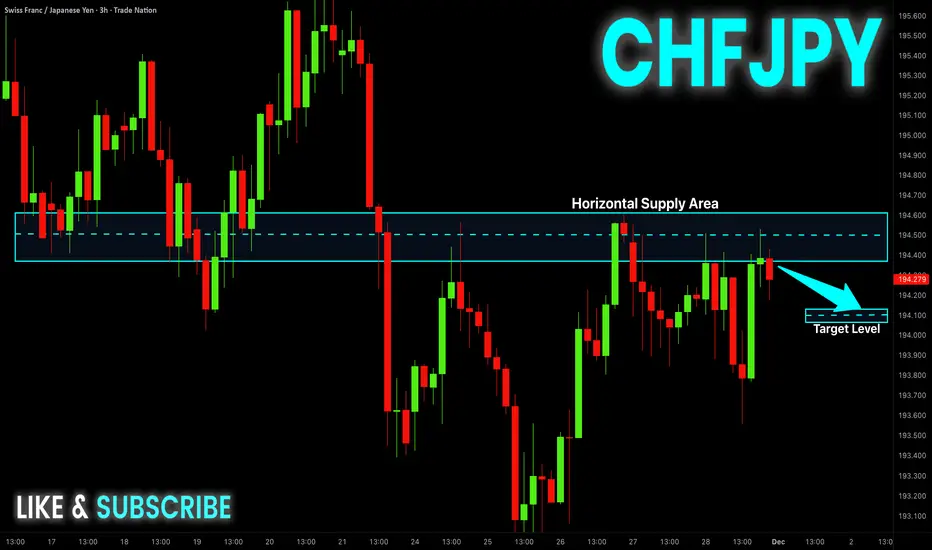
CHF-JPY Local Short! Sell!
Hello,Traders!
CHFJPY is reacting inside a major supply block after sweeping liquidity above the previous swing high. With structure shifting bearish, the pair is poised for a continuation lower toward the next downside inefficiency. Time Frame 3H.
Sell!
Comment and subscribe to help us grow!
Check out other forecasts below too!
Disclosure: I am part of Trade Nation's Influencer program and receive a monthly fee for using their TradingView charts in my analysis.
AUD-JPY Free Signal! Sell!
Hello,Traders!
AUDJPY tapped into a high-timeframe supply block and printed rejection wicks, signalling distribution after a premium sweep. With liquidity taken above the range, the setup aligns for a displacement down into the next draw-on-liquidity.
Sell!
Comment and subscribe to help us grow!
Check out other forecasts below too!
Disclosure: I am part of Trade Nation's Influencer program and receive a monthly fee for using their TradingView charts in my analysis.
