EURUSD Bulls Cheer Powell’s Hint at Ending QTEURUSD has turned flat after approaching the key 1.15 support. The 1.1540–1.1635 zone is now being tested to the upside after Powell opened the door to two rate cuts for the rest of the year and, perhaps more importantly, gave an early signal of ending quantitative tightening (QT).
If 1.1635 breaks, the next upside target could be the 1.1690–1.1705 zone.
M-forex

Bearish drop?AUD/CAD has rejected off the pivot, which is a pullback resistance and could drop to the 1st support, which aligns with the 78.6% Fibonacci projection.
Pivot: 0.91529
1st Support: 0.90179
1st Resistance: 0.92279
Disclaimer:
The above opinions given constitute general market commentary, and do not constitute the opinion or advice of IC Markets or any form of personal or investment advice.
Any opinions, news, research, analyses, prices, other information, or links to third-party sites contained on this website are provided on an "as-is" basis, are intended only to be informative, is not an advice nor a recommendation, nor research, or a record of our trading prices, or an offer of, or solicitation for a transaction in any financial instrument and thus should not be treated as such. The information provided does not involve any specific investment objectives, financial situation and needs of any specific person who may receive it. Please be aware, that past performance is not a reliable indicator of future performance and/or results. Past Performance or Forward-looking scenarios based upon the reasonable beliefs of the third-party provider are not a guarantee of future performance. Actual results may differ materially from those anticipated in forward-looking or past performance statements. IC Markets makes no representation or warranty and assumes no liability as to the accuracy or completeness of the information provided, nor any loss arising from any investment based on a recommendation, forecast or any information supplied by any third-party.

Bullish reversal off major support?NZD/JPY is falling towards the pivot, which is a multi-swing low support level and could bounce to the pullback resistance.
Pivot: 85.65
1st Support: 84.74
1st Resistance: 86.43
Disclaimer:
The above opinions given constitute general market commentary, and do not constitute the opinion or advice of IC Markets or any form of personal or investment advice.
Any opinions, news, research, analyses, prices, other information, or links to third-party sites contained on this website are provided on an "as-is" basis, are intended only to be informative, is not an advice nor a recommendation, nor research, or a record of our trading prices, or an offer of, or solicitation for a transaction in any financial instrument and thus should not be treated as such. The information provided does not involve any specific investment objectives, financial situation and needs of any specific person who may receive it. Please be aware, that past performance is not a reliable indicator of future performance and/or results. Past Performance or Forward-looking scenarios based upon the reasonable beliefs of the third-party provider are not a guarantee of future performance. Actual results may differ materially from those anticipated in forward-looking or past performance statements. IC Markets makes no representation or warranty and assumes no liability as to the accuracy or completeness of the information provided, nor any loss arising from any investment based on a recommendation, forecast or any information supplied by any third-party.

BITCOIN FREE SIGNAL|LONG|
✅BTCUSD has tapped into a major demand zone and printed a bullish shift in structure, suggesting smart money accumulation before expansion. A strong move toward the next liquidity pool is expected.
—————————
Entry: 108,454$
Stop Loss: 107,062$
Take Profit: 110,895$
Time Frame: 6H
Setup Risk: High
—————————
LONG🚀
✅Like and subscribe to never miss a new idea!✅

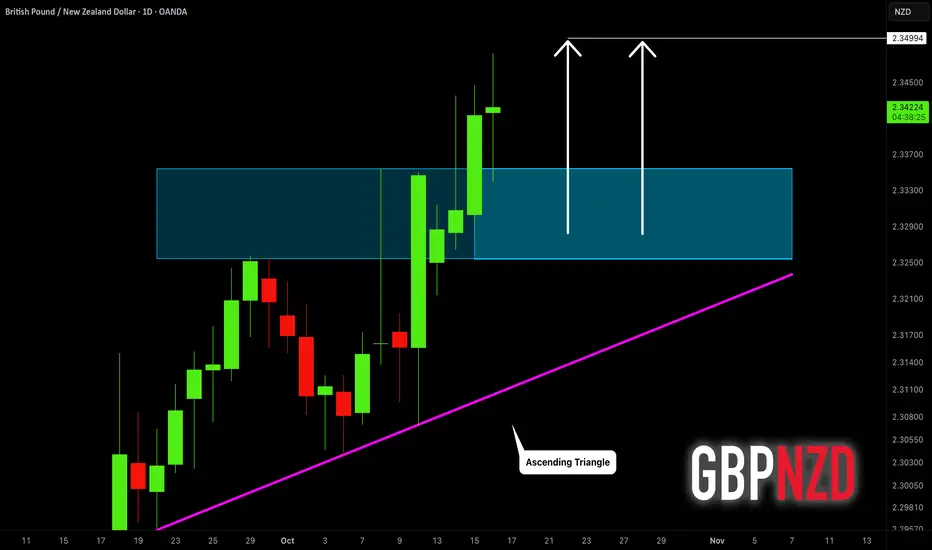
GBPNZD: Bull Run Continues 🇬🇧🇳🇿
GBPNZD will likely grow more following a confirmed
breakout of a resistance of an ascending triangle pattern on a daily.
Next resistance is 2.35
❤️Please, support my work with like, thank you!❤️
XAUUSD Builds Upward PressureGold continues to trade within a strong upward trajectory,showing consistent momentum and firm buyer engagement.The market structure indicates ongoing accumulation,with price maintaining stability after minor corrective movements.Buy-side activity remains dominant,reflecting confidence among institutional participants as the metal sustains its trend within an orderly channel.While short-term pullbacks may occur for liquidity rebalancing,the broader outlook remains decisively bullish as long as momentum persists and demand continues to support higher valuations.

EUR/USD on a path to Retest 20 day MA - But what comes next?In yesterday´s video I mentioned that price was firmly in the blue algo for buying and at the same time, at the time of recording the price was building liquidity potentially for some continuation.
In today´s video we review how you could´ve traded that, however given the buying continuation, and the price neighbouring your 20 day MA, there could be some limit in regards to more buying.
I´m not saying this will reverse but we have to be cautious as risk/reward get skewed and take this one algorithm or indicator at a time.
Hope this video helps
As always, let me know if there are any questions

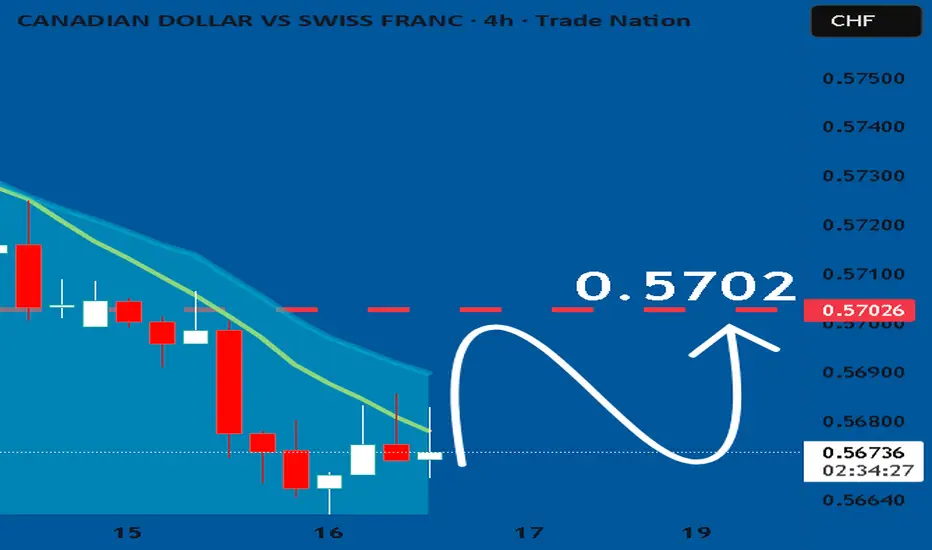
CADCHF: Bulls Will Push Higher
Looking at the chart of CADCHF right now we are seeing some interesting price action on the lower timeframes. Thus a local move up seems to be quite likely.
Disclosure: I am part of Trade Nation's Influencer program and receive a monthly fee for using their TradingView charts in my analysis.
❤️ Please, support our work with like & comment! ❤️
EURAUD: Bearish Continuation & Short Trade
EURAUD
- Classic bearish formation
- Our team expects fall
SUGGESTED TRADE:
Swing Trade
Sell EURAUD
Entry Level - 1.7977
Sl - 1.8009
Tp - 1.7921
Our Risk - 1%
Start protection of your profits from lower levels
Disclosure: I am part of Trade Nation's Influencer program and receive a monthly fee for using their TradingView charts in my analysis.
❤️ Please, support our work with like & comment! ❤️

GBPUSD Breaks Out of Descending WedgeGBPUSD has broken the descending wedge formation to the upside. The move came alongside a falling dollar index and a drop in gilt yields. Expectations for BOE rate cuts have increased following dovish comments from Bank of England members, particularly Governor Bailey, who focused on signs of weakness in the labor market. Normally, rising dovish expectations would weigh on a currency, but the market has interpreted the fall in already high yields as positive for the pound.
On Tuesday, the unemployment rate unexpectedly rose to 4.8 percent from 4.7 percent. However, today’s narrower trade deficit and mild GDP growth figures were both supportive for GBP.
With the wedge now broken, upward pressure is likely to continue. Before another leg higher, GBPUSD may retest the broken wedge around the 1.3360–1.3390 zone. If this area holds, any short-term pullback could create buying opportunities toward levels above 1.35.

EUR/USD | EURUSD Breakdown Alert: Could It Drop Toward 1.1565?By analyzing the EUR/USD chart on the 2-hour timeframe, we can see that the price is currently trading around 1.162 .
If it manages to hold below the 1.164 level, we could expect further downside movement from the Euro.
The next potential bearish targets are 1.160, 1.158, and 1.1565 .
Please support me with your likes and comments to motivate me to share more analysis with you and share your opinion about the possible trend of this chart with me !
Best Regards , Arman Shaban

USDCHF To Fall Further After Price Confirms Reversal @ .79797Price on OANDA:USDCHF has confirmed the Bearish Reversal @ .79797 and has formed a Lower Low!
Based from the Lower High @ .80577 to the Lower Low @ .79328, the 38.2% Fibonacci Retracement level finds itself right at the Confirmation which happens to be the next area that will be favorable for a Short Opportunity!
Once the 38.2% level is visited, we can expect Price will fall down to the next Support Level at the 1.618 Extension or Golden Ratio at .7902!

GBPCAD STRONG BREAKOUT|LONG|
✅GBPCAD has confirmed an ICT-style bullish breakout above the key level, showing strong displacement and market structure shift. A possible retest of the breaker block could offer continuation toward the 1.8920$ target. Time Frame 5H.
LONG🚀
✅Like and subscribe to never miss a new idea!✅

AUDUSD: Weak DowntrendKey Observations:
Price is holding below the daily HTL, which gives me a bearish sentiment
The latest reaction from the daily HTL is a bit weaker, which gives me a small point of concern
This is going to be another attempt to trade the price acceleration from the EMA band to the downside
If price fails to make a significant low, I think it's safe to say that we'll see a reversal and stronger likelihood to the upside

GBP-NZD Strong Bullish Bias! Buy!
Hello,Traders!
GBPNZD has confirmed a bullish breakout above the horizontal demand area. SMC structure remains intact, and price is likely to retest the breakout zone before heading toward the 2.36$ target level. Time Frame 10H.
Buy!
Comment and subscribe to help us grow!
Check out other forecasts below too!
Disclosure: I am part of Trade Nation's Influencer program and receive a monthly fee for using their TradingView charts in my analysis.

XAUUSD Long: Path to 4280 After Successful RetestHello, traders! The price auction for XAUUSD has been in a powerful and sustained bullish phase, with the market structure being clearly defined by a major ascending trend line. This uptrend has demonstrated significant strength, breaking through multiple key resistance levels such as 3820 and 4055, confirming that buyers are in full control of the market.
Currently, the auction has entered an acceleration phase. The price has broken out above its long-term ascending trend line, a significant event that suggests the bullish momentum is increasing. The market is now in a clear expansion phase, trading in new high territory after leaving the prior structure behind.
My scenario for the development of events is a classic breakout and retest of this major trend line. I believe the price will make a corrective pullback to test the broken trend line from above, confirming it as new support. In my opinion, a successful bounce from this line would validate the acceleration and trigger the next impulsive wave higher. The take-profit is therefore set at 4280. Manage your risk!

USD-CAD Will Keep Growing! Buy!
b]Hello,Traders!
USDCAD is holding firmly above the horizontal demand area, showing bullish SMC structure and continuation potential. A retest of the demand zone could attract more buyers toward the 1.4100$ target. Time Frame 6H.
Buy!
Comment and subscribe to help us grow!
Check out other forecasts below too!
Disclosure: I am part of Trade Nation's Influencer program and receive a monthly fee for using their TradingView charts in my analysis.

EURUSD: Sellers in Control, Buyers Waiting for a Comeback👋Hello everyone, what do you think about FX:EURUSD ?
It seems that last week was a favorable one for the Sellers. At the time of writing, EURUSD is trading around 1.162, continuing its downward momentum.
Accordingly, the TVC:DXY index is showing signs of recovery, while the euro remains under pressure from internal political instability and challenges in stimulating growth. These factors have delayed the bullish outlook we previously expected for EURUSD.
From a technical perspective, the pair has reversed after encountering a strong resistance zone marked on the chart. The price has broken below the trendline, with the current target aiming toward the support area to find new momentum. From there, if buyers gain enough strength, the 1.1900 level will be the next upside o
From my personal view, I expect the retracement to continue in the short term, though I remain optimistic in the medium to long term.
And you — what’s your view on EURUSD? 💬Share your thoughts in the comments below!

SILVER Will Go Lower From Resistance! Sell!
Please, check our technical outlook for SILVER.
Time Frame: 1D
Current Trend: Bearish
Sentiment: Overbought (based on 7-period RSI)
Forecast: Bearish
The market is approaching a significant resistance area 5,316.9.
Due to the fact that we see a positive bearish reaction from the underlined area, I strongly believe that sellers will manage to push the price all the way down to 4,596.2 level.
P.S
We determine oversold/overbought condition with RSI indicator.
When it drops below 30 - the market is considered to be oversold.
When it bounces above 70 - the market is considered to be overbought.
Like and subscribe and comment my ideas if you enjoy them!

NZDCAD Will Move Higher! Buy!
Please, check our technical outlook for NZDCAD.
Time Frame: 4h
Current Trend: Bullish
Sentiment: Oversold
Forecast: Bullish
The market is trading around a solid horizontal structure 0.805.
The above observations make me that the market will inevitably achieve 0.808 level.
P.S
The term oversold refers to a condition where an asset has traded lower in price and has the potential for a price bounce.
Overbought refers to market scenarios where the instrument is traded considerably higher than its fair value. Overvaluation is caused by market sentiments when there is positive news.
Like and subscribe and comment my ideas if you enjoy them!

Triple Bottom At Rising Support Could Spell High Hopes For EJ!Here on OANDA:EURJPY we can see that Price was able to make a Breakout of the Rising Support to start the week last week and since, has made a Pullback to test the Breakout!
Price on Tuesday was able to make contact with the Rising Support in the 175.5 area and has formed a Triple Bottom Pattern suggesting this strong reversal pattern is aiming for higher prices!
Confirmation on the Triple Bottom Reversal Pattern will come when Price is able to Breakout of the current level holding Price @ 176.3.
Once the Breakout of the Triple Bottom is confirmed, this could generate a great Long opportunity from the 176.3 level to the next Resistance Zone @ 177.7 - 177.9

EUR/JPY BEARS WILL DOMINATE THE MARKET|SHORT
EUR/JPY SIGNAL
Trade Direction: short
Entry Level: 176.253
Target Level: 174.219
Stop Loss: 177.596
RISK PROFILE
Risk level: medium
Suggested risk: 1%
Timeframe: 1D
Disclosure: I am part of Trade Nation's Influencer program and receive a monthly fee for using their TradingView charts in my analysis.
✅LIKE AND COMMENT MY IDEAS✅

EUR/GBP SENDS CLEAR BULLISH SIGNALS|LONG
Hello, Friends!
We are going long on the EUR/GBP with the target of 0.869 level, because the pair is oversold and will soon hit the support line below. We deduced the oversold condition from the price being near to the lower BB band. However, we should use low risk here because the 1W TF is red and gives us a counter-signal.
Disclosure: I am part of Trade Nation's Influencer program and receive a monthly fee for using their TradingView charts in my analysis.
✅LIKE AND COMMENT MY IDEAS✅
