XAUUSD – Favor the BULLISH scenario, trade the price channelMacro backs the bulls: Gold just broke above $4,200/oz on expectations of imminent Fed rate cuts, while geopolitics and renewed US–China trade tensions are sending flows back into safe havens. Such capital typically doesn’t “flip” quickly, so the uptrend still has room.
H1 technicals: Price is moving cleanly inside an ascending channel with clear push–pause rhythms. The lower trendline is providing solid support; the 4.22x area is the nearest footing, with an overhead supply zone at 4.28x–4.30x.
Reference trade plan:
Wait for a pullback to 4,228–4,222 to buy the continuation.
SL: below the channel floor around 4,196–4,200 to avoid noise.
TP1: 4,250, TP2: 4,272, TP3: 4,295–4,305 (scale out into the supply zone).
M-forex

GOLD sets new record amid global risk waveSpot OANDA:XAUUSD continued to break out in the Asian trading session on Thursday morning (October 16), hitting a record high of $4,239.07/ounce, as investors increasingly sought the precious metal as a safe haven from increasingly complex fluctuations in the global economy.
In the previous session, gold closed at $4,207.85/ounce, up $65.94 (equivalent to 1.59%), and continued to increase by more than $25 today. Since the beginning of the week, gold prices have increased by nearly 5%, continuing a strong upward trend since mid-August.
The rise in gold prices comes as the US Federal Reserve (Fed) signals it will maintain its easy monetary policy path. Speaking this week, Fed Chairman Jerome Powell said the central bank is “on track” to cut its benchmark interest rate by another 0.25% later this month, in response to signs of weakening growth and external uncertainty. Lower borrowing costs typically increase the appeal of non-yielding gold compared to bonds and currencies.
Meanwhile, US President Donald Trump’s latest comments have added to the market’s tension. Responding to a reporter’s question about trade relations with China, Mr. Trump said: “Yes, we are in a trade war right now.”
This statement, quoted by Bloomberg News, has raised concerns about long-term damage to the global economy, a factor that often drives capital flows to safe-haven assets such as gold.
In addition, the risk of a US government shutdown and the “downdraft effect” when investors simultaneously sell bonds and foreign currencies to switch to holding gold and safe-haven assets, further strengthening the precious metal’s price increase.
Strong central bank gold buying has also played a significant role in the rally. Personally, I believe that much of this year’s rally has been “driven by physical demand”, as many central banks “aggressively add to reserves to hedge against sovereign debt risks and expansionary monetary policies”.
So far, gold prices have risen more than 60% in 2025, reflecting a clear shift in global investment thinking, where gold has once again asserted its central role as a source of financial confidence in times of political and monetary uncertainty.
Technical Analysis OANDA:XAUUSD
Spot XAUUUSD continues to maintain a strong uptrend, currently trading around $4,239/ounce, up nearly 0.75% on the day and approaching the 0.618 Fibonacci resistance zone at $4,213 – $4,286, corresponding to the top of the short-term rising channel.
Trend Structure
• The medium-term uptrend remains solid, with a series of steadily rising candles and the MA50 maintaining a strong upward slope, reinforcing the bullish momentum.
• The uptrend channel remains effective, with prices currently hovering at the upper boundary of the channel, indicating that the buying momentum is too strong in the short term.
• The RSI remains above 70, indicating a technically overbought state, but there is no clear reversal signal yet; this usually signals a slight correction before the uptrend continues.
Key Technical Zones
• Resistance: 4.286 (0.786 Fib) and 4.378 (100% extension target).
• Support: 4.162 (0.5 Fib), 4.059 (old confluence – dynamic support), further 3.947 (balance).
Intraday Scenario
• The main trend remains bullish, but the risk of a short-term correction increases as prices approach the Fibonacci resistance zone.
• Day traders can wait for a buyback around $4,160 – $4,180, the confluence between the 0.5 Fib and the midline of the rising channel, where bottom-fishing buying is likely to emerge.
• The short-term target is $4,280 – $4,300/oz, corresponding to the upper boundary of the rising channel.
• Technical stop-loss should be placed below $4,050 (psychological support and short-term MA).
Overview
Speculative money still dominates, but the market is showing signs of needing a “technical breather” to consolidate the new price base. In the context of the Fed easing signals and escalating geopolitical tensions, the main uptrend of gold is not yet threatened, but short-term trading should prioritize the strategy of buying on corrections instead of chasing high prices.
SELL XAUUSD PRICE 4298 - 4296⚡️
↠↠ Stop Loss 4302
→Take Profit 1 4290
↨
→Take Profit 2 4284
BUY XAUUSD PRICE 4144 - 4146⚡️
↠↠ Stop Loss 4140
→Take Profit 1 4152
↨
→Take Profit 2 4158

Potential bearish drop off?USD/JPY has rejected off the pivot which is an overlap resistance and oculd drop to the 1st support.
Pivot: 151.14
1st Suport: 148.79
1st Resistance: 153.11
Disclaimer:
The above opinions given constitute general market commentary, and do not constitute the opinion or advice of IC Markets or any form of personal or investment advice.
Any opinions, news, research, analyses, prices, other information, or links to third-party sites contained on this website are provided on an "as-is" basis, are intended only to be informative, is not an advice nor a recommendation, nor research, or a record of our trading prices, or an offer of, or solicitation for a transaction in any financial instrument and thus should not be treated as such. The information provided does not involve any specific investment objectives, financial situation and needs of any specific person who may receive it. Please be aware, that past performance is not a reliable indicator of future performance and/or results. Past Performance or Forward-looking scenarios based upon the reasonable beliefs of the third-party provider are not a guarantee of future performance. Actual results may differ materially from those anticipated in forward-looking or past performance statements. IC Markets makes no representation or warranty and assumes no liability as to the accuracy or completeness of the information provided, nor any loss arising from any investment based on a recommendation, forecast or any information supplied by any third-party.

NZDJPY to find buyers at previous swing low?NZDJPY - 24h expiry
The previous swing low is located at 85.56.
85.38 has been pivotal.
50 4week EMA is at 85.66.
Early pessimism is likely to lead to losses although extended attempts lower are expected to fail.
Dip buying offers good risk/reward.
We look to Buy at 85.67 (stop at 85.17)
Our profit targets will be 87.17 and 87.37
Resistance: 86.84 / 87.46 / 87.75
Support: 86.33 / 86.00 / 85.38
Risk Disclaimer
The trade ideas beyond this page are for informational purposes only and do not constitute investment advice or a solicitation to trade. This information is provided by Signal Centre, a third-party unaffiliated with OANDA, and is intended for general circulation only. OANDA does not guarantee the accuracy of this information and assumes no responsibilities for the information provided by the third party. The information does not take into account the specific investment objectives, financial situation, or particular needs of any particular person. You should take into account your specific investment objectives, financial situation, and particular needs before making a commitment to trade, including seeking, under a separate engagement, as you deem fit.
You accept that you assume all risks in independently viewing the contents and selecting a chosen strategy.
Where the research is distributed in Singapore to a person who is not an Accredited Investor, Expert Investor or an Institutional Investor, Oanda Asia Pacific Pte Ltd (“OAP“) accepts legal responsibility for the contents of the report to such persons only to the extent required by law. Singapore customers should contact OAP at 6579 8289 for matters arising from, or in connection with, the information/research distributed.

EUR/USD | EURUSD Breakdown Alert: Could It Drop Toward 1.1565?By analyzing the EUR/USD chart on the 2-hour timeframe, we can see that the price is currently trading around 1.162 .
If it manages to hold below the 1.164 level, we could expect further downside movement from the Euro.
The next potential bearish targets are 1.160, 1.158, and 1.1565 .
Please support me with your likes and comments to motivate me to share more analysis with you and share your opinion about the possible trend of this chart with me !
Best Regards , Arman Shaban

Use Average as Resistance for GoldGold is rising rapidly, making this a risky trade. The 21-period EMA usually works well for gold on the 15-minute timeframe. With a trailing stop set just above the moving average, I’m planning to target the trendline.

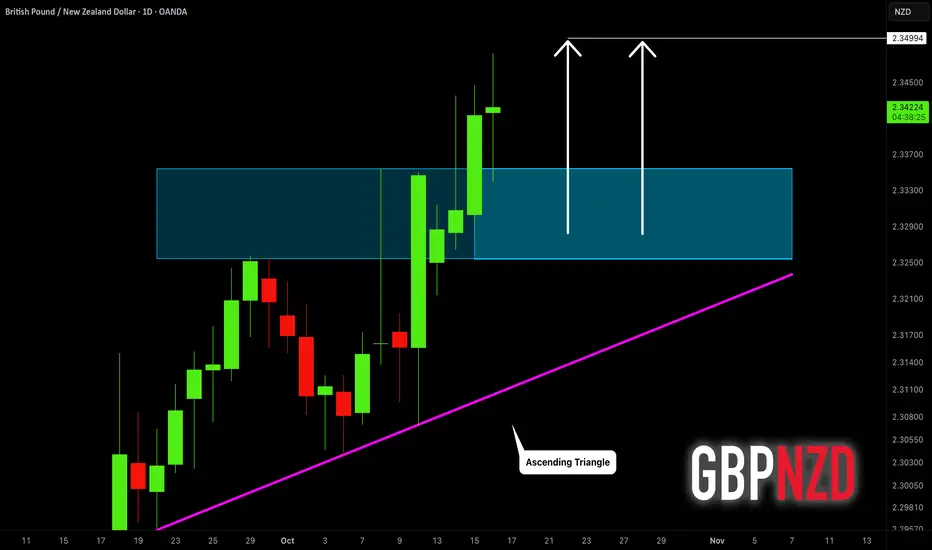
GBPNZD: Bull Run Continues 🇬🇧🇳🇿
GBPNZD will likely grow more following a confirmed
breakout of a resistance of an ascending triangle pattern on a daily.
Next resistance is 2.35
❤️Please, support my work with like, thank you!❤️
EURUSD H4 | Bearish Reversal Off 78.6% Fibonacci ResistanceThe price is rising towards the sell entry, which is a pullback resistance that aligns with the 78.6% Fibonacci retracement and could potentially reverse to the downside from this level.
Sell entry is at 1.1718, which is a pullback resistance that lines up with the 78.6% Fibonacci retracement.
Stop loss is at 1.1776, which is a pullback resistance that lines up with the 61.8% Fibonacci retracement.
Take profit is at 1.1615, which is an overlap support.
High Risk Investment Warning
Trading Forex/CFDs on margin carries a high level of risk and may not be suitable for all investors. Leverage can work against you.
Stratos Markets Limited (tradu.com ):
CFDs are complex instruments and come with a high risk of losing money rapidly due to leverage. 65% of retail investor accounts lose money when trading CFDs with this provider. You should consider whether you understand how CFDs work and whether you can afford to take the high risk of losing your money.
Stratos Europe Ltd (tradu.com ):
CFDs are complex instruments and come with a high risk of losing money rapidly due to leverage. 66% of retail investor accounts lose money when trading CFDs with this provider. You should consider whether you understand how CFDs work and whether you can afford to take the high risk of losing your money.
Stratos Global LLC (tradu.com ):
Losses can exceed deposits.
Please be advised that the information presented on TradingView is provided to Tradu (‘Company’, ‘we’) by a third-party provider (‘TFA Global Pte Ltd’). Please be reminded that you are solely responsible for the trading decisions on your account. There is a very high degree of risk involved in trading. Any information and/or content is intended entirely for research, educational and informational purposes only and does not constitute investment or consultation advice or investment strategy. The information is not tailored to the investment needs of any specific person and therefore does not involve a consideration of any of the investment objectives, financial situation or needs of any viewer that may receive it. Kindly also note that past performance is not a reliable indicator of future results. Actual results may differ materially from those anticipated in forward-looking or past performance statements. We assume no liability as to the accuracy or completeness of any of the information and/or content provided herein and the Company cannot be held responsible for any omission, mistake nor for any loss or damage including without limitation to any loss of profit which may arise from reliance on any information supplied by TFA Global Pte Ltd.
The speaker(s) is neither an employee, agent nor representative of Tradu and is therefore acting independently. The opinions given are their own, constitute general market commentary, and do not constitute the opinion or advice of Tradu or any form of personal or investment advice. Tradu neither endorses nor guarantees offerings of third-party speakers, nor is Tradu responsible for the content, veracity or opinions of third-party speakers, presenters or participants.

USDCHF Watching 0.80900 Resistance as Downtrend ExtendsHey Traders,
In today’s session, we’re monitoring USDCHF for a selling opportunity around the 0.80900 zone. The pair remains in a clear downtrend, with price currently in a corrective phase approaching a key resistance area near 0.80900.
A rejection from this level could reaffirm bearish momentum, potentially opening the door for another leg lower in line with the prevailing trend.
Trade safe,
Joe.

EURJPY What Next? SELL!
My dear followers,
I analysed this chart on EURJPY and concluded the following:
The market is trading on 176.39 pivot level.
Bias - Bearish
Technical Indicators: Both Super Trend & Pivot HL indicate a highly probable Bearish continuation.
Target - 176.05
Safe Stop Loss - 176.59
About Used Indicators:
A super-trend indicator is plotted on either above or below the closing price to signal a buy or sell. The indicator changes color, based on whether or not you should be buying. If the super-trend indicator moves below the closing price, the indicator turns green, and it signals an entry point or points to buy.
Disclosure: I am part of Trade Nation's Influencer program and receive a monthly fee for using their TradingView charts in my analysis.
———————————
WISH YOU ALL LUCK

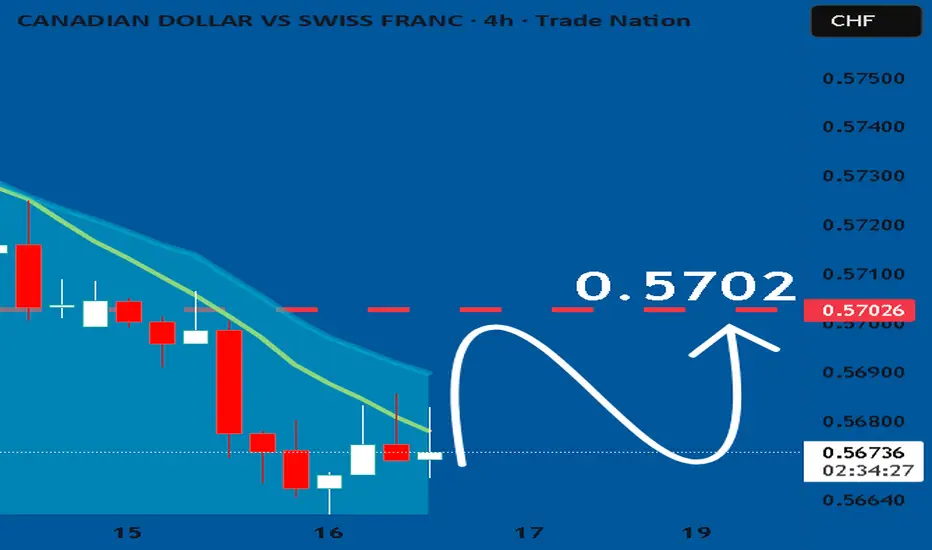
CADCHF: Bulls Will Push Higher
Looking at the chart of CADCHF right now we are seeing some interesting price action on the lower timeframes. Thus a local move up seems to be quite likely.
Disclosure: I am part of Trade Nation's Influencer program and receive a monthly fee for using their TradingView charts in my analysis.
❤️ Please, support our work with like & comment! ❤️
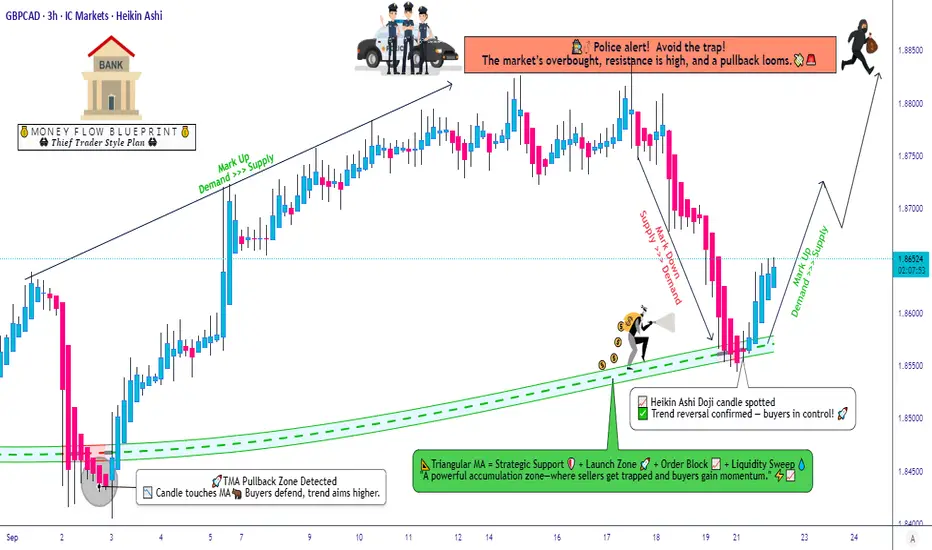
GBP/CAD Technical Outlook: Layered Entry Strategy Explained🤑 GBP/CAD: "Pound vs. Loonie Heist" — Swing/Day Trade Wealth Map 🚀
🎉 Ladies & Gentlemen, welcome to the Thief’s Lair! Buckle up for a slick, professional, and slightly cheeky GBP/CAD trading plan that’s ready to snatch profits from the Forex market! This Pound vs. Loonie Dollar setup is primed for action with a bullish vibe, confirmed by technicals that scream “Let’s ride!” 😎 Let’s break it down with style and precision to make those pips rain! 💸
📈 The Setup: Bullish Bandits on the Move! 🦸♂️
🔍 Market Mood: Bullish momentum confirmed! 📈 The Triangular Moving Average (TMA) shows a solid 38.2% Fibonacci pullback, signaling a textbook retracement.
🕯️ Heikin Ashi Power: Doji candles are flashing bullish strength 💪, with institutional riders joining the party. The trend is our friend, and it’s time to hop on!
🌍 Why GBP/CAD?: The Pound is flexing against the Loonie, backed by macroeconomic vibes like UK economic resilience and CAD’s sensitivity to oil price swings. Keep an eye on crude oil moves for extra context! 🛢️
🕵️♂️ The Thief’s Strategy: Layered Limit Order Heist 🏦
🎯 Entry Plan: We’re setting up a sneaky layered limit order strategy to maximize our entries. Stack those buy limits like a pro thief stacking cash! 💰
📊 Buy Limit Layers:
1.85800 🟢
1.86000 🟢
1.86200 🟢
1.86500 🟢
💡 Pro Tip: Feel free to add more layers based on your risk appetite! Customize your heist to fit your style. 😎
❓ Why Layering?: This approach lets us scale into the trade, catching the best entries as the market dances around our levels. It’s like setting multiple traps for the pips! 🕸️
🛑 Stop Loss: Protect Your Loot! 🔒
🚨 Thief’s SL: Set at 1.85400 to keep our risk tight. This level sits below key support, giving us room to breathe while dodging market traps.
📝 Note: Dear Thief OG’s, this SL is my suggestion, but you’re the boss of your bucks! Adjust based on your risk tolerance and account size. 💼
🎯 Take Profit: Cash Out Before the Cops Close In! 👮♂️
🏆 Target: Aim for 1.88500, where strong resistance meets an overbought RSI zone. The market’s screaming “trap ahead!” so let’s grab profits and ghost! 👻
📝 Note: Thief OG’s, this TP is my call, but you decide when to pocket the cash. Take profits at your own risk and vibe! 💸
🔗 Related Pairs to Watch
Because GBP/CAD doesn’t move alone, here are correlations worth tracking:
💷 GBP/USD ( FX:GBPUSD ) → Often mirrors GBP momentum against the dollar.
USD/CAD ( OANDA:USDCAD ) → Strong CAD moves can spill over to GBP/CAD.
EUR/CAD ( OANDA:EURCAD ) → CAD correlation check.
Gold ( OANDA:XAUUSD ) → Sometimes inverse to CAD (commodity-driven).
Keep these on your radar to confirm strength or weakness in CAD/GBP.
🧠 Key Points to Nail This Trade 🧠
✅ Technical Confirmation: TMA + Fibonacci 38.2% pullback + Heikin Ashi Doji = a high-probability setup.
⚖️ Risk Management: Use the layered entry to spread risk and keep your SL tight to avoid getting caught!
📅 Market Context: Monitor UK economic data (e.g., PMI, BOE updates) and CAD’s oil-driven moves for better timing.
🏃♂️ Escape Plan: Watch for RSI overbought signals near 1.88500 to secure profits before a potential reversal.
⚠️ Disclaimer ⚠️
This is a Thief-Style Trading Strategy crafted for fun and educational purposes. Trading involves risks, and I’m not a financial advisor. Make your moves at your own risk, and always do your own research! 😎
✨ If you find value in my analysis, a 👍 and 🚀 boost is much appreciated — it helps me share more setups with the community!
#GBPCAD #Forex #SwingTrading #DayTrading #ThiefStrategy #ForexCommunity #MarketOutlook #TechnicalAnalysis
Gold price analysis October 17GOLD UPDATE – The uptrend shows no signs of stopping
The gold market is in the most “breathable” phase for the Buyers — almost every BUY strategy has brought profits overnight. The bullish momentum remains strong, showing that money continues to flow into this precious metal.
The next target that Gold is aiming for is around 4450, and any correction can be seen as a “golden” opportunity to join the main trend.
📈 Trading strategy:
BUY Trigger: when a price rejection signal appears at the support zones 4285 – 4242 – 4216
🎯 Target: 4450
👉 In this context, following the Buyers is still the only reasonable option. Observe the price reaction around the support zones and just “press the BUY button” when the signal appears.

EURJPY Will Go Down! Sell!
Take a look at our analysis for EURJPY.
Time Frame: 2h
Current Trend: Bearish
Sentiment: Overbought (based on 7-period RSI)
Forecast: Bearish
The price is testing a key resistance 176.242.
Taking into consideration the current market trend & overbought RSI, chances will be high to see a bearish movement to the downside at least to 175.779 level.
P.S
Please, note that an oversold/overbought condition can last for a long time, and therefore being oversold/overbought doesn't mean a price rally will come soon, or at all.
Like and subscribe and comment my ideas if you enjoy them!

BITCOIN SHORT FROM RESISTANCE
BITCOIN SIGNAL
Trade Direction: short
Entry Level: 111,579.80
Target Level: 109,830.73
Stop Loss: 112,744.35
RISK PROFILE
Risk level: medium
Suggested risk: 1%
Timeframe: 1h
Disclosure: I am part of Trade Nation's Influencer program and receive a monthly fee for using their TradingView charts in my analysis.
✅LIKE AND COMMENT MY IDEAS✅

EURGBP Will Explode! BUY!
My dear friends,
EURGBP looks like it will make a good move, and here are the details:
The market is trading on 0.8689 pivot level.
Bias - Bullish
Technical Indicators: Supper Trend generates a clear Bullish signal while Pivot Point HL is currently determining the overall Bullish trend of the market.
Goal - 0.8699
About Used Indicators:
Pivot points are a great way to identify areas of support and resistance, but they work best when combined with other kinds of technical analysis
Disclosure: I am part of Trade Nation's Influencer program and receive a monthly fee for using their TradingView charts in my analysis.
———————————
WISH YOU ALL LUCK

AUDUSD H4 | Bearish ContinuationBased on the H4 chart analysis, we can see that the price has rejected off the sell entry which i a pullback resistance that aligns with the 50% Fibonacci retracement and could drop from this level to the downside.
Sell entry is at 0.6530, which is a pullback resistance that lines up with the 50% Fibnacci retracement.
Stop loss is at 0.6559, whichis a pullback resistance that is sliglty belw the 78.6% Fibonacci retracement.
Take profit is at 0.6419, which a swing low support.
High Risk Investment Warning
Trading Forex/CFDs on margin carries a high level of risk and may not be suitable for all investors. Leverage can work against you.
Stratos Markets Limited (tradu.com ):
CFDs are complex instruments and come with a high risk of losing money rapidly due to leverage. 65% of retail investor accounts lose money when trading CFDs with this provider. You should consider whether you understand how CFDs work and whether you can afford to take the high risk of losing your money.
Stratos Europe Ltd (tradu.com ):
CFDs are complex instruments and come with a high risk of losing money rapidly due to leverage. 66% of retail investor accounts lose money when trading CFDs with this provider. You should consider whether you understand how CFDs work and whether you can afford to take the high risk of losing your money.
Stratos Global LLC (tradu.com ):
Losses can exceed deposits.
Please be advised that the information presented on TradingView is provided to Tradu (‘Company’, ‘we’) by a third-party provider (‘TFA Global Pte Ltd’). Please be reminded that you are solely responsible for the trading decisions on your account. There is a very high degree of risk involved in trading. Any information and/or content is intended entirely for research, educational and informational purposes only and does not constitute investment or consultation advice or investment strategy. The information is not tailored to the investment needs of any specific person and therefore does not involve a consideration of any of the investment objectives, financial situation or needs of any viewer that may receive it. Kindly also note that past performance is not a reliable indicator of future results. Actual results may differ materially from those anticipated in forward-looking or past performance statements. We assume no liability as to the accuracy or completeness of any of the information and/or content provided herein and the Company cannot be held responsible for any omission, mistake nor for any loss or damage including without limitation to any loss of profit which may arise from reliance on any information supplied by TFA Global Pte Ltd.
The speaker(s) is neither an employee, agent nor representative of Tradu and is therefore acting independently. The opinions given are their own, constitute general market commentary, and do not constitute the opinion or advice of Tradu or any form of personal or investment advice. Tradu neither endorses nor guarantees offerings of third-party speakers, nor is Tradu responsible for the content, veracity or opinions of third-party speakers, presenters or participants.

USD-CAD Will Keep Growing! Buy!
b]Hello,Traders!
USDCAD is holding firmly above the horizontal demand area, showing bullish SMC structure and continuation potential. A retest of the demand zone could attract more buyers toward the 1.4100$ target. Time Frame 6H.
Buy!
Comment and subscribe to help us grow!
Check out other forecasts below too!
Disclosure: I am part of Trade Nation's Influencer program and receive a monthly fee for using their TradingView charts in my analysis.

Unemployment Rate Rises, US-China Tensions Push AUD to 0.64000?The Australian Dollar (AUD) is under strong pressure against the USD. Market concerns about the Australian economy are growing, with the unemployment rate rising to 4.5% in September, the highest level in nearly 4 years. This has led to expectations that the Reserve Bank of Australia (RBA) will cut interest rates in November, further weakening the AUD.
Additionally, US-China trade tensions continue to escalate, with China tightening control over rare earth exports and export licenses, raising concerns about global supply chains. Although the USD is weakening due to expectations that the Fed will cut interest rates, the AUD is still negatively affected by these factors.
The AUD/USD chart clearly shows a downtrend, with lower highs and lower lows. The price is currently trading in a downward channel and is testing the support level at 0.64400. If this support level is broken, the price could continue to decline toward 0.64000.

XAUUSD Builds Upward PressureGold continues to trade within a strong upward trajectory,showing consistent momentum and firm buyer engagement.The market structure indicates ongoing accumulation,with price maintaining stability after minor corrective movements.Buy-side activity remains dominant,reflecting confidence among institutional participants as the metal sustains its trend within an orderly channel.While short-term pullbacks may occur for liquidity rebalancing,the broader outlook remains decisively bullish as long as momentum persists and demand continues to support higher valuations.

Bearish drop?AUD/CAD has rejected off the pivot, which is a pullback resistance and could drop to the 1st support, which aligns with the 78.6% Fibonacci projection.
Pivot: 0.91529
1st Support: 0.90179
1st Resistance: 0.92279
Disclaimer:
The above opinions given constitute general market commentary, and do not constitute the opinion or advice of IC Markets or any form of personal or investment advice.
Any opinions, news, research, analyses, prices, other information, or links to third-party sites contained on this website are provided on an "as-is" basis, are intended only to be informative, is not an advice nor a recommendation, nor research, or a record of our trading prices, or an offer of, or solicitation for a transaction in any financial instrument and thus should not be treated as such. The information provided does not involve any specific investment objectives, financial situation and needs of any specific person who may receive it. Please be aware, that past performance is not a reliable indicator of future performance and/or results. Past Performance or Forward-looking scenarios based upon the reasonable beliefs of the third-party provider are not a guarantee of future performance. Actual results may differ materially from those anticipated in forward-looking or past performance statements. IC Markets makes no representation or warranty and assumes no liability as to the accuracy or completeness of the information provided, nor any loss arising from any investment based on a recommendation, forecast or any information supplied by any third-party.

Bullish reversal off major support?NZD/JPY is falling towards the pivot, which is a multi-swing low support level and could bounce to the pullback resistance.
Pivot: 85.65
1st Support: 84.74
1st Resistance: 86.43
Disclaimer:
The above opinions given constitute general market commentary, and do not constitute the opinion or advice of IC Markets or any form of personal or investment advice.
Any opinions, news, research, analyses, prices, other information, or links to third-party sites contained on this website are provided on an "as-is" basis, are intended only to be informative, is not an advice nor a recommendation, nor research, or a record of our trading prices, or an offer of, or solicitation for a transaction in any financial instrument and thus should not be treated as such. The information provided does not involve any specific investment objectives, financial situation and needs of any specific person who may receive it. Please be aware, that past performance is not a reliable indicator of future performance and/or results. Past Performance or Forward-looking scenarios based upon the reasonable beliefs of the third-party provider are not a guarantee of future performance. Actual results may differ materially from those anticipated in forward-looking or past performance statements. IC Markets makes no representation or warranty and assumes no liability as to the accuracy or completeness of the information provided, nor any loss arising from any investment based on a recommendation, forecast or any information supplied by any third-party.

EURUSD Bulls Cheer Powell’s Hint at Ending QTEURUSD has turned flat after approaching the key 1.15 support. The 1.1540–1.1635 zone is now being tested to the upside after Powell opened the door to two rate cuts for the rest of the year and, perhaps more importantly, gave an early signal of ending quantitative tightening (QT).
If 1.1635 breaks, the next upside target could be the 1.1690–1.1705 zone.
