NZD-JPY Local Long! Buy!
Hello,Traders!
NZDJPY tapped the discount zone inside horizontal demand after sweeping liquidity, signalling accumulation. If bullish order-flow sustains, expect a repricing toward the premium buy-side target above. Time Frame 3H.
Buy!
Comment and subscribe to help us grow!
Check out other forecasts below too!
Disclosure: I am part of Trade Nation's Influencer program and receive a monthly fee for using their TradingView charts in my analysis.
M-forex

CADJPY DEMAND LEVEL AHEAD|LONG|
✅CADJPY is pulling into the higher-timeframe demand after clearing sell-side liquidity, setting up a bullish reaction. If displacement confirms, algos may reprice toward the next buy-side liquidity target above. Time Frame 10H.
LONG🚀
✅Like and subscribe to never miss a new idea!✅

EURUSD Buy/Long Setup (2H)We are seeing a bullish CH (Change of Character) and a bullish ICH on the chart.
The risk for long positions on the hourly timeframes has decreased, and we are looking for buy/long setups around the demand zone.
The targets are marked on the chart.
A 4-hour candle closing below the invalidation level will invalidate this analysis.
Do not enter the position without capital management and stop setting
Comment if you have any questions
thank you

USD-JPY Bearish Breakout! Sell!
Hello,Traders!
USDJPY broke down from the horizontal supply, leaving clear signs of distribution. A corrective pullback into the zone may precede continuation toward the next sell-side liquidity level below.Time Frame 1H.
Sell!
Comment and subscribe to help us grow!
Check out other forecasts below too!
Disclosure: I am part of Trade Nation's Influencer program and receive a monthly fee for using their TradingView charts in my analysis.

BTCUSD Technical (Bullish Plan)Bitcoin is trading within a well-defined accumulation zone where buyers are gradually stepping in after a corrective move. The chart shows a clear bullish structure forming above local support, indicating that the market is preparing for another upward expansion. As long as price remains protected within this support region, bullish momentum can continue toward the marked Target Points, aligning with previous reaction levels and liquidity zones. The upward arrows highlight the potential continuation path, showing how market structure and volume support the bullish outlook. Overall, this setup reflects a disciplined, structure-based analysis with clear zones, logical targets, and a well-defined trend continuation outlook.

"Heads Down" With Hopes Up For EUFX:EURUSD seems to have found Support at a Weekly Low formed earlier this month.
Now, since having visited this Support, you can notice that price has begun to form a Higher Low suggesting that price action is forming a strong bullish reversal pattern, the Inverse Head and Shoulders!
If price can continue pushing higher to the Neckline once more, this will complete the reversal pattern.
Once the pattern is complete, we will want to wait for a Breakout and Retest to generate potential long opportunities to take the price up to test the overhead resistance levels.

XAU/USD: Bullish Push to 4158?As the previous analysis worked exactly as predicted, FX:XAUUSD is eyeing a bullish push on the 1-hour chart , with price rebounding from a key support zone near cumulative sell liquidation, converging with a potential entry area that could ignite upside momentum if buyers defend against short-term dips. This setup suggests a reversal opportunity amid recent consolidation, targeting higher levels with strong risk-reward.
Entry between 4020-4032 for a long position🎯. Targets at 4158 (main). Set a stop loss at 3990 to limit exposure📊, yielding a risk-reward ratio of approximately 1:3 . Monitor for confirmation via a bullish candle close above entry with rising volume, leveraging gold's safe-haven appeal.🌟
Fundamentally , gold is attempting to stabilize above $4,000 after a sharp pullback, with early signs of a short-term rebound as markets digest fading Fed rate cut hopes and await key US data. Forecasts indicate an average of $3,675/oz by Q4 2025, but recent surges to $4,239 highlight volatility driven by ETF flows and central bank policies. 💡
📝 Trade Setup
🎯 Entry Zone (Long): 4020 – 4032
🎯 Target (TP1): 4158
❌ Stop Loss: 3990
⚖️ Risk-to-Reward: Approximately 1:3, offering a solid reward structure with defined downside.
What's your outlook on this setup? Drop your thoughts below! 👇

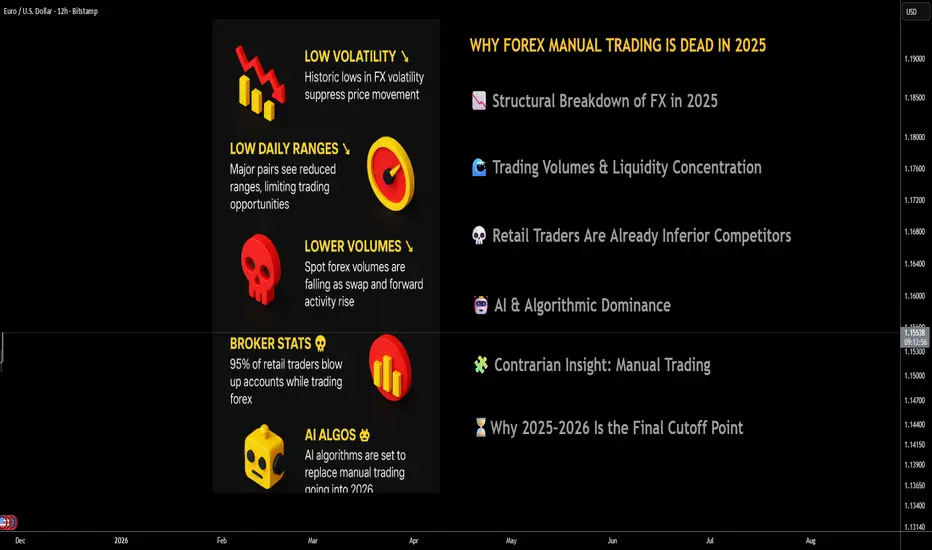
Why Manual Forex Trading Is Officially Dead 📘 Why Manual Forex Trading Is Officially Dead — And AI Will Bury It in 2026
________________________________________
1. 🚨 Executive Summary
Manual FX trading is not merely declining—it is entering its terminal phase. As of 2025, the confluence of record-low volatility, crushed daily ranges, shrinking spot volumes, and hyper-efficient AI execution frameworks has dismantled the edge discretionary traders once possessed.
Regulators report that 74–89% of retail CFD/FX traders lose money, with internal broker statistics showing even higher failure rates—often pushing the informal industry estimate of 90–95% account blow-up rates. The structural market environment now exacerbates those figures: less movement, tighter spreads, and faster AI-driven price formation leave no oxygen for manual decision-making.
The verdict is clear: manual FX trading is no longer a competitive activity—it's an anachronism.
________________________________________
2. 📉 Structural Breakdown of FX in 2025: A Market That No Longer Moves
The fundamental requirement for profitable manual FX trading—price movement—has been suppressed. According to multiple 2023–2024 analyses (Reuters, BIS), FX markets entered a multi-year period of historically subdued volatility, with the CVIX (Currency Volatility Index) sitting near multi-cycle lows.
Major pairs like EUR/USD and USD/JPY are posting 1/3 to 1/2 of their historical daily ranges, compressing intraday opportunity. What used to be 80–120 pip swings are now 30–50 pip oscillations dominated by micro-structure noise rather than directional moves.
In this environment, manual traders have insufficient statistical runway to generate returns, while AI systems can still monetize tiny dislocations at millisecond speed.
________________________________________
3. 🌊 Trading Volumes & Liquidity Concentration: The Game Has Moved On
The 2022 BIS Triennial Survey already documented a shift: spot FX volumes stagnated while swap and forward activity increased, driven by hedging and treasury optimization rather than speculative flows.
By 2025, institutional venues show continued softness in spot volumes, and even the leading eFX platforms reported lower activity during prolonged volatility droughts. This matters because:
• Lower volume = fewer sustained directional trends
• More volume concentrated among algos = fewer exploitable inefficiencies
• Liquidity providers internalize flow before it ever becomes visible to retail charts
Manual trading can’t survive structural liquidity centralization reinforced by machine execution.
________________________________________
4. 💀 Retail Traders Are Already Inferior Competitors and the Data Shows It
Manual traders are not just competing against the market—they are competing against:
• Prime brokers running internal AI risk engines
• HFT firms reading order books at microsecond resolution
• Banks using reinforcement-learning execution algos
ESMA’s regulatory disclosures show 74–89% of retail FX/CFD accounts lose money, but internal broker studies often cite 90–95% destruction rates, especially when volatility is muted.
The brutal truth: manual traders blow up because the game is no longer designed for human reaction speed or intuition.
________________________________________
5. 🤖 AI & Algorithmic Dominance: The 2026 Regime Shift
By 2026, FX will be AI-first, not human-first. Institutional adoption of AI execution is growing double digits annually (per GMI, GrandView), and retail brokers are already rolling out AI-assisted trade generation, AI signal clusters, and AI risk models.
AI advantages include:
• Predictive ability using LSTM/transformers trained on terabytes of tick data
• Zero-latency execution across fragmented liquidity pools
• Ability to profit in low-volatility regimes via microstructure edge
• Adaptive models that rewrite themselves every 24 hours
• No fatigue, no bias, no emotional degradation
In contrast, manual traders operate on slow cognition, subjective pattern recognition, and outdated chart heuristics. This is not a fair fight. Manual trading is no longer a skill—it's an obsolete hobby.
________________________________________
6. 🧩 Contrarian Insight: Manual Trading Isn't Just Dying—It’s Being Engineered Out
Here are non-obvious, high-conviction insights that institutional investors should consider:
(1) Market makers WANT low volatility
Low volatility increases internalization efficiency and reduces hedging costs. Human traders thrive on chaos; AI thrives on order. Who does the system favor?
(2) AI reduces liquidity available to humans
Liquidity is increasingly “dark” inside internal matching engines, meaning price discovery happens before retail traders ever see the candle.
(3) Manual trading can’t survive the “fractionalization” of edge
AI doesn’t need large moves—it monetizes micro-micro-inefficiencies in ways humans never could.
(4) Spread compression kills human R:R ratios
With 0.1–0.3 pip spreads on majors, AI can scalp micro-spreads—humans cannot.
(5) Behavioral inefficiencies have been minimized
Classic manual strategies—breakouts, fib levels, candlestick patterns—worked because humans created predictable behavioral cycles.
Now? AI models detect and arbitrage those behaviors instantly.
The most contrarian conclusion?
Manual trading didn’t die naturally—the market evolved to eliminate it.
________________________________________
7. ⏳Why 2025–2026 Is the Final Cutoff Point
Three forces collide in this window:
1. Volatility compression (structure-driven, not temporary)
2. AI adoption exceeding human adaptability
3. Retail traders facing the worst statistical environment in 15 years
This is the first time in FX history where:
• Human intuition has zero measurable edge
• AI dominance is irreversible
• Market conditions structurally reject manual trading
The past cycles always argued “vol will return.”
In 2025–2026, that is no longer a credible investment thesis.
________________________________________
8. 📈 Implications for Investors & Brokers
Investors should allocate to:
• AI-driven FX funds
• ML-enhanced macro strategies
• Data infrastructure feeding predictive FX models
Brokers should:
• Pivot to AI-based trading tools
• Monetize analytics subscriptions
• Shift away from promoting discretionary trading education
The firms that expect a retail manual trading revival will be structurally misaligned with market evolution.
________________________________________
________________________________________
🔥 Final Conclusion: Manual Traders Will Be Left Behind in 2026
The logic is now overwhelming:
low volatility + low ranges + reduced volumes + AI dominance = endgame for manual FX trading.
Human discretionary trading cannot survive in a marketplace designed for—and increasingly ruled by—data-driven, sub-millisecond, self-learning AI engines.
Manual traders in 2026 will not fight the bots.
They will simply be trading inside a system architected by the bots, reacting slowly to patterns that no longer exist.
The era is over.
The market has moved on.
EURCAD: Bearish Forecast & Bearish Scenario
It is essential that we apply multitimeframe technical analysis and there is no better example of why that is the case than the current EURCAD chart which, if analyzed properly, clearly points in the downward direction.
Disclosure: I am part of Trade Nation's Influencer program and receive a monthly fee for using their TradingView charts in my analysis.
❤️ Please, support our work with like & comment! ❤️

XAUUSD:LIVE TRADEHello friends
Well, we had a decline that we found support for with Fibonacci, and you can see that there was good support from buyers at this point.
We also have a head and shoulders pattern, which is again a positive.
The downtrend line has also been broken, which is also a positive point.
Now, given the arrival of buyers, we can enter the trade and move with it to the specified targets.
Note that the first principle of trading is capital and risk management, so be sure to follow it and avoid emotional behavior.
*Trade safely with us*

USOIL : LIVE TRADEHello friends
Given the bearish structure we had, the price has now been supported by buyers at the specified support several times and we can expect this support to continue.
Observe risk and capital management and avoid emotional and irrational behavior.
*Trade safely with us*

EURAUD: Short Trade Explained
EURAUD
- Classic bearish setup
- Our team expects bearish continuation
SUGGESTED TRADE:
Swing Trade
Short EURAUD
Entry Point - 1.7915
Stop Loss - 1.7940
Take Profit - 1.7869
Our Risk - 1%
Start protection of your profits from lower levels
Disclosure: I am part of Trade Nation's Influencer program and receive a monthly fee for using their TradingView charts in my analysis.
❤️ Please, support our work with like & comment! ❤️

GBPUSD Massive Short! SELL!
My dear friends,
Please, find my technical outlook for GBPUSD below:
The price is coiling around a solid key level - 1.3156
Bias - Bearish
Technical Indicators: Pivot Points High anticipates a potential price reversal.
Super trend shows a clear sell, giving a perfect indicators' convergence.
Goal - 1.3121
About Used Indicators:
The pivot point itself is simply the average of the high, low and closing prices from the previous trading day.
Disclosure: I am part of Trade Nation's Influencer program and receive a monthly fee for using their TradingView charts in my analysis.
———————————
WISH YOU ALL LUCK

EURUSD Under Pressure! SELL!
My dear subscribers,
My technical analysis for EURUSD is below:
The price is coiling around a solid key level - 1.1563
Bias - Bearish
Technical Indicators: Pivot Points Low anticipates a potential price reversal.
Super trend shows a clear sell, giving a perfect indicators' convergence.
Goal - 1.1547
My Stop Loss - 1.1572
About Used Indicators:
By the very nature of the supertrend indicator, it offers firm support and resistance levels for traders to enter and exit trades. Additionally, it also provides signals for setting stop losses
Disclosure: I am part of Trade Nation's Influencer program and receive a monthly fee for using their TradingView charts in my analysis.
———————————
WISH YOU ALL LUCK

Gold Momentum ShiftYesterday's gold momentum shifting towards downside. I'm bullish ahead of US open.

EURUSD Last bounce before a Lower Low.The EURUSD pair continues to trade within its 2-month Channel Down and following the start of the latest Bearish Leg since the November 13 Lower High rejection on the 1D MA50 (blue trend-line), we are now experiencing the first consolidation phase.
Based on the previous Bearish Legs of this pattern, this consolidation could end up in a short-term rebound limited by the 0.786 Fibonacci retracement level, only for it to be rejected and resume the bearish trend.
Both previous rejections eventually made a Lower Low for the Channel Down, hitting the -0.618 Fibonacci extension (minimum), declining in total Bearish Leg terms by at least -2.03%.
As a result, our 1.14200 medium-term Target (still above both conditions) remains valid, but we will close it earlier if we see the price hit the 1D MA200 (orange trend-line) and fail to close the 1D candle below it.
---
** Please LIKE 👍, FOLLOW ✅, SHARE 🙌 and COMMENT ✍ if you enjoy this idea! Also share your ideas and charts in the comments section below! This is best way to keep it relevant, support us, keep the content here free and allow the idea to reach as many people as possible. **
---
💸💸💸💸💸💸
👇 👇 👇 👇 👇 👇

EURGBPEURGBP price is near the support zone 0.87811-0.87663. If the price fails to break through the 0.87663 level, a rebound is likely. Consider buying the red zone.
🔥Trading futures, forex, CFDs and stocks carries a risk of loss.
Please consider carefully whether such trading is suitable for you.
>>GooD Luck 😊
❤️ Like and subscribe to never miss a new idea!

EURUSD Long: Buyers Eye a Push Toward 1.15700 Supply ZoneHello traders! EURUSD continues to trade within a broader bearish market structure, remaining below the long-term Supply Line, which acts as dynamic resistance and keeps the pair under selling pressure. The chart shows several pivot points forming along both the supply trendline and the rising demand trendline, confirming the current wedge-like structure. Earlier, the pair created a Rounding Top Pattern near the upper boundary of the structure, which signaled weakening bullish momentum and triggered a sharp decline toward the Demand Line. After touching the demand trendline around 1.1500, EURUSD formed a strong bullish reaction at the pivot point, showing buyers stepping in to maintain support. However, the recent breakout and retest of minor structure levels still leave the pair below the key 1.15700 Supply Zone, where price has reacted multiple times in the past. This zone aligns with horizontal supply and the descending Supply Line — forming a high-confluence resistance area.
Currently, the pair is attempting to recover toward 1.15700, which is the nearest upside target. If price reaches this level, it may face strong selling pressure once again, as previous breakouts from this zone turned into bearish rejection candles. As long as EURUSD remains trapped between the Demand Line and Supply Line, the overall structure stays corrective and heavily dependent on reactions at these key zones.
My scenario as long as EURUSD holds above the Demand Zone at 1.1500–1.1510, buyers may attempt a short-term recovery toward 1.15700, which acts as the nearest structural resistance. A clean breakout above 1.15700 would confirm bullish strength and could open the way for a deeper correction toward the descending Supply Line. However, if the pair gets rejected at the Supply Zone again, sellers may regain control and push price back toward 1.1510–1.1500, where demand is expected to react. A confirmed break below 1.1500 would invalidate the bullish recovery potential and could signal continuation of the broader bearish trend. For now, EURUSD supports a short-term bullish retracement, but the larger trend remains bearish while price stays below the descending Supply Line. Manage your risk!

USDJPY - Bulls Watching the Intersection Zone!📈USDJPY remains overall bullish, moving steadily inside its rising channel. After a strong impulsive move upward, the pair is now forming a healthy correction, heading toward a key confluence area.
⚔️As price approaches the intersection of the lower trendlines and the demand zone, we will be looking for trend-following longs. This orange area has acted as a strong support multiple times, and with both trendlines meeting there, it becomes a high-probability spot for buyers to step in.
🏹If the bulls defend this zone , USDJPY could resume its upward movement and push toward new highs. Only a clear break below the demand zone would weaken the bullish outlook.
For now, the plan is simple: wait for the retest… then look for longs from structure. 🤔
⚠️ Disclaimer: This is not financial advice. Always do your own research and manage risk properly.
📚 Stick to your trading plan regarding entries, risk, and management.
Good luck! 🍀
All Strategies Are Good; If Managed Properly!
~Richard Nasr

How to build Discipline & Structured Trading HabitsDiscipline is not something you rely on in the moment; it is something you build through habits that remove emotional decision-making from your trading process.
1. Define Rules Before You Trade
Traders without predefined rules rely on emotion. Traders with rules rely on structure.
Clearly define your entry criteria, risk per trade, maximum daily loss, and exit strategy.
When these rules exist before the session starts, you eliminate most impulsive behaviors.
2. Limit Your Daily Decisions
Every decision drains mental energy. The more choices you make, the weaker your discipline becomes.
Reduce the number of markets you watch, the number of setups you take, and the amount of chart time you expose yourself to.
Fewer decisions lead to higher-quality decisions.
3. Use a Pre-Session Checklist
A checklist forces you into a disciplined routine. It can include:
• Reviewing your trading plan
• Checking upcoming news releases
• Confirming your bias or market conditions
• Ensuring your risk settings are correct
The act of going through the checklist prepares your mind to follow structure.
4. Implement a Hard Stop for the Day
One of the fastest ways to lose discipline is to trade while emotional.
Set a maximum daily drawdown. Once it is hit, the session ends. No exceptions.
This protects both your capital and your psychology.
5. Track Your Rule Breaks
Most traders only track wins and losses. Disciplined traders also track deviations.
Write down every time you break a rule, why it happened, and how you plan to prevent it next time.
Over time, this builds awareness and accountability.
6. Delay Impulsive Actions
If you feel the urge to jump into a trade that does not fit your plan, delay the action by 30 to 60 seconds.
Impulses lose power quickly. By introducing a pause, you give your rational mind time to regain control.
7. Keep Your Environment Clean
Distractions destroy discipline.
Silence notifications, close irrelevant tabs, and avoid multitasking.
A clean trading environment supports clean decisions.
8. End Each Session With a Routine
A consistent end-of-day routine reinforces discipline. Examples:
• Rating your discipline on a scale from 1 to 10
• Reviewing whether you followed your rules
• Logging emotional triggers
Ending the day with structure makes it easier to begin the next one with structure.
Conclusion
Discipline is not built through motivation but through habits that create consistent behavior. A structured trading routine removes uncertainty, minimizes emotional influence, and helps you operate like a professional rather than a reactive participant.
NZDJPY: Will Keep Growing! Here is Why:
The recent price action on the NZDJPY pair was keeping me on the fence, however, my bias is slowly but surely changing into the bullish one and I think we will see the price go up.
Disclosure: I am part of Trade Nation's Influencer program and receive a monthly fee for using their TradingView charts in my analysis.
❤️ Please, support our work with like & comment! ❤️

GOLD: Bearish Continuation & Short Trade
GOLD
- Classic bearish formation
- Our team expects fall
SUGGESTED TRADE:
Swing Trade
Sell GOLD
Entry Level - 4130.2
Sl - 4144.7
Tp - 4106.1
Our Risk - 1%
Start protection of your profits from lower levels
Disclosure: I am part of Trade Nation's Influencer program and receive a monthly fee for using their TradingView charts in my analysis.
❤️ Please, support our work with like & comment! ❤️

AUD/USD 2-hour chart Pattern.....AUD/USD 2-hour chart open, with trend lines, Ichimoku cloud, and two “Target Point” markers drawn. From what’s visible:
1. First Target: Around 0.6518 (marked on the chart as the lower target line).
2. Second Target: Around 0.6575 (the higher target line).
These targets appear to be based on a breakout from the descending trendline, with projected upward moves indicated by the vertical arrows.
