USD/CHF: Bearish Drop to 0.7988?FX:USDCHF is showing bearish potential on the 4-hour chart , with price testing a downward trendline as resistance, converging near a good entry point and resistance zone, setting up for a possible downside continuation if sellers regain control amid recent consolidation. This alignment suggests weakening upside momentum in the safe-haven pair.
Entry zone between 0.8051-0.8061 for a short position. Target at 0.7988 near the support zone, providing a risk-reward ratio of approximately 1:2 . Set a stop loss on a close above 0.8084 to safeguard against a reversal. 🌟 Watch for confirmation via a rejection at the entry with increasing volume, driven by USD dynamics against CHF.
Fundamentally , today we have the US PCE annual and monthly indices , released on October 31, 2025, at 12:30 UTC, which could influence USD strength. Additionally, on November 3, 2025, Switzerland's Consumer Price Index will be published, potentially creating volatility in this pair. 💡
📝 Trade Plan:
🎯 Entry Zone: 0.8051 – 0.8061 (short setup near resistance & trendline)
❌ Stop Loss: Close above 0.8084
✅ Target: 0.7988 (support / take profit zone)
💎 Risk-to-Reward: Approximately 1:2, ideal for a clean technical play.
What's your take on this setup? Share below! 👇
M-forex

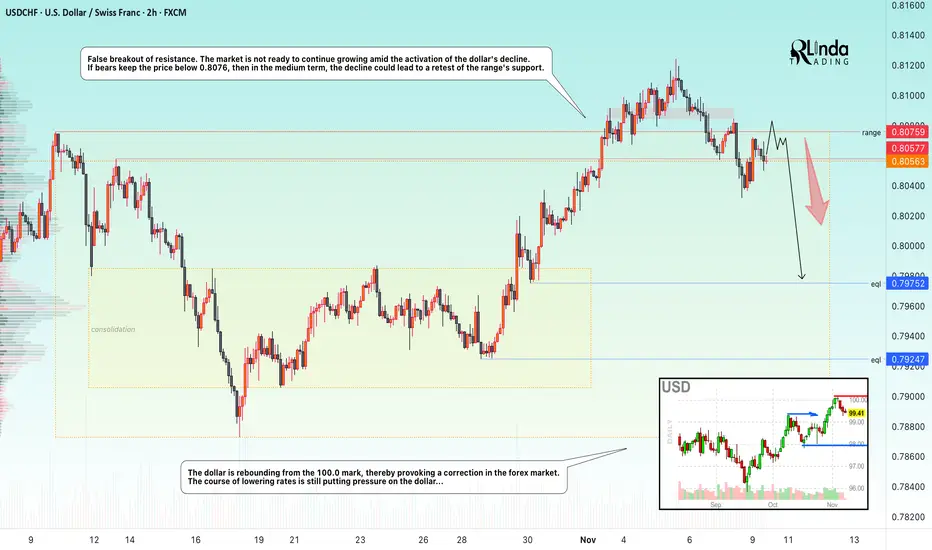
USDCHF → Manipulation? False breakout of resistance FX:USDCHF attempted to take advantage of the trend reversal opportunity after breaking out of a descending wedge, but the weak dollar hindered the rally...
The currency pair is facing resistance at 0.8076. There is no continuation of the momentum towards a breakout, and bearish pressure, which is intensifying as the dollar index declines, is negatively affecting the currency pair. The price has returned to the trading range, with an emphasis on 0.8057 - 0.8076. If the bears keep the price below this zone, this move could trigger further sell-offs.
Resistance levels: 0.8057, 0.8076
Support levels: 0.7957, 0.7925
The false breakout confirms that sellers currently have the upper hand and buyers lack the strength to push the price higher. Accordingly, consolidation below the key level could trigger a further decline towards the zone of interest at 0.7975.
Best regards, R. Linda!
Bearish drop off pullback resistance?GBP/AUD has reacted off the pivot and could drop to the 1st support.
Pivot: 0153
1st Support: 1.9970
1st Resistance: 2.0309
Disclaimer:
The opinions given above constitute general market commentary and do not constitute the opinion or advice of IC Markets or any form of personal or investment advice.
Any opinions, news, research, analyses, prices, other information, or links to third-party sites contained on this website are provided on an "as-is" basis, are intended to be informative only, and are not advice, a recommendation, research, a record of our trading prices, an offer of, or solicitation for, a transaction in any financial instrument and thus should not be treated as such. The information provided does not involve any specific investment objectives, financial situation, or needs of any specific person who may receive it. Please be aware that past performance is not a reliable indicator of future performance and/or results. Past performance or forward-looking scenarios based upon the reasonable beliefs of the third-party provider are not a guarantee of future performance. Actual results may differ materially from those anticipated in forward-looking or past performance statements. IC Markets makes no representation or warranty and assumes no liability as to the accuracy or completeness of the information provided, nor any loss arising from any investment based on a recommendation, forecast, or any information supplied by any third party.

Bullish momentum to extend?EUR/JPY could fall to the pivot, which acts as pullback support, and may bounce to the 1st resistance.
Pivot: 178.54
1st Support: 177.79
1st Resistance: 179.75
Disclaimer:
The opinions given above constitute general market commentary and do not constitute the opinion or advice of IC Markets or any form of personal or investment advice.
Any opinions, news, research, analyses, prices, other information, or links to third-party sites contained on this website are provided on an "as-is" basis, are intended to be informative only, and are not advice, a recommendation, research, a record of our trading prices, an offer of, or solicitation for, a transaction in any financial instrument and thus should not be treated as such. The information provided does not involve any specific investment objectives, financial situation, or needs of any specific person who may receive it. Please be aware that past performance is not a reliable indicator of future performance and/or results. Past performance or forward-looking scenarios based upon the reasonable beliefs of the third-party provider are not a guarantee of future performance. Actual results may differ materially from those anticipated in forward-looking or past performance statements. IC Markets makes no representation or warranty and assumes no liability as to the accuracy or completeness of the information provided, nor any loss arising from any investment based on a recommendation, forecast, or any information supplied by any third party.

Bearish drop off?EUR/CAD has rejected at the pivot and could drop to the 1st support, which acts as swing low support.
Pivot: 1.6249
1st Support: 1.61407
1st Resistance: 1.63091
Disclaimer:
The opinions given above constitute general market commentary and do not constitute the opinion or advice of IC Markets or any form of personal or investment advice.
Any opinions, news, research, analyses, prices, other information, or links to third-party sites contained on this website are provided on an "as-is" basis, are intended to be informative only, and are not advice, a recommendation, research, a record of our trading prices, an offer of, or solicitation for, a transaction in any financial instrument and thus should not be treated as such. The information provided does not involve any specific investment objectives, financial situation, or needs of any specific person who may receive it. Please be aware that past performance is not a reliable indicator of future performance and/or results. Past performance or forward-looking scenarios based upon the reasonable beliefs of the third-party provider are not a guarantee of future performance. Actual results may differ materially from those anticipated in forward-looking or past performance statements. IC Markets makes no representation or warranty and assumes no liability as to the accuracy or completeness of the information provided, nor any loss arising from any investment based on a recommendation, forecast, or any information supplied by any third party.


When a Few Pips Teach You More Than a Winning TradeYesterday, my stop loss got hit.
Not because my analysis was wrong, but because I mismanaged it.
A few pips, that’s all it took to turn a good setup into a loss.
And honestly, it’s not the first time. It’s happened three times just this week.
At first, I was frustrated. I kept replaying the chart in my head, thinking how easily it could’ve been avoided.
But after sitting with it for a while, I realized something deeper, this wasn’t a technical mistake. It was a mental one.
In trading, the hardest battle isn’t on the screen, it’s in your own head.
You move your SL thinking, “Maybe it just needs more space.”
You ignore your rules because you don’t want to be wrong.
And before you know it, emotion quietly takes the driver’s seat.
Those few pips weren’t a loss. They were a lesson.
A reminder that trading is 80% psychology, 20% execution.
That discipline matters more than being right.
So yes, my SL got hit, again.
But this time, it hit differently.
Because I didn’t just lose a trade.
I gained awareness.
Every stop loss is feedback.
Every mistake is a mirror.
And if you listen closely, the market always teaches what you most need to learn.

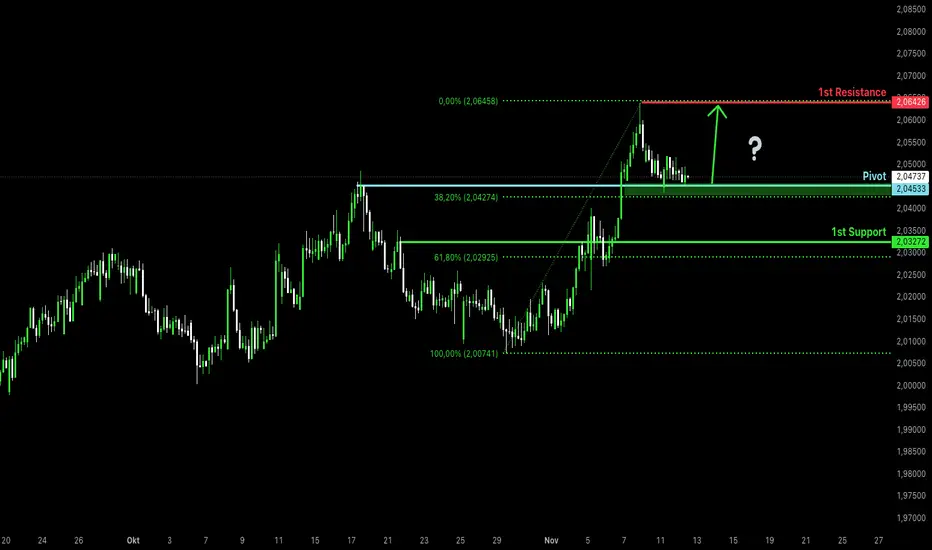
Bullish continuation?EUR/NZD is reacting off the pivot, which serves as a pullback support, and could bounce toward the 1st resistance, which acts as swing high resistance.
Pivot: 2.04533
1st Support: 2.03272
1st Resistance: 2.05426
Disclaimer:
The opinions given above constitute general market commentary and do not constitute the opinion or advice of IC Markets or any form of personal or investment advice.
Any opinions, news, research, analyses, prices, other information, or links to third-party sites contained on this website are provided on an "as-is" basis, are intended to be informative only, and are not advice, a recommendation, research, a record of our trading prices, an offer of, or solicitation for, a transaction in any financial instrument and thus should not be treated as such. The information provided does not involve any specific investment objectives, financial situation, or needs of any specific person who may receive it. Please be aware that past performance is not a reliable indicator of future performance and/or results. Past performance or forward-looking scenarios based upon the reasonable beliefs of the third-party provider are not a guarantee of future performance. Actual results may differ materially from those anticipated in forward-looking or past performance statements. IC Markets makes no representation or warranty and assumes no liability as to the accuracy or completeness of the information provided, nor any loss arising from any investment based on a recommendation, forecast, or any information supplied by any third party.
4130-4150 Resistace Test for GoldGold has reached the 4130-4150 resistance zone, now it is time to cool off a bit. I was a little late writing this here, my entry is close to 4135 half size but it it get 4145 again i plan to buy the other half. If 4150 broken, the idea will fail so I will place my stops accordingly. I also plan to enter long from the take profit level but not 100% sure yet.

a BuySide QuickScalp #GBPJPY 📌 Market Insight: {#GBPJPY }
⚠️ Risk Assessment: {High}
🚀 Approach:
Not a bad Structure , we need momentum first then a nice LTF entry sign .
#Ash_TheTrader #Forex #GBPJPY #MarketAnalysis #TradingSetup #RiskManagement #GOLD #Scalper #NQ #EURUSD

Bearish drop off?EUR/NOK has reacted off the pivot and could drop to the 1st support, which acts as a swing low support.
Pivot: 1.67941
1st Support: 1.57510
1st Resistance: 11.72323
Disclaimer:
The opinions given above constitute general market commentary and do not constitute the opinion or advice of IC Markets or any form of personal or investment advice.
Any opinions, news, research, analyses, prices, other information, or links to third-party sites contained on this website are provided on an "as-is" basis, are intended to be informative only, and are not advice, a recommendation, research, a record of our trading prices, an offer of, or solicitation for, a transaction in any financial instrument and thus should not be treated as such. The information provided does not involve any specific investment objectives, financial situation, or needs of any specific person who may receive it. Please be aware that past performance is not a reliable indicator of future performance and/or results. Past performance or forward-looking scenarios based upon the reasonable beliefs of the third-party provider are not a guarantee of future performance. Actual results may differ materially from those anticipated in forward-looking or past performance statements. IC Markets makes no representation or warranty and assumes no liability as to the accuracy or completeness of the information provided, nor any loss arising from any investment based on a recommendation, forecast, or any information supplied by any third party.

Solana Battle at 150!Hello, is everyone watching Solana (SOLUSDT) fight?
Currently, SOLUSDT is still under downward pressure after breaking the old support zone (new resistance) and the price continues to be rejected at the main trendline resistance.
The 150-160 zone is acting as an important reaction zone, a short technical recovery may appear before continuing to decrease when it cannot hold this zone.
On the other hand, the market shows signs of altcoin cash flow weakening slightly when BTC is regaining its capitalization advantage.
In addition, the liquidity of the crypto market at the beginning of the week has not clearly recovered, making SOL's recovery difficult to sustain.
In my personal opinion, when breaking through the current support zone, the possibility of going down to the 130-140 zone is quite high.
What do you think, is this zone worth observing for short-term shorts? Or should we wait for a clearer signal in the small frame?
Share your views in the comments below!

Gold price analysis todayXAUUSD Update — Hold the structure, wait for a quality BUY setup
Currently, the gold chart has no major structural changes — the market is in a correction phase at an important resistance zone. This is a “consolidation” phase before the next trend becomes more obvious, so the priority is to be patient and wait for a high probability setup.
If you are holding a SELL position from the resistance zone, the current strategy is to hold the order and manage profits — wait for a reaction at the support zones to decide to close/open more. For those looking for BUY opportunities, wait for signs of price rejection (rejection / wick / bullish price action) at the indicated support zone before entering the order.
Important zone: 4075 — 4031 (support zone to find BUY signal)
Strategy: Enter BUY when there is a clear price rejection signal + volume/price action reaction.
Target: 4300
Risk management: stoploss placed below support zone if price action breaks and closes deep below.

Gold Continues to Maintain Upward StructureHello, Traders! It's Leo again. Are you following XAUUSD today?
Yesterday, gold moved in line with the expected structure when it held steady above the EMA20/50 around $4,050 and responded well at the main trendline support.
On the other hand, weak US economic data such as the consumer confidence index and the announcement of a surge in layoffs have put pressure on growth and increased the value of gold as a safe haven asset.
This continues to reinforce the medium-term uptrend that is still in place, although a short-term technical correction may appear in today's session.
Currently, the price is fluctuating around $4,100, after breaking the old trendline and moving into a slight accumulation state.
In my personal opinion, next time gold holds above the $4,050 - $4,060 zone, there is a high possibility of a technical recovery back to the $4,150 zone, before the market moves towards the strong resistance zone of $4,320.
In terms of price structure, the current model is still showing a support test recovery wave - rebounding, in line with the main trend maintained since October.
👉 What do you think, comment below. Wish you a successful transaction!

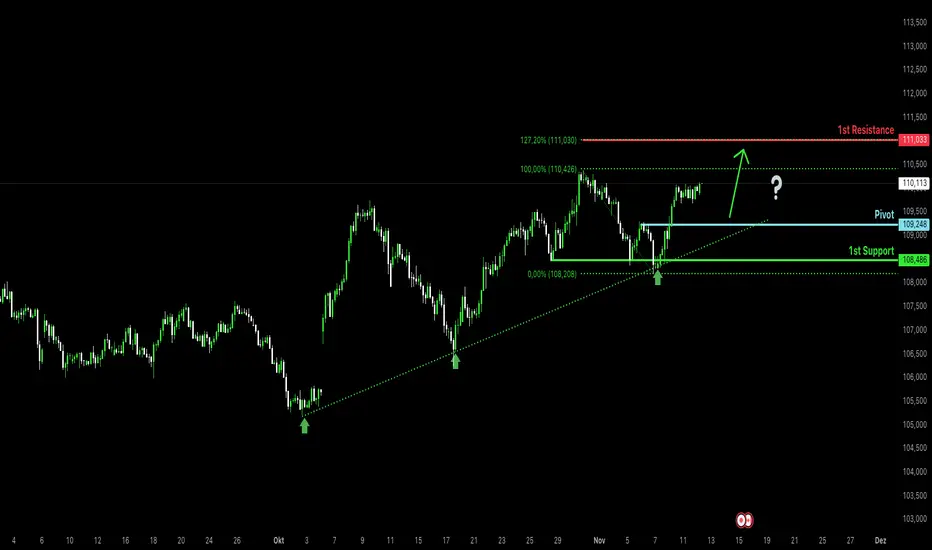
Bullish momentum to extend?CAD/JPY is declining toward the pivot level, which has been identified as a pullback support. A rebound from this area could target the first resistance level, aligning with the 127.2% Fibonacci extension.
Pivot: 109.24
1st Support: 108.8
1st Resistance: 111.03
Disclaimer:
The above opinions given constitute general market commentary, and do not constitute the opinion or advice of IC Markets or any form of personal or investment advice.
Any opinions, news, research, analyses, prices, other information, or links to third-party sites contained on this website are provided on an "as-is" basis, are intended only to be informative, is not an advice nor a recommendation, nor research, or a record of our trading prices, or an offer of, or solicitation for a transaction in any financial instrument and thus should not be treated as such. The information provided does not involve any specific investment objectives, financial situation and needs of any specific person who may receive it. Please be aware, that past performance is not a reliable indicator of future performance and/or results. Past Performance or Forward-looking scenarios based upon the reasonable beliefs of the third-party provider are not a guarantee of future performance. Actual results may differ materially from those anticipated in forward-looking or past performance statements. IC Markets makes no representation or warranty and assumes no liability as to the accuracy or completeness of the information provided, nor any loss arising from any investment based on a recommendation, forecast or any information supplied by any third-party.
Bearish drop?USD/ZAR is rising toward the pivot level, which serves as pullback resistance, and could potentially reverse toward the 1st support level that acts as a multi-swing low support level.
Pivot: 17.25355
1st Support: 17.07395
1st Resistance: 17.35492
Disclaimer:
The above opinions given constitute general market commentary, and do not constitute the opinion or advice of IC Markets or any form of personal or investment advice.
Any opinions, news, research, analyses, prices, other information, or links to third-party sites contained on this website are provided on an "as-is" basis, are intended only to be informative, is not an advice nor a recommendation, nor research, or a record of our trading prices, or an offer of, or solicitation for a transaction in any financial instrument and thus should not be treated as such. The information provided does not involve any specific investment objectives, financial situation and needs of any specific person who may receive it. Please be aware, that past performance is not a reliable indicator of future performance and/or results. Past Performance or Forward-looking scenarios based upon the reasonable beliefs of the third-party provider are not a guarantee of future performance. Actual results may differ materially from those anticipated in forward-looking or past performance statements. IC Markets makes no representation or warranty and assumes no liability as to the accuracy or completeness of the information provided, nor any loss arising from any investment based on a recommendation, forecast or any information supplied by any third-party.

GBPCAD: Price Cross Below H1 ATLKey Observations
On the D1 TF, price is showing a weak bearish trend
EMA20 barely crossed below EMA60, however, price is showing more inside bars than what I'd like to see
On the H1 TF, price crossed below the ATL
Price is also accelerating away from the EMA band

Bitcoin Rebounds — channel breakout signals!Have a good day, Traders! It's Leo. Let's look at the current BTCUSDT chart
Valid Support Zone: 98,000 – 102,000 — Price has formed a clear double-bottom structure here.
Breakout confirmation: Price has broken above the descending channel and both EMA20/50.
Next resistance / target: 115,000 — previous supply area aligning with major liquidity.
→ Short-term structure favors a bullish continuation as long as support holds.
Despite short-term volatility, Bitcoin remains supported by improving risk sentiment as U.S. yields retreat and Fed officials hint at a potential policy pause.
Scenario: A successful retest of the breakout zone could trigger momentum toward the 115K resistance. Holding above 102K keeps the bullish structure intact.
Bulls seem to be regaining control — will this momentum extend toward 115K? What’s your outlook for BTC this week?

NZDJPY to find buyers at market price?NZDJPY - 24h expiry
Prices have reacted from 85.89.
Short term oscillators have turned positive.
A break of the recent high at 87.32 should result in a further move higher.
Offers ample risk/reward to buy at the market.
The bias is to break to the upside.
We look to Buy at 87.01 (stop at 86.59)
Our profit targets will be 88.27 and 88.47
Resistance: 87.32 / 87.70 / 88.34
Support: 86.84 / 86.66 / 86.30
Risk Disclaimer
The trade ideas beyond this page are for informational purposes only and do not constitute investment advice or a solicitation to trade. This information is provided by Signal Centre, a third-party unaffiliated with OANDA, and is intended for general circulation only. OANDA does not guarantee the accuracy of this information and assumes no responsibilities for the information provided by the third party. The information does not take into account the specific investment objectives, financial situation, or particular needs of any particular person. You should take into account your specific investment objectives, financial situation, and particular needs before making a commitment to trade, including seeking, under a separate engagement, as you deem fit.
You accept that you assume all risks in independently viewing the contents and selecting a chosen strategy.
Where the research is distributed in Singapore to a person who is not an Accredited Investor, Expert Investor or an Institutional Investor, Oanda Asia Pacific Pte Ltd (“OAP“) accepts legal responsibility for the contents of the report to such persons only to the extent required by law. Singapore customers should contact OAP at 6579 8289 for matters arising from, or in connection with, the information/research distributed.

XAU/USD | Watch Gold at $4100 – Pullback or Continuation Ahead?By analyzing the Gold chart on the 2-hour timeframe, we can see that after the last analysis, the price dropped from $3997 to $3984, then quickly found strong demand and started a powerful rally, breaking the $4040 resistance.
At the moment, Gold has reached the $4100 zone. A short-term pullback from this level is likely, but after a brief correction, I expect the uptrend to continue. The next bullish targets are $4140, $4156, and $4162.
Please support me with your likes and comments to motivate me to share more analysis with you and share your opinion about the possible trend of this chart with me !
Best Regards , Arman Shaban

GBP/JPY | GBPJPY Rejects from Supply Zone, Bearish Setup in PlayBy analyzing the GBP/JPY chart on the 4-hour timeframe, we can see that after an initial correction down to 200.315, the price found strong demand and invalidated the initial bearish scenario, climbing back up to the second key supply zone.
Currently, the pair is trading around 202.95, and if it manages to stay below 203, we could see another price correction soon. This analysis will be updated soon.
Please support me with your likes and comments to motivate me to share more analysis with you and share your opinion about the possible trend of this chart with me !
Best Regards , Arman Shaban

GBP/USD | Pound Eyes 1.32 After Breaking Key Level!By analyzing the GBP/USD chart on the 1-hour timeframe, we can see that after climbing to 1.31900, the pair has entered a new bullish scenario and is now trading around 1.31700.
I expect to see a minor pullback first, after which we’ll need to see if the price can hold above 1.31500 — if it does, we can anticipate further upside movement.
The first target for this potential rise is 1.31980.
Please support me with your likes and comments to motivate me to share more analysis with you and share your opinion about the possible trend of this chart with me !
Best Regards , Arman Shaban

EURUSD REBOUND AHEAD|LONG|
✅EURUSD broke structure to the upside, reclaiming a key demand block after sweeping sell-side liquidity. Price may continue expanding toward the next buy-side imbalance. Time Frame 3H.
LONG🚀
✅Like and subscribe to never miss a new idea!✅
