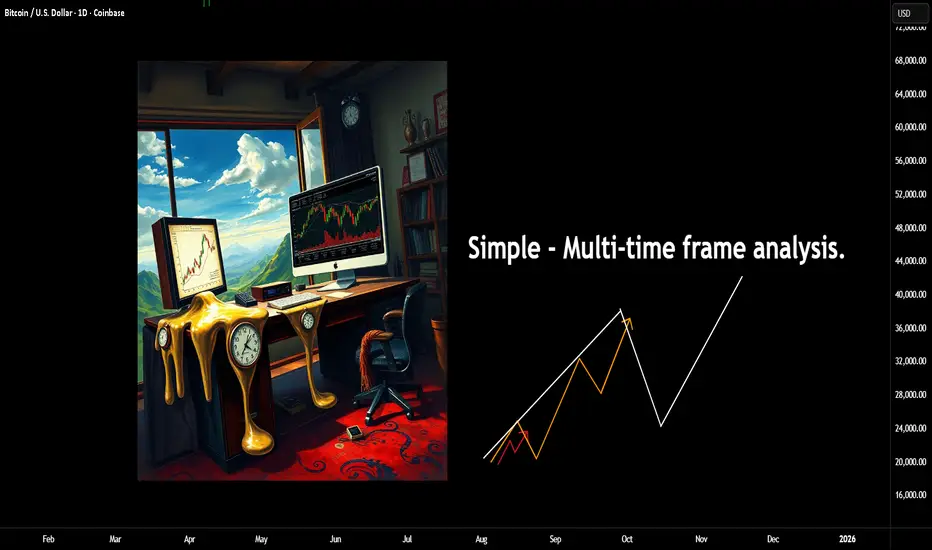
A simple way to view multi time-frame analysisHere's another area many traders struggle with. The real value in using multiple timeframes is to know what to look for and when to look for it!
As I have mentioned in a lot of my posts, all of this comes back to Dow theory; you don't need to make life hard on yourself. instead, simplify your approach and align a small number of timeframes and you will be surprised at the results.
Let me give you an example;
In this image above, you can see a clear push-up and a high, then a pullback.
Why not use this high? It had a clear change of character to the downside.
Well, the answer is - you would view these as separate timeframes. Although they are viewed on the exact same timeframe as my image. One you could call a primary trend and one a secondary.
For a bit more depth, see this post.
If you are already familiar with the idea, then the next thing you want to understand. What phase is the primary trend in?
This becomes important as you drill down to the entry timeframes, as what you are trying to do is to understand a general bias. Once you grasp this, you can even trade the counter-trend moves (if you like).
Ok, so with that being said. Let's add the second timeframe.
As you can see, the orange line represents the primary trend, whilst the internal white path now represents the secondary trend. Why this is key, is because at this stage, the larger trend also could be doing one of two things. Going UP or DOWN.
Up -
Down -
Once you understand the larger trend, the internal will work to facilitate the next leg of that higher degree. Of course, there will be reversals (but that's for another post).
Working with an uptrend for the sake of an example;
Price pushes up and then pulls back.
If we know the ranges, I have covered this in several posts recently (mechanical). We can quickly identify the higher timeframe range.
Once price breaks above this range, at some stage, you will expect to see a lower timeframe change of character, which is simply the start of a pullback on this higher timeframe. There are several ways to take advantage of this (again, another post).
But working with this example. The first move above the range happened overnight or when you were not at your desk. You now have the information to work with the next phase.
Assuming price is in a larger uptrend, you want to start to align these timeframes.
This will be the case regardless of where in the move you are.
These are only examples.
This image above shows the trigger trend in alignment with the higher timeframe. This image below shows the opposite.
Of course, there is more risk involved here as the bigger trend is going the other way, but as long as you acknowledge that, then opportunities will present themselves in both directions.
Here's a few examples on where or how to use this.
The second option is using the higher (secondary) not the trigger, but exactly the same concept.
Finally, the third option is using all three of the timeframes.
Firstly, you know the larger move is up. The second has started to align. Finally, the trigger trend (the minor) has it's change of character and you expect now the move to continue to the upside.
This gives a higher risk-to-reward ratio and often it's a higher probability in terms of the outcome. For the simple reason, the two higher timeframes now agree.
Some of the other posts connected to this one.
Anyways!
Take it easy.
Disclaimer
This idea does not constitute as financial advice. It is for educational purposes only, our principal trader has over 25 years' experience in stocks, ETF's, and Forex. Hence each trade setup might have different hold times, entry or exit conditions, and will vary from the post/idea shared here. You can use the information from this post to make your own trading plan for the instrument discussed. Trading carries a risk; a high percentage of retail traders lose money. Please keep this in mind when entering any trade. Stay safe.
M-forex
GBPUSD Is Very Bearish! Sell!
Here is our detailed technical review for GBPUSD.
Time Frame: 4h
Current Trend: Bearish
Sentiment: Overbought (based on 7-period RSI)
Forecast: Bearish
The market is testing a major horizontal structure 1.315.
Taking into consideration the structure & trend analysis, I believe that the market will reach 1.311 level soon.
P.S
We determine oversold/overbought condition with RSI indicator.
When it drops below 30 - the market is considered to be oversold.
When it bounces above 70 - the market is considered to be overbought.
Like and subscribe and comment my ideas if you enjoy them!

GBPJPY Will Grow! Long!
Please, check our technical outlook for GBPJPY.
Time Frame: 1h
Current Trend: Bullish
Sentiment: Oversold (based on 7-period RSI)
Forecast: Bullish
The market is approaching a significant support area 203.989.
The underlined horizontal cluster clearly indicates a highly probable bullish movement with target 204.805 level.
P.S
Please, note that an oversold/overbought condition can last for a long time, and therefore being oversold/overbought doesn't mean a price rally will come soon, or at all.
Like and subscribe and comment my ideas if you enjoy them!

USOIL BEARISH BIAS RIGHT NOW| SHORT
USOIL SIGNAL
Trade Direction: short
Entry Level: 59.57
Target Level: 56.37
Stop Loss: 61.70
RISK PROFILE
Risk level: medium
Suggested risk: 1%
Timeframe: 1D
Disclosure: I am part of Trade Nation's Influencer program and receive a monthly fee for using their TradingView charts in my analysis.
✅LIKE AND COMMENT MY IDEAS✅

GBP/USD LONG FROM SUPPORT
Hello, Friends!
GBP/USD pair is trading in a local uptrend which know by looking at the previous 1W candle which is green. On the 9H timeframe the pair is going down. The pair is oversold because the price is close to the lower band of the BB indicator. So we are looking to buy the pair with the lower BB line acting as support. The next target is 1.319 area.
Disclosure: I am part of Trade Nation's Influencer program and receive a monthly fee for using their TradingView charts in my analysis.
✅LIKE AND COMMENT MY IDEAS✅

NZD/CAD BEARS ARE STRONG HERE|SHORT
Hello, Friends!
The BB upper band is nearby so NZD-CAD is in the overbought territory. Thus, despite the uptrend on the 1W timeframe I think that we will see a bearish reaction from the resistance line above and a move down towards the target at around 0.788.
Disclosure: I am part of Trade Nation's Influencer program and receive a monthly fee for using their TradingView charts in my analysis.
✅LIKE AND COMMENT MY IDEAS✅

GOLD BULLISH BIAS RIGHT NOW| LONG
GOLD SIGNAL
Trade Direction: long
Entry Level: 4,023.35
Target Level: 4,101.64
Stop Loss: 3,971.15
RISK PROFILE
Risk level: medium
Suggested risk: 1%
Timeframe: 6h
Disclosure: I am part of Trade Nation's Influencer program and receive a monthly fee for using their TradingView charts in my analysis.
✅LIKE AND COMMENT MY IDEAS✅

EUR/USD SENDS CLEAR BEARISH SIGNALS|SHORT
EUR/USD SIGNAL
Trade Direction: short
Entry Level: 1.159
Target Level: 1.156
Stop Loss: 1.160
RISK PROFILE
Risk level: medium
Suggested risk: 1%
Timeframe: 1h
Disclosure: I am part of Trade Nation's Influencer program and receive a monthly fee for using their TradingView charts in my analysis.
✅LIKE AND COMMENT MY IDEAS✅

EURUSD Short: Price Sliding Back Toward 1.1540 SupportHello traders! EURUSD continues to move within a broader bearish trend structure, consistently respecting the descending Trend Line that has acted as a dynamic resistance for several weeks. Each retest of this line has resulted in strong bearish reactions, confirming persistent seller dominance. Throughout the decline, the market formed several pivot points and repeated breakouts, showing how price reacts to key liquidity areas. A notable pattern on the chart is the Rounding Top, which formed near the mid-trend zone and signaled an early shift from bullish correction to renewed bearish pressure. After completing this pattern, EURUSD dropped sharply, breaking down through support and heading toward the demand area. Recently, price attempted a breakout above the descending Trend Line but created a Fake Breakout, indicating that buyers were unable to hold gains above resistance. This rejection occurred inside the Supply Zone around 1.1620, reinforcing the bearish sentiment.
Currently, EURUSD is trading below the trend line once again, showing weakening bullish attempts and maintaining the overall downward trajectory. Price is slowly drifting toward the Demand Zone at 1.15400, which has previously served as a strong reaction area.
My scenario if EURUSD fails to break the descending Trend Line and stays below the Supply Zone, the pair is likely to continue moving lower toward the 1.15400 Demand Zone. This area is the next major support and the most probable target for sellers. However, if buyers defend the current levels and push price back toward resistance, a short-term correction toward the trend line may occur before another bearish impulse. A confirmed break below 1.15400 would open the way for further downside continuation, in line with the broader bearish structure. For now, the bias remains bearish while price trades under the Trend Line and below 1.1620. Manage your risk!

USD/MXN: Super Peso Defies Dollar StrengthHere is the revised article with all hyperlinks removed, maintaining the professional formatting and analysis.
The Mexican peso continues to frustrate dollar bulls, maintaining a defiant stability despite broad greenback strength.
Over the last five sessions, the USD/MXN pair moved just 0.4%. This neutrality highlights the peso's formidable resistance. While the U.S. dollar gains ground globally, Mexico’s currency holds the line. Investors call this the "Super Peso" phenomenon. It stems from a unique confluence of high yields and structural economic shifts.
Macroeconomics: The Rate Differential Shield
Mexico’s high interest rates act as a primary defensive wall. The Bank of Mexico (Banxico) set its benchmark rate at 7.25% in November. Conversely, the U.S. Federal Reserve maintains a target of 4.00%. This 3.25% spread creates a massive incentive for carry traders. Investors borrow cheap dollars to buy yielding pesos. This constant demand buoys the currency even when market sentiment sours.
Economics: Inflation and Policy
Inflation in Mexico is cooling, validating Banxico's strategy. October data showed headline inflation dropping to 3.57%. This progress allows policymakers to consider gradual easing. However, aggressive cuts pose a risk. Narrowing the yield spread too quickly could erode the peso's appeal. Banxico must balance growth needs against currency stability.
Geostrategy & Geopolitics: The Nearshoring Fortress
Global trade tensions have inadvertently strengthened Mexico's hand. The U.S.-China decoupling forces corporations to shorten supply chains. Mexico is the logical beneficiary of this "nearshoring" wave. Its geographic proximity to the U.S. market is a supreme strategic asset. This geopolitical realignment drives Foreign Direct Investment (FDI) to record levels. Long-term capital inflows provide a structural floor for the peso, independent of daily speculative flows.
Industry Trends: Manufacturing Renaissance
Industrial parks across Northern Mexico are operating at near capacity. Global manufacturers are relocating essential production lines from Asia to states like Nuevo León. This shifts Mexico’s economy higher up the value chain. We see a transition from simple assembly to complex manufacturing. This industrial depth creates sustained demand for pesos to pay local operational costs.
Technology & Cyber: Digital Finance Evolution
Mexico’s financial sector is undergoing a rapid technological maturation. Fintech adoption is surging, facilitating record remittance flows. Digital platforms now process billions of dollars efficiently and securely. Cybersecurity investment is rising in tandem to protect this digital infrastructure. Robust cyber-defenses build institutional trust, encouraging further capital repatriation.
Science & High-Tech: The Innovation Hub
The narrative of cheap labor is evolving into one of skilled innovation. Hubs like Guadalajara are attracting high-tech R&D centers. This "Silicon Valley of Mexico" fosters a new class of engineering talent. Science-based industries, including medical devices and aerospace, are expanding. This diversification reduces reliance on oil exports and strengthens the currency's fundamental value.
Patent Analysis: Intellectual Property Growth
Patent filings reflect this high-tech shift. International companies are increasingly filing IP protections within Mexico. Patent data indicates growth in automotive and aerospace engineering sectors. This signals a long-term commitment to the market. Companies do not protect IP in transient manufacturing bases. They do so in strategic, long-term hubs. This entrenchment further stabilizes the economic outlook.
Management & Leadership: Central Bank Discipline
Banxico’s leadership has demonstrated exceptional discipline. They moved earlier and more aggressively against inflation than many G7 peers. This assertiveness established deep credibility with global markets. Investors trust the central bank to defend the currency’s purchasing power. Prudent management serves as an intangible but vital asset for the peso.
Outlook: The Dollar Threat
Risks remain despite these strengths. The U.S. Dollar Index (DXY) is rebounding toward the 100 level. A sustained breakout could pressure emerging market currencies. If the DXY reclaims early-2025 highs of 110, the peso will face a severe test. Traders should watch the 18.59 resistance level closely. A break above this could signal a shift in momentum.

The Arena of XAUUSD-GOLD: New Round BeginsMy friends, Good Morning,
I have prepared a gold analysis for you in a swing trading structure.
The timeframe of this analysis is 4 hours.
In my XAUUSD-GOLD analysis, I will open sell positions between 4124.0 and 4176.0.
My targets are: TP1 - 3995.0 and TP2 - 3969.0.📊
This analysis is purely for your information.
To my friends who support each of my analyses with their likes,
I share these analyses thanks to your likes, because every single like from you is my greatest source of motivation to keep posting.
I sincerely thank all my friends who leave a like. 🙏
With respect and love.❤️

EURUSD: Sellers Target Move Toward 1.1550 Support ZoneHello everyone, here is my breakdown of the current Euro setup.
Market Analysis
EURUSD is currently reacting within a broader corrective structure after failing to break above the major Resistance Area around 1.16500. This zone has repeatedly acted as a strong supply region, where price formed multiple rejection points and false breakouts. Each attempt to move higher was stopped by the descending Resistance Line, confirming continued bearish pressure. Earlier, EURUSD moved inside a wide Range Phase, followed by a breakout that initiated an upward correction inside an Upward Channel. However, bullish momentum weakened once price reached the upper boundary of the channel and the major resistance area. This led to a strong reversal and a bearish breakout below channel support.
Currently, EURUSD is climbing again toward the same Resistance Area near 1.16500, but the structure suggests the move is likely a corrective pullback, not a trend reversal. Price is approaching the intersection of the Resistance Line and the Resistance Zone, creating a confluence area where sellers are expected to regain control.As long as the market trades below this resistance cluster, the overall trend remains bearish. A rejection from the 1.16500 level could trigger a decline toward the Support Zone at 1.15550, which previously acted as a key demand region.
My Scenario & Strategy
I expect EURUSD to complete its pullback soon and resume the bearish trend once price reaches the 1.16500 Resistance Area. This zone remains the strongest supply region in the current structure. Potential short entries become valid once bearish confirmation appears near 1.16500, with the primary target at the 1.15550 Support Zone (TP1).
A clean breakdown below 1.15550 would signal continuation of the downtrend.
Alternatively, if EURUSD successfully breaks above 1.16500 and stays above the descending resistance line, bullish momentum may develop — but for now, this scenario remains secondary. Market bias stays bearish as long as price trades below resistance.
That's the setup I'm tracking. Thank you for your attention, and always manage your risk.

GBPUSD: Breakout & Important Supply Zone 🇬🇧🇺🇸
GBPUSD broke and closed below a key horizontal support.
The broken structure and a falling trend line compose a significant
supply zone now.
I will look for selling from there, expecting a bearish movement
to 1.3024 support.
❤️Please, support my work with like, thank you!❤️
I am part of Trade Nation's Influencer program and receive a monthly fee for using their TradingView charts in my analysis.

GBPCAD: Bullish More From Support Confirmed 🇬🇧🇨🇦
GBPCAD may pull back from a key daily support.
An inverted head and shoulders pattern on that on an hourly time frame
provides a strong bullish confirmation.
Goal - 1.8384
❤️Please, support my work with like, thank you!❤️
I am part of Trade Nation's Influencer program and receive a monthly fee for using their TradingView charts in my analysis.

LiamTrading – XAUUSD H1 | A bearish structure has formed...LiamTrading – XAUUSD H1 | A bearish structure has formed, waiting for confirmation signals in the European session
Overall, gold is in a corrective phase after the previous upward move. On H1, a clear Dow bearish structure (lower highs, lower lows) has formed, but the support area around 4,030 and the Fibonacci cluster below are still potential zones for a reversal buying force. Today's European session will be crucial to confirm: whether to continue a deep decline or bounce back according to the head and shoulders pattern forming on H4.
Macro – Fundamental Brief
The October Fed meeting minutes show a strong internal division:
One group opposes rate cuts, wanting to maintain the current level.
The other group supports cuts, even proposing further reductions in the December meeting.
This lack of consensus reflects a high degree of monetary policy uncertainty, keeping defensive capital flows interested in gold. In the long term, gold only surges when confidence in the financial system weakens – the peak gold price is not a sign of prosperity, but a warning signal.
Technical Analysis – H1 (trendline, Fibonacci, liquidity)
The price is fluctuating below the short-term descending trendline, confirming the bearish phase is still in effect.
The 4,082–4,090 zone is an “important liquidity zone” – where the price has reacted multiple times, currently acting as near resistance.
The 4,029–4,031 cluster is crucial support:
Coincides with technical support area + Fibonacci retracement level.
Start of a large FVG running down to the 3,985 zone (Fibo 1.618 + psychological support).
Above, the 4,129–4,130 zone is strong resistance (strong resistance on the chart); if the price surpasses and holds above this area, the Dow bearish structure will weaken significantly.
Trading Scenario Reference
BUY Scenario – buy at support / Fibonacci zone
Logic: Price holds above support – Fibonacci, bottom-fishing capital appears.
Entry BUY: 4,029–4,031
SL: 4,022
TP: 4,040 → 4,065 → 4,090 → 4,120
Only prioritize when the price reacts well at 4,029–4,031 (wick or clear reversal candle appears on M15–H1). If H1 closes below 4,022, this BUY scenario should be canceled.
SELL Scenario – follow the current bearish structure (prioritize when trendline is not broken)
Logic: Price retraces to retest resistance + descending trendline and is rejected.
Entry SELL: 4,098–4,100
SL: 4,105
TP: 4,088 → 4,070 → 4,035 → 4,000–3,985
Only enter when the price hits the 4,098–4,100 zone and a clear rejection signal appears (pin bar/bearish engulfing). If H1 closes above 4,105 and breaks the trendline, stop all sell orders and reassess the structure.
Notable Price Zones for Scalping
4,082 – 4,060 – 3,985 – 4,129
These zones can be used for short-term scalping based on price reactions, but reduce volume and close quickly.
Important Note
If the price is confirmed to close stably above the descending trendline and holds above the 4,090–4,100 zone, the priority will gradually shift to BUY setups, as a head and shoulders pattern (bullish reversal) is forming on H4.
Conversely, if the 4,029–4,022 support is decisively broken, gold is likely to continue falling towards the FVG and Fibonacci 1.618 zone around 3,985.
Which scenario are you leaning towards for gold today – retrace up to sell further or hold the bottom to bounce back? Leave a comment below the post and follow the LiamTrading channel for daily XAUUSD updates on TradingView.

Brian here with the gold outlook for November 20th Good morning everyone, Brian here with the gold outlook for November 20th. The ABC correction phase of gold is nearly complete, and the market is preparing to enter a new wave phase amidst a flurry of USD data today.
Fundamental Analysis
Today's focus remains on the US labor data: NFP (or revisions), Unemployment Rate, and Initial Jobless Claims.
If the data shows a cooling labor market, expectations for the Fed to soon pivot to a rate-cutting cycle will rise, weakening real yields, putting pressure on the USD, and supporting gold prices.
Conversely, "too good" data will strengthen the dollar, allowing for a short-term repricing move, potentially dragging gold down to lower liquidity zones before recovering.
US session liquidity may be thin before the news release, making it prone to spikes due to algorithms and large flows simultaneously adjusting positions.
Overall, the macro backdrop still favors "buying the dip" for gold, but you must accept strong volatility around news time.
Technical Analysis
On the chart, gold has completed an ABC corrective wave within a descending channel, part of a larger uptrend.
The current descending channel only serves as a corrective leg after the previous upward wave; prices are trading above the "mean" area of the bullish structure, indicating the larger market structure remains bullish.
Below is the liquidity zone / demand zone 4013–4015, coinciding with the previous low and the lower channel boundary – if there's another stop-hunt to this area, it is still considered an opportunity to join the upward move, as long as 4008 is not breached.
Above, the 4086–4100 cluster is the decision zone: breaking and holding above here will confirm exiting the corrective channel, triggering an impulsive leg towards resistances 4132–4146 and further to 4187.
In summary, the main bias remains bullish, prioritizing buy strategies at support zones or after breakout confirmation.
Key Price Levels
Resistance: 4086 – 4100 – 4110 – 4132 – 4146
Support: 4040 – 4030 – 4015
Trading Scenarios
Buy Scenario 1 – Continuation Breakout
Entry: 4086
SL: 4078
TP: 4100 – 4120 – 4140
Prioritize when price breaks up and retests 4086–4100 as a new support zone, confirming exit from the descending channel.
Buy Scenario 2 – Deep Liquidity Sweep
Entry: 4015–4013
SL: 4008
TP: 4030 – 4045 – 4070
Watch for strong price reactions at the demand zone, with pin bars or engulfing candles signaling order flow returning to buyers.
Sell Scenario – Sell Reaction at Strong Resistance
Entry: 4144–4146
SL: 4151
TP: 4132 – 4120 – 4100
Short-term sell strategy, leveraging the high supply zone if price rises straight up without sufficient accumulation.
The medium-term upside target if the bullish wave develops as expected remains the 4187 area.
What do you think of this scenario? Remember to follow Brian for daily gold insights and comment your views below to join the discussion.

Hellena | EUR/USD (4H): SHORT to the support area 1.14647.Colleagues, the corrective movement in wave “4” seems to be completed at 1.16529.
Further I expect the continuation of the impulse movement in wave “5” at least to the support area at 1.14647.
All this impulse will mark the movement in the bigger wave “C”.
Fundamental Context
The US Dollar remains firm as markets downgrade expectations for further Fed rate cuts. This keeps pressure on the euro, especially since Eurozone macro data is still weak and provides little support. At the moment, EUR/USD is mostly driven by USD dynamics rather than European fundamentals.
Manage your capital correctly and competently! Only enter trades based on reliable patterns!

The Global Shadow System1. Foundations of the Global Shadow System
The shadow system emerged alongside globalization. As the movement of capital accelerated in the 20th century, governments liberalized financial markets and reduced restrictions on cross-border flows. While these steps facilitated investment and economic growth, they also opened channels for unmonitored capital movement.
The system rests on four foundations:
1.1 Secrecy
Secrecy is the lifeblood of the shadow world. Whether in offshore financial centres or covert diplomatic channels, secrecy shields actors from accountability. Jurisdictions like the British Virgin Islands, Cayman Islands, Panama, and Luxembourg built industries around confidential structures, shell companies, and trusts.
1.2 Regulatory Fragmentation
Different countries have different laws. Global actors exploit these inconsistencies, creating a patchwork of loopholes and arbitrage opportunities. A company may be headquartered in one country, registered in another, banked in a third, and operational in dozens of others—all to avoid taxes, scrutiny, or liability.
1.3 Financial Innovation
Derivatives, complex securities, and digital assets—while beneficial in many ways—also enable obfuscation. Financial technology often evolves faster than regulation, creating zones where oversight lags behind activity.
1.4 Geopolitical Competition
Nations sometimes encourage secret channels to advance their interests. Intelligence services run covert operations; states use secret funding networks; governments enable their corporations to operate with minimal oversight abroad.
2. The Financial Shadow World
The financial sector contains some of the most sophisticated components of the global shadow system. The most prominent elements include:
2.1 Offshore Tax Havens
These jurisdictions specialize in:
Low or zero taxation
Strict banking secrecy
Minimal reporting requirements
Offshore havens attract corporations, private wealth, and even government officials wanting to move funds discreetly. Research suggests that trillions of dollars of global wealth are parked offshore, depriving nations of tax revenue and hiding ownership structures.
2.2 Shell Companies and Trusts
A shell company exists mainly on paper but can hold assets, open bank accounts, and move funds. Trusts further obscure the true owner by separating legal ownership from beneficiaries. These instruments are commonly used in:
money laundering
tax avoidance
political corruption
global mergers and acquisitions
2.3 Shadow Banking
Shadow banking refers to financial intermediaries that perform bank-like functions but are not regulated like banks. This includes hedge funds, private equity, money market funds, and structured investment vehicles. The 2008 financial crisis exposed how massively interconnected shadow banking is with the formal economy.
2.4 Illicit Financial Flows
Illicit flows encompass illegal money from corruption, trafficking, sanctions evasion, and organized crime. The global shadow system provides channels for these funds to move across borders and integrate into the legal economy.
3. Political and Geopolitical Components
Beyond finance, the global shadow system includes political and geopolitical networks that operate invisibly or unofficially.
3.1 Backdoor Diplomacy
Nations often communicate secretly through back channels:
intelligence services
private envoys
intermediaries in third countries
These channels allow negotiations, coup planning, and geopolitical coordination away from public view.
3.2 Corporate Influence and Lobby Networks
Multinational corporations exert massive influence on global rules. Lobby groups, think tanks, political donations, and policy consultants form a shadow ecosystem that shapes trade agreements, tax policies, and regulations without direct public accountability.
3.3 Intelligence Alliances
Agreements like the Five Eyes network operate partly in secrecy, sharing surveillance, cyber intelligence, and counterterrorism data. Such networks influence global security policies without democratic transparency.
3.4 Private Military and Security Companies
Firms like Wagner (Russia), Blackwater/Academi (US), and other PMCs operate in conflict zones, often without public oversight. They influence wars, resource extraction, and political transitions, forming a covert layer of global warfare.
4. Shadow Economies and Illicit Trade
The shadow economy includes activities that are legal in some contexts but hidden from regulators, as well as outright illegal sectors.
4.1 Black Markets
These markets deal in:
narcotics
arms
counterfeit products
human trafficking
wildlife trade
The shadow system provides the logistics, banking, and distribution channels needed to sustain these markets.
4.2 Crypto and Digital Shadows
Cryptocurrencies and digital assets have added new layers:
privacy coins like Monero
decentralized finance (DeFi)
darknet markets
ransomware payments
Though blockchain is transparent, anonymity tools create shadowed zones of activity.
4.3 Informal Economies
Millions of workers globally operate in informal sectors without legal protections. While not criminal, these activities form part of the grey economy that escapes tax and regulatory systems.
5. How the Shadow System Shapes Global Outcomes
The global shadow system influences the world in several powerful ways:
5.1 Rising Inequality
The wealthy use offshore structures to minimize taxes, while ordinary citizens face stricter rules. This widens the gap between elites and the public.
5.2 Policy Distortion
Governments may appear powerless against corporate tax avoidance or illicit flows, but often they are influenced by the same networks that benefit from secrecy.
5.3 Financial Crises
Unregulated financial products and shadow banking were major contributors to the 2008 crisis and remain potential future risks.
5.4 Undermined Democracy
Opaque funding, influence networks, and secret diplomacy reduce the transparency that democracies require to function.
5.5 Geopolitical Manipulation
Nations use covert financial and intelligence networks to influence elections, destabilize rivals, and secure strategic resources.
6. Efforts to Regulate the Shadow System
International bodies and governments have attempted reforms:
OECD’s BEPS framework targets corporate tax avoidance.
FATF regulations target money laundering and terror financing.
Automatic exchange of financial information reduces secrecy in banking.
Pandora and Panama Papers revelations pressured certain offshore centres.
Despite these efforts, the shadow system persists due to powerful incentives, political protection, and the complexity of global finance.
Conclusion
The global shadow system is an invisible but deeply influential structure shaping our world. It is built on secrecy, financial engineering, regulatory loopholes, and geopolitical backchannels. It affects economies, politics, crime, diplomacy, and global development. Understanding its mechanisms helps explain why inequality persists, why financial crises erupt, and why global governance remains fragmented. The shadow world is not merely a hidden side of globalization—it is its backbone.
GBPCHF outcome.GBPCHF making higher highs and higher lows consistently. Now in the consolidation zone. Let's see if it will continue to climb going into London session.

Buyers Are Back: Is Gold Ready to Break Higher?Gold is entering a promising recovery phase as macro signals are finally shifting in favor of the bulls. After three consecutive losing sessions, the market received a meaningful boost from weaker-than-expected U.S. labor data — opening up a much clearer upside opportunity for XAUUSD.
The number of Americans receiving unemployment benefits has climbed to a two-month high , with continued claims rising to 1.9 million in the week ending October 18. These figures are fueling expectations that the Fed may cut interest rates in December 2025, weakening the USD and lending strong support to the precious metal.
On the 2H chart, price is rebounding from the 4,060 support area and showing a clear return of buying momentum . XAUUSD will likely continue consolidating within the highlighted zone before targeting the 4,150 level. The rounded bottom formation underneath is also reinforcing the bullish scenario .
Overall, the most reasonable strategy is to favor buying on pullbacks toward 4,080–4,100, aiming for 4,150. A break below 4,060 would invalidate the short-term bullish outlook .

GBP/USD Could Test Key Support Before ReboundingHello everyone, looking at GBP/USD on the 1H timeframe, I can clearly see the market entering a phase of consolidation, where buyers are trying to maintain control but sellers still hold a slight advantage. The pair is trading around 1.3139, sitting close to the 1.3120–1.3100 support area—where strong buying pressure previously appeared. After the sharp bounce from 1.3080, the upward momentum stalled at 1.3180–1.3200, which aligns with a bearish FVG, signalling early exhaustion in the short-term structure. The series of small candles over the past few hours reflects accumulation, as if both sides are waiting for the right moment to strike.
Meanwhile, the macro backdrop favours the USD, with the probability of a Fed rate cut in December dropping sharply, strengthening the dollar and pressuring GBP. At the same time, the UK economy provides little support—weak GDP and slow inflation progress contribute to cautious sentiment surrounding the pound.
From what I’m observing, the most reasonable scenario is for GBP/USD to continue pulling back toward 1.3120–1.3100 to retest liquidity before seeing a potential rebound. This zone remains a technically significant support, where buyers previously entered with conviction. If bullish reaction reappears—shown by wick rejections or rising volume—I expect a recovery toward 1.3160–1.3180, and possibly 1.3220–1.3250 if aided by supportive news. Conversely, only a clean break below 1.3100 would open the door to deeper downside toward 1.3050. For now, this still looks like a corrective pullback—sometimes, a pullback is simply the market gathering strength before the next upward leg.
What do you think about this scenario?

Gold Surges as Investors Rotate Back to Safe HavensHello everyone, observing XAU/USD on the 1H chart today is genuinely impressive: from the 4,000 USD/oz low last night, gold has shot straight up to 4,074 USD/oz, gaining 74 USD within just a few hours. This is the kind of recovery that signals buyers never disappeared — they were simply waiting for the right moment to strike.
On the chart, the 4,000 USD/oz zone once again proved its role as a “steel defensive line,” where demand stepped in decisively, perfectly aligning with the green FVG that previously triggered a strong bullish leg. From that area, price climbed back into the Ichimoku cloud and is now approaching the 4,075–4,085 USD/oz resistance band. This will be the gateway for the next move: if gold breaks through, the market may push directly toward 4,100–4,120 USD/oz, and even as high as 4,150 USD/oz if momentum expands. Otherwise, rejection here could send price back to 4,040–4,030 USD/oz for a breather before continuing higher. The market tone right now is classic: accumulate – break – retest, with both sides fighting over narrow zones.
Importantly, today’s strong rebound isn’t purely technical. Safe-haven flows are returning as global equities drop sharply and US macro data — particularly labour indicators — show emerging weakness. Investors are pulling away from risk assets, especially overheated tech stocks inflated by the AI wave, and rotating back into gold — the traditional shelter whenever uncertainty grows. At the same time, expectations for a possible December rate cut remain alive, causing USD strength to stall and giving additional room for gold to recover. On top of that, Bloomberg and Goldman Sachs confirmed China bought another 15 tonnes of gold in September, reinforcing the idea that major players are still accumulating — and they usually move earlier than the crowd.
Based on the current signals, I believe this rebound still has room to extend. Gold may continue toward 4,075–4,085 USD/oz to fill the remaining FVG, and if that zone breaks with firm buying interest, the 4,100–4,120 USD/oz target is completely achievable today. A mild correction may still occur if profit-taking kicks in, pulling price back toward 4,040–4,030 USD/oz to build fresh equilibrium before resuming upward. Overall, gold feels like a drawn bow at the moment — ready for a further thrust if risk-off momentum persists.
This is a phase where gold truly returns to its core identity: a refuge when confidence fades. With capital rotating back into safe assets, a dovish signal from the Fed next month could turn this rebound into something much bigger heading into December. What about you — which scenario do you lean toward for gold today?

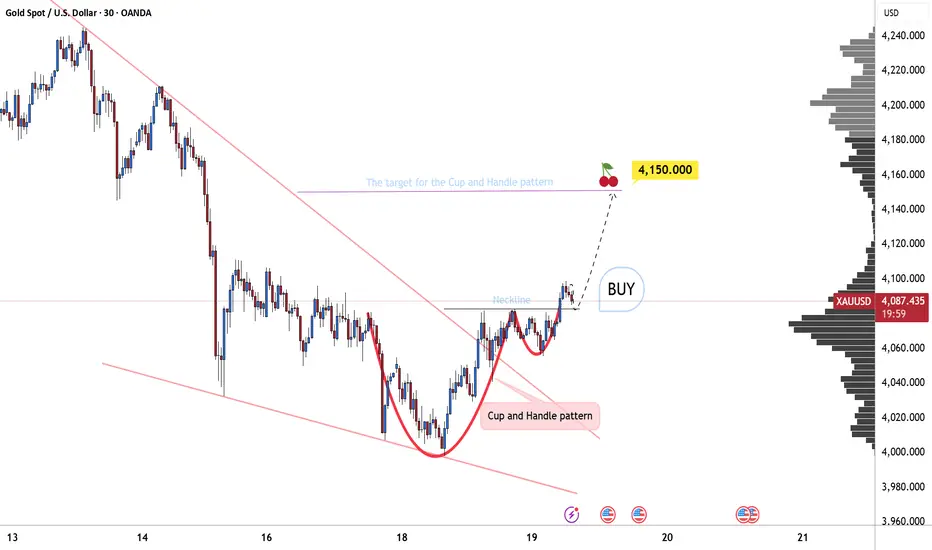
Cup and Handle: Bullish Outlook for GoldOANDA:XAUUSD is clearly forming a Cup and Handle pattern. The price previously dropped to the 4000 zone, then rebounded to 4080, completing the cup structure.
Afterward, the market is experiencing a slight pullback, forming a tight and well-controlled handle.
Finally, the price breaks through the neckline with strong momentum, and my next target is around 4150 , measured based on the height of the cup.
This is a classic bullish pattern, and market expectations are gradually being reinforced.