GOLD Sellers In Panic! BUY!
My dear followers,
I analysed this chart on GOLD and concluded the following:
The market is trading on 4192.4 pivot level.
Bias - Bullish
Technical Indicators: Both Super Trend & Pivot HL indicate a highly probable Bullish continuation.
Target - 4205.9
Safe Stop Loss - 4184.7
About Used Indicators:
A super-trend indicator is plotted on either above or below the closing price to signal a buy or sell. The indicator changes color, based on whether or not you should be buying. If the super-trend indicator moves below the closing price, the indicator turns green, and it signals an entry point or points to buy.
Disclosure: I am part of Trade Nation's Influencer program and receive a monthly fee for using their TradingView charts in my analysis.
———————————
WISH YOU ALL LUCK
M-forex

EURUSD: Bullish Push to 1.174?As the previous analysis worked exactly as predicted, FX:EURUSD is eyeing a bullish breakout on the 4-hour chart , with price forming a series of lower highs and higher lows in a contraction pattern near resistance and support zones, converging with a potential entry area that could ignite upside momentum if buyers break the downtrend line amid recent consolidation. This setup suggests a reversal opportunity after the pullback, targeting higher levels with strong risk-reward.🔥
Entry between 1.1591–1.1617 for a long position (entry at current levels with proper risk management is recommended). Target at 1.1742 . Set a stop loss at a daily close below 1.1582 , yielding a risk-reward ratio of approximately 1:4. Monitor for confirmation via a bullish candle close above entry with rising volume, leveraging the pair's potential recovery.🌟
Fundamentally , EURUSD is trading around 1.167 in early December 2025, with key events this week potentially influencing direction. For the Eurozone, Tuesday's Flash CPI (YoY: Forecast 2.1%) and Core CPI (YoY: 2.4%) could support EUR if inflation holds steady, signaling ECB policy stability, while Friday's final Q3 GDP (QoQ: 0.2%) may reinforce modest growth. Thursday's Retail Sales (MoM: Actual 0%, Forecast 0.1%; YoY: Actual 1.5%, Forecast 1.3%) showed mixed results, with stronger YoY potentially bolstering consumer demand views but flat MoM raising softness concerns. For the US, Monday's ISM Manufacturing PMI (Forecast 49.0) and Fed Chair Powell's speech could weaken USD if dovish, amid rate cut hopes; Wednesday's ADP Nonfarm (Forecast 19K) and ISM Non-Manufacturing (Forecast 52.0) may pressure USD further on weak data; Thursday's Initial Jobless Claims (Actual 191K, Forecast 220K) beat expectations, suggesting labor resilience that might limit USD weakness; and Friday's Michigan Consumer Sentiment (Forecast 52) could weigh on USD if softer. Overall, disappointing US labor stats (e.g., recent rises pushing EURUSD up 0.40% to 1.1668) and Fed cut optimism could favor EUR strength, though resilient claims may cap gains. 💡
📝 Trade Setup
🎯 Entry (Long):
1.1591 – 1.1617
(Entry at current levels is acceptable with proper risk management.)
🎯 Target:
1.1742
❌ Stop Loss:
Daily close below 1.1582
⚖️ Risk-to-Reward:
≈ 1:3+
💡 Your take?
Does EURUSD break the downtrend and push toward 1.1742, or does USD resilience slow the breakout?

Gold Awakens: Sharp Pullback but Outlook Remains BrightFrom a technical perspective, gold is currently moving within a parallel ascending channel, showing a clear bullish momentum with a rhythm that is hard to ignore. The price recently bounced away from the resistance area, indicating a typical overbought reaction. At the moment, the market is approaching the lower boundary of this projected channel, an area considered important. The convergence of several technical support levels in this zone is likely to attract renewed buying interest.
I expect the price to rebound toward the 4,250 area, which aligns with the mid-channel region. The bullish momentum may not appear immediately. The situation could develop into a consolidation phase, a false decline, or even a sudden acceleration.

GBP/CAD BEST PLACE TO SELL FROM|SHORT
GBP/CAD SIGNAL
Trade Direction: short
Entry Level: 1.864
Target Level: 1.855
Stop Loss: 1.871
RISK PROFILE
Risk level: medium
Suggested risk: 1%
Timeframe: 1h
Disclosure: I am part of Trade Nation's Influencer program and receive a monthly fee for using their TradingView charts in my analysis.
✅LIKE AND COMMENT MY IDEAS✅

GOLD fluctuates sharply as labor data weakensSpot OANDA:XAUUSD closed nearly flat at $4,203.06 an ounce, down less than 0.1%, after a volatile session in New York. A significantly weaker-than-expected ADP report sent gold soaring to $4,241.60 an ounce, before profit-taking pressure and a sharp reversal in silver sent prices quickly tumbling back to $4,195 an ounce.
As of writing today, Thursday, December 4, spot gold was trading at $4,202 an ounce, up about $10 on the day.
ADP data showed the US private sector lost 32,000 jobs in November, in stark contrast to expectations for a gain of 10,000, the sharpest decline since March 2023. Win Thin (Nassau 1982) assessed that the ADP index had weakened continuously, reflecting a sustained downward trend in the labor market. Nela Richardson (ADP) noted the widespread slowdown across all business groups, especially the small and medium-sized sector, a sign of more cautious consumers in the context of macro instability.
While gold rebounded in response to the data, silver, which had touched $58.97/ounce in the early session yesterday, then fell sharply to $57.83/ounce, dragging the entire group of precious metals into a short-term correction.
Trump’s unexpected move causes market turmoil: Will the Fed chairmanship change soon?
A new political variable emerged when the White House abruptly canceled the interview schedule for the Fed chairman candidate this week. The Wall Street Journal commented that this move shows that President Trump may have finalized his choice to succeed Powell.
The market immediately raised the possibility that the leading candidate is Kevin Hassett, the White House economic adviser, who is seen as leaning towards a strong interest rate cut stance. The weak USD and recent recovery in gold partly reflect expectations that Hassett may push for a deeper easing cycle after Mr. Powell ends his term in May next year.
Steve Englander (Standard Chartered) said Hassett has an “impressive” track record, but worries about the Fed’s independence under political pressure. The Financial Times said bond investors have expressed concerns to the US Treasury that Hassett may prioritize short-term growth over price stability.
CME FedWatch currently prices an 89% chance of a Fed rate cut at its December 9-10 meeting. Markets are still waiting for September core PCE data, delayed until Friday, a key piece of the inflation puzzle.
Fundamental Outlook: Lower Yields Boost Gold, But Correction Risks Not Over
Given that gold is not yielding, expectations of QE are the central support. However, the combination of weak data, silver volatility and profit-taking pressure suggests that the road ahead for gold will be bumpy.
Macro trends – weak labor, softer USD, and political uncertainty surrounding the Fed Chair – continue to favor price support. But until we break above $4,400/oz with convincing liquidity, the momentum for acceleration will remain at the potential level.
Technical analysis and recommendations OANDA:XAUUSD
Gold is operating in a new bullish cycle: the price remains above the medium-term rising channel, making successive higher lows and closing above the short-term moving averages, indicating active buying.
The important support zone around $4,128–$4,130 (Fibo 0.236) is well defended; if maintained, the short-term bullish structure remains intact.
The RSI has recovered from the neutral zone, implying that the upside momentum is still strong but not overbought. The bullish scenario is complete when the price remains above the short-term MA21, does not break below $3,972–$3,973 (Fibo 0.382) and moves towards challenging the resistance zone of $4,300–$4,380 (channel top/Fibo extension).
Cyclical risk: a break below $3,972 would weaken the structure and could drag the price to a test of $3,846–$3,720.
SELL XAUUSD PRICE 4231 - 4229⚡️
↠↠ Stop Loss 4235
→Take Profit 1 4223
↨
→Take Profit 2 4217
BUY XAUUSD PRICE 4141 - 4143⚡️
↠↠ Stop Loss 4137
→Take Profit 1 4149
↨
→Take Profit 2 4155

EURGBP Set To Fall! SELL!
My dear subscribers,
My technical analysis for EURGBP is below:
The price is coiling around a solid key level - 0.8786
Bias - Bearish
Technical Indicators: Pivot Points Low anticipates a potential price reversal.
Super trend shows a clear sell, giving a perfect indicators' convergence.
Goal - 0.8764
About Used Indicators:
By the very nature of the supertrend indicator, it offers firm support and resistance levels for traders to enter and exit trades. Additionally, it also provides signals for setting stop losses
Disclosure: I am part of Trade Nation's Influencer program and receive a monthly fee for using their TradingView charts in my analysis.
———————————
WISH YOU ALL LUCK

BITCOIN Will Go Higher From Support! Buy!
Take a look at our analysis for BITCOIN.
Time Frame: 4h
Current Trend: Bullish
Sentiment: Oversold (based on 7-period RSI)
Forecast: Bullish
The market is approaching a key horizontal level 86,080.52.
Considering the today's price action, probabilities will be high to see a movement to 92,932.85.
P.S
Overbought describes a period of time where there has been a significant and consistent upward move in price over a period of time without much pullback.
Like and subscribe and comment my ideas if you enjoy them!

NZDUSD Is Very Bullish! Buy!
Take a look at our analysis for NZDUSD.
Time Frame: 1h
Current Trend: Bullish
Sentiment: Oversold (based on 7-period RSI)
Forecast: Bullish
The market is trading around a solid horizontal structure 0.571.
The above observations make me that the market will inevitably achieve 0.574 level.
P.S
Please, note that an oversold/overbought condition can last for a long time, and therefore being oversold/overbought doesn't mean a price rally will come soon, or at all.
Like and subscribe and comment my ideas if you enjoy them!

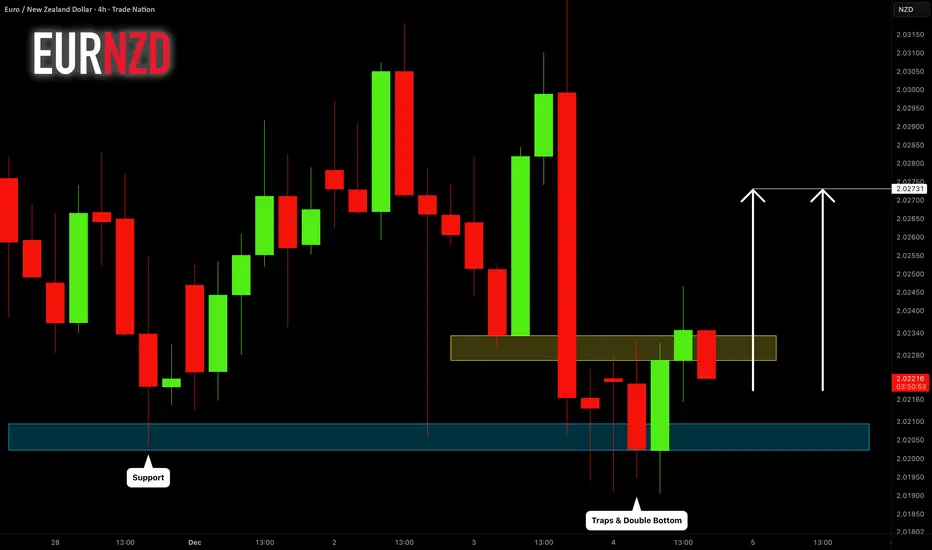
EURNZD: One More Pullback?! 🇪🇺🇳🇿
Looks like we will see another pullback on EURNZD.
The pair looks bullish after multiple traps below a key intraday/daily support.
A double bottom pattern gives a strong confirmation.
I expect a pullback to 2.0273
❤️Please, support my work with like, thank you!❤️
I am part of Trade Nation's Influencer program and receive a monthly fee for using their TradingView charts in my analysis.
XAUUSD Long: Channel Support Holding — Buyers Target 4,300 ZoneHello, traders! The price auction for XAUUSD has been unfolding within a clearly structured bullish progression after a period of heavy distribution inside the Supply Zone. Earlier, gold established a wide Range between the Supply and Demand areas, with multiple sharp rejections forming the top of the structure. Eventually, sellers pushed the price lower, initiating a corrective decline that developed into a well-defined Triangle Pattern, marked by a descending Triangle Supply Line and a rising Triangle Demand Line. This compression ended with a clean breakout to the upside, signaling the beginning of a new bullish phase. Following the breakout, XAUUSD formed a Pivot Point near the mid-range level, where price briefly rejected before continuing its upward trajectory. Another notable phase was the formation of an inverse Head-and-Shoulders structure, confirming buyer strength after a fake breakout below the neckline. This reversal pattern provided the foundation for the current bullish continuation.
Currently, gold is trading inside a strong Ascending Channel, respecting both channel boundaries with consistent higher highs and higher lows. The latest breakout from the mid-channel zone has kept the bullish structure intact, and after a corrective pullback to the lower channel boundary, price is attempting to resume upward movement. As long as price holds within this channel, the market dynamics favor a continuation toward the 4,300 resistance target, which aligns with the upper boundary of the channel and the previously broken structure.
My scenario for the development of events is bullish, with expectations of a rebound from the lower channel boundary followed by a continuation toward the 4,300 resistance level. In my opinion, maintaining structure within the ascending channel supports further upside as long as buyers defend the 4,110 support region below. Manage your risk!

EUR/NZD BULLS ARE STRONG HERE|LONG
Hello, Friends!
We are targeting the 2.028 level area with our long trade on EUR/NZD which is based on the fact that the pair is oversold on the BB band scale and is also approaching a support line below thus going us a good entry option.
Disclosure: I am part of Trade Nation's Influencer program and receive a monthly fee for using their TradingView charts in my analysis.
✅LIKE AND COMMENT MY IDEAS✅

USDCHF H4 | Falling Towards Key SupportMomentum: Bullish
Price is pulling back toward the buy entry, aligning with the 78.6% Fibonacci projection while remaining above the Ichimoku cloud.
Buy Entry: 0.8041
Strong overlap support
78.6% Fibonacci projection
Stop Loss: 0.7971
Pullback support
Slightly above the 61.8% Fibonacci retracement
Take Profit: 0.8067
Overlap resistance
High Risk Investment Warning
Stratos Markets Limited (tradu.com ), Stratos Europe Ltd (tradu.com ):
CFDs are complex instruments and come with a high risk of losing money rapidly due to leverage. 70% of retail investor accounts lose money when trading CFDs with this provider. You should consider whether you understand how CFDs work and whether you can afford to take the high risk of losing your money.
Stratos Global LLC (tradu.com ): Losses can exceed deposits.
Please be advised that the information presented on TradingView is provided to Tradu (‘Company’, ‘we’) by a third-party provider (‘TFA Global Pte Ltd’). Please be reminded that you are solely responsible for the trading decisions on your account. Any information and/or content is intended entirely for research, educational and informational purposes only and does not constitute investment or consultation advice or investment strategy. The information is not tailored to the investment needs of any specific person and therefore does not involve a consideration of any of the investment objectives, financial situation or needs of any viewer that may receive it. Past performance is not a reliable indicator of future results. Actual results may differ materially from those anticipated in forward-looking or past performance statements. We assume no liability as to the accuracy or completeness of any of the information and/or content provided herein and the Company cannot be held responsible for any omission, mistake nor for any loss or damage including without limitation to any loss of profit which may arise from reliance on any information supplied by TFA Global Pte Ltd.

Gold price analysis December 4Gold is currently hovering near the small trendline, where the market is about to enter a directional phase. If the selling pressure is strong enough to break this trendline, the price could continue to slide down to the larger trendline below. Conversely, if the sellers fail to break through, this will be the support for the buyers to bounce back and head towards the important resistance zone of 4290.
Today, the trendlines will play a key role in confirming the direction of the market. Note: when the price breaks 4290, the market will no longer be suitable to set up new BUY orders until a stronger support zone appears around 4115.
Recommended trading strategy:
BUY at the small trendline: around 4195
BUY Trigger: when a clear price rejection signal appears at the support zone 4115
Target: 4290
Risk management:
If the price breaks the small trendline and closes the candle below 4190 → close all BUY orders.
The trend will turn sharply down when the price closes below 4115.

GOLD ANALYSIS 12/04/20251. Fundamental Analysis:
a) Economy:
• USD:
The USD is recovering slightly after a strong decline earlier this week, mainly due to profit-taking flows from gold and bonds. However, the overall trend of the USD remains weak because the market believes the Fed will keep interest rates low and maintain the rate-cutting cycle to support economic growth.
• U.S. Stock Market:
U.S. equities are rising modestly thanks to expectations of a rebound in Q4 corporate earnings and capital rotating back into the tech sector. This reduces safe-haven demand, but the bullish momentum is not strong enough to exert significant downward pressure on gold.
• FED:
The Fed continues to signal a dovish stance, prioritizing economic stability over inflation control. The market is pricing in the possibility of two rate cuts in 2026, providing strong support for gold.
• TRUMP:
The Trump administration is pushing aggressive stimulus packages and trade-protection policies. Uncertainty surrounding tax strategies and pressure on China–Mexico is creating a mild risk-off sentiment, supporting gold.
• Gold ETF (SPDR):
SPDR continued to sell 1.71 tons yesterday → a slightly negative signal, indicating institutional outflows from gold as prices approached all-time highs → mildly bearish for gold.
b) Geopolitics:
• Ongoing instability in the Middle East and Venezuela, with small conflicts occurring frequently.
• U.S.–China tensions persist over technology and trade.
These factors maintain a cautious market tone and form a supportive foundation for gold to rebound.
c) Market Sentiment:
The market is in a mildly risk-on state, but not stable. Funds still move into gold as a defensive asset whenever the USD or equities show signs of profit-taking.
→ Gold continues to trade within a range, but with a bullish bias.
Asian markets are entering the year-end physical-gold buying season → supportive for gold.
2. Technical Analysis:
Trend:
• Price is holding above the rising trendline.
• MA20 – MA50 are about to cross upward → signal of short-term recovery.
• RSI is rebounding from the 30 zone → selling pressure has weakened.
Pattern:
• The U.S. session bottom has formed → price is retesting the trendline and building a new bullish structure.
• Scenario: a pullback to the trendline followed by a bounce.
RESISTANCE: 4,229 – 4,241 – 4,264
SUPPORT: 4,206 – 4,194 – 4,186
3. Yesterday’s Market (03/12/25):
• Gold moved sideways gently within a 45-dollar range.
→ The bearish structure was rejected and left a long wick → a signal that buyers have returned.
4. Trading Strategy for Today (4/12/25):
🪙 SELL XAUUSD | 4232 – 4230
SL: 4236
TP1: 4224
TP2: 4218
🪙 BUY XAUUSD | 4171 – 4173
SL: 4167
TP1: 4179
TP2: 4185

Could we see a reversal from here?ETH/USD is reacting off the pivot which has been identified as an overlap resistance and could reverse to the pullback support.
Pivot: 3,238.27
1st Support: 2,962.76
1st Resistance: 3,371.27
Disclaimer:
The opinions given above constitute general market commentary and do not constitute the opinion or advice of IC Markets or any form of personal or investment advice.
Any opinions, news, research, analyses, prices, other information, or links to third-party sites contained on this website are provided on an "as-is" basis, are intended to be informative only, and are not advice, a recommendation, research, a record of our trading prices, an offer of, or solicitation for, a transaction in any financial instrument and thus should not be treated as such. The information provided does not involve any specific investment objectives, financial situation, or needs of any specific person who may receive it. Please be aware that past performance is not a reliable indicator of future performance and/or results. Past performance or forward-looking scenarios based upon the reasonable beliefs of the third-party provider are not a guarantee of future performance. Actual results may differ materially from those anticipated in forward-looking or past performance statements. IC Markets makes no representation or warranty and assumes no liability as to the accuracy or completeness of the information provided, nor any loss arising from any investment based on a recommendation, forecast, or any information supplied by any third party.

GBPUSD Technical Analysis! SELL!
My dear friends,
My technical analysis for GBPUSD is below:
The market is trading on 1.3338 pivot level.
Bias - Bearish
Technical Indicators: Both Super Trend & Pivot HL indicate a highly probable Bearish continuation.
Target - 1.3257
About Used Indicators:
A pivot point is a technical analysis indicator, or calculations, used to determine the overall trend of the market over different time frames.
Disclosure: I am part of Trade Nation's Influencer program and receive a monthly fee for using their TradingView charts in my analysis.
———————————
WISH YOU ALL LUCK

GOLD ANALYSIS What’s Moving the Market Today? December 03, 2025OANDA:XAUUSD GOLD ANALYSIS What’s Moving the Market Today? (December 03, 2025)
Welcome back to Trade with DECRYPTERS, where we decode smart-money footprints into clean, actionable buy & sell zones.
Keep it simple. Trust the levels. Follow the plan.
📰 Market Overview
Gold continues its steady climb after reacting perfectly from Smart Money Buy Orders earlier this week. Price is now rotating upward toward major liquidity pockets and premium sell zones, keeping bulls in command despite light USD stabilization.
The U.S. Dollar Index has cooled after post-election volatility, hovering near structural lows. Combined with ongoing geopolitical tensions and heavy central-bank accumulation, gold remains firmly inside a macro-bullish environment.
With key U.S. data releases (ADP, ISM Services, PCE) lined up this week and the December 9–10 FOMC meeting approaching, markets are moving cautiously. Gold remains well-positioned inside a premium–discount rotation, respecting structure cleanly.
🔍 Key Fundamentals Driving Today’s Move
📈 88% probability of a December rate cut → lower yield competition boosts gold
💵 USD stabilizing but not strengthening → limited downside pressure
🌍 Geopolitical tensions elevated → increased safe-haven premium
🏦 Central banks remain net buyers (634t YTD) → strong long-term demand
📊 Core PCE at 2.9% → keeps Fed leaning dovish
Gold’s strength is driven by a reliable cocktail of macro uncertainty + structural demand + institutional order flow.
📆 Key Events to Watch
🔸 Unemployment Data Today at 01:15 UK Time
Weak unemployment figures signal labor softness, boosting expectations of a December rate cut.
This typically drives gold into a bullish continuation toward upper sell zones.
Stronger data, however, reduces dovish pressure and strengthens the USD temporarily.
Expect a downward liquidity sweep into discount buy areas before any recovery.
First move is often manipulation the real direction comes after liquidity is taken.
🔸 Geopolitical Landscape
Geopolitical tensions remain a major volatility driver for gold’s intraday movement.
Any escalation triggers an immediate safe-haven spike, sending price rapidly toward premium zones.
Calm conditions allow mild USD recovery, creating controlled pullbacks into discount levels.
Structure stays bullish, but momentum slows as markets wait for the next catalyst.
Overall, geopolitics amplifies whichever trend smart money is already building
🟩 GOLD TECHNICAL LEVELS
Gold continues to respect rising structure, reacting precisely from discount zones and rotating toward your institutional premium blocks. Price now sits directly beneath major supply.
🟩 📌 SMART MONEY BUY ORDERS: 4147 – 4167
This is the primary institutional demand block, loaded with nearly $19 million in buy-side liquidity.
Expect:
✔️ Strong first-tap reactions
✔️ Accumulation + mitigation behavior
✔️ Discount long setups inside broader bullish channel
A clean breakdown below 4147 opens liquidity toward 4108 → 4075.
🟧 📌 SCALP SELL AREA: 4240 – 4252
Short-term liquidity zone used for:
✔️ Quick reaction scalps
✔️ Intraday reversals before the major premium zone
✔️ Stop hunts before the bigger move
Rejection here typically sends price back to 4200–4210 liquidity.
🔺 📌 SMART MONEY SELL AREA: 4264 – 4284
Your high-probability institutional distribution zone holding $29 million in sell-side orders.
Expect:
✔️ Manipulation wicks into premium
✔️ Stop-run behavior
✔️ Swing-reversal setups near the top of the range
A break & hold above 4284 = continuation toward 4310 → 4325.
📌 Conclusion
Gold remains firmly bullish as long as the 4147–4167 Smart Money Buy Zone holds, with price continuing to rotate cleanly between institutional premium and discount areas. With unemployment data set to trigger volatility, expect liquidity sweeps rather than major trend shifts. Stay patient, react only at key zones, and let smart-money footprints guide your next move.
🙌 Support the Analysis
If this breakdown brought clarity to your trading:
👍 Drop a like
💬 Comment your levels
📈 Share your charts with the community
Let’s grow together.
Best Regards,
M. MOIZ KHATTAK | Founder — TRADE WITH DECRYPTERS

USDJPY My Opinion! BUY!
My dear friends,
USDJPY looks like it will make a good move, and here are the details:
The market is trading on 155.33 pivot level.
Bias - Bullish
Technical Indicators: Supper Trend generates a clear long signal while Pivot Point HL is currently determining the overall Bullish trend of the market.
Goal - 156.16
About Used Indicators:
Pivot points are a great way to identify areas of support and resistance, but they work best when combined with other kinds of technical analysis
Disclosure: I am part of Trade Nation's Influencer program and receive a monthly fee for using their TradingView charts in my analysis.
———————————
WISH YOU ALL LUCK

GBPAUD On The Rise! BUY!
My dear friends,
Please, find my technical outlook for GBPAUD below:
The instrument tests an important psychological level 2.0138
Bias - Bullish
Technical Indicators: Supper Trend gives a precise Bullish signal, while Pivot Point HL predicts price changes and potential reversals in the market.
Target - 2.0217
About Used Indicators:
Super-trend indicator is more useful in trending markets where there are clear uptrends and downtrends in price.
Disclosure: I am part of Trade Nation's Influencer program and receive a monthly fee for using their TradingView charts in my analysis.
———————————
WISH YOU ALL LUCK

GBP/USD Is Approaching a Key Zone—Don’t Miss This Setup!What are your thoughts on GBP/USD?
Price recently reacted strongly from the upper resistance zone, showing clear loss of momentum after the latest bullish push. The pair is now pulling back, and as long as price remains below this resistance, a short-term bearish correction is the more likely scenario.
If the pullback extends toward the 1.3180–1.3150 demand zone, we could see a potential bullish reversal from that area. However, if price continues to reject the resistance zone, the bearish corrective scenario remains valid toward the marked target below.
Setup
Sell Area: 1.3330 – 1.3350
Target Zone: 1.3180 – 1.3150
Reason:
- Strong rejection at resistance
- Clear loss of momentum
- Clean liquidity below to collect
This matches the grey corrective path shown in the chart.
Don’t forget to like and share your thoughts in the comments! ❤️

USD-CAD Free Signal! Buy!
Hello, Traders!
USDCAD is reacting off the horizontal demand zone after a deep liquidity sweep, signalling potential bullish displacement as long as structure holds above the mitigation block.
--------------------
Stop Loss: 1.3937
Take Profit: 1.3965
Entry: 1.3950
Time Frame: 2H
--------------------
Buy!
Comment and subscribe to help us grow!
Check out other forecasts below too!
Disclosure: I am part of Trade Nation's Influencer program and receive a monthly fee for using their TradingView charts in my analysis.

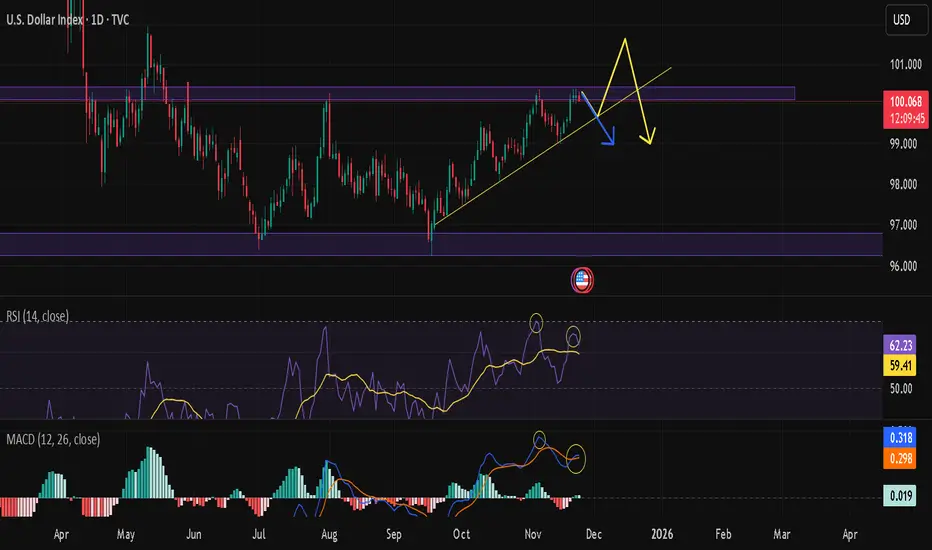
DXY at a KEY “Decision Point” on the Supply ZoneAfter an extended bullish duration, the DXY is now challenging a technically critical “Supply Zone” (100.150 – 100.600). Further away from key levels, both pump and dump up and down, momentum oscillators on all time frames give us mixed signals of exhaustion from buyers and that we are near to making a big decision in the direction of our market.
A comprehensive technical look that includes the broader structures and multi-month macroeconomic supply-demand analysis.
TECHNICAL OUTLOOK
Critical Resistance (Purple Zone): We are currently sitting right inside that 100.150 – 100.600 corridor. This is a level we know well—it’s packed with strong selling pressure and smart money order blocks. Think of this zone as a huge mental hurdle for the bulls; trying to go "Long" here without seeing a clean, high-volume breakout is just asking for trouble with a bad risk/reward setup.
Trend Structure: That ascending yellow trendline connecting the lows since September has been holding the price up so far. But look closer—the space between the price and this trend support is squeezing tight (Compression). This usually tells us one thing: volatility is kicking in and a big move is brewing.
Negative Divergence (RSI) : Here’s the warning sign. While the daily chart is trying to make new highs or just hanging on at resistance, the RSI is losing steam and making lower highs. This "Bearish Divergence" is a classic signal that the trend is running on fumes.
Momentum (MACD) : The MACD histogram is fading out, which confirms the bulls are getting tired. It hints that profit-taking—and the sellers taking over—is likely just around the corner.
MACROECONOMIC AND FUNDAMENTAL DYNAMICS
Fed Expectations : The market is scrambling to rethink the Fed's rate path for 2025. We are watching the data like hawks right now; even a small sign of cooling in jobs or PMI data could spark a rejection from this resistance and send the DXY correcting downwards.
Bond Yields : Any pullback in the US 10-Year Treasury Yields (US10Y) is going to add fuel to the fire for sellers on the Dollar Index.
Liquidity Hunt: Watch out for the "fakeout." Market makers might try to push the price just above that 100.600 level to grab liquidity and hunt the stops of early shorters before slamming it back down. Keep your eyes peeled on the Price Action here.
STRATEGY AND OUTLOOK
Since we are banging our heads against resistance, opening new long positions here just isn't juicy enough risk-wise.
Bearish Scenario: If we see a hard crash with volume breaking that ascending yellow trendline, that seals the deal for a reversal. If that happens, we’re looking at intermediate supports first, with the main target being that 96.50 level down low.
Bullish Scenario : Unless we get a solid daily candle close above 100.800, any rallies should be looked at as opportunities to sell. If the price stays above that level, then this idea is dead in the water.
Conclusion: It’s a "sit on your hands" moment. Waiting for that trend support to break is the safest confirmation we can get before jumping in.
Disclaimer : Just sharing my personal notes and educational analysis here, not financial advice.
GBPUSD H1 | Bullish RiseMomentum: Bullish
Price may pull back toward the buy entry level, which is acting as support. The market is also trading above the Ichimoku cloud, reinforcing the bullish bias.
Buy Entry: 1.3210
Pullback support
Stop Loss: 1.3183
Below pullback support
Take Profit: 1.3267
Multiple swing-high resistance
High Risk Investment Warning
Stratos Markets Limited (tradu.com ), Stratos Europe Ltd (tradu.com ):
CFDs are complex instruments and come with a high risk of losing money rapidly due to leverage. 70% of retail investor accounts lose money when trading CFDs with this provider. You should consider whether you understand how CFDs work and whether you can afford to take the high risk of losing your money.
Stratos Global LLC (tradu.com ): Losses can exceed deposits.
Please be advised that the information presented on TradingView is provided to Tradu (‘Company’, ‘we’) by a third-party provider (‘TFA Global Pte Ltd’). Please be reminded that you are solely responsible for the trading decisions on your account. Any information and/or content is intended entirely for research, educational and informational purposes only and does not constitute investment or consultation advice or investment strategy. The information is not tailored to the investment needs of any specific person and therefore does not involve a consideration of any of the investment objectives, financial situation or needs of any viewer that may receive it. Past performance is not a reliable indicator of future results. Actual results may differ materially from those anticipated in forward-looking or past performance statements. We assume no liability as to the accuracy or completeness of any of the information and/or content provided herein and the Company cannot be held responsible for any omission, mistake nor for any loss or damage including without limitation to any loss of profit which may arise from reliance on any information supplied by TFA Global Pte Ltd.
