Bearish Structure and Short SetupYesterday, price action did not unfold as I anticipated. However, today the market has developed a new bearish internal structure after taking out the daily weak higher high (HH). This shift signals a potential counter-pullback and suggests that momentum is turning to the downside.
To align with this emerging trend, I will be looking for short opportunities, confirmed on the 15-minute timeframe. If the bearish confirmation holds, it could provide a favorable setup to capitalize on the continuation of downward pressure.
M-forex

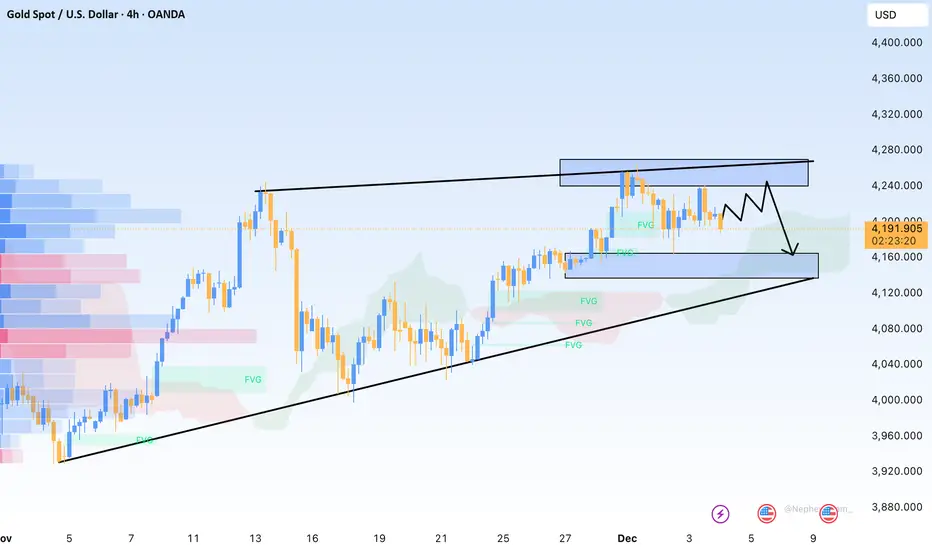
XAUUSD: A new rise is possible after the pullbackXAUUSD has climbed strongly along a steep uptrend, and based on what I’m seeing on the chart, I expect the price to continue pushing toward the 4,265 area.
This zone could become a decision point where the price either finds support and bounces higher or breaks below and allows the move to extend deeper.
If I had to choose a direction right now, I’d lean toward more upside. But price action will always decide what comes next because the chart always speaks last.
When the price breaks below the trendline with real conviction, the bullish scenario loses validity. That could signal a pause in the uptrend or even a short-term reversal.
This is not financial advice, only my personal thoughts based on what I see on the chart.

The Market Doesn’t Wait — But Winners Don’t Hesitate.The market has transitioned into a short-term bearish cycle after sweeping the buy-side liquidity above 4243. A clean CHoCH → BOS sequence confirms the shift from bullish displacement into redistribution, signaling bearish orderflow dominance.
📌 1. CURRENT TREND — MARKET STRUCTURE
The chart is showing a short-term bearish structure on H1 because:
- After forming a HH, price broke the previous low → BOS to the downside.
- Current structure: LH → LL → LH → minor HL → LL.
- Price is heading toward the 4,181 – 4,163 support zone, which is a major structure low.
➡️ H1 trend: short-term bearish (deep pullback)
➡️ Higher-timeframe trend (H4/D1): still bullish → this drop is a corrective move.
📌 2. KEY LEVELS — SUPPORT & RESISTANCE
Main Resistance
- 4,225 — previous swing high and key liquidity target.
Major Support Zones
- 4,181 — mid-range support, likely first reaction point.
- 4,163 — key structure low; strong zone where a new HL may form.
📌 3. MAIN SCENARIOS
Scenario 1 (Primary Scenario): Price taps 4,181 → small sweep → pushes up
Price may form a small internal LL/HL pattern near 4,181.
Potential for liquidity sweep / double bottom.
If price confirms, it will push back toward:
- 4,200
- 4,215
- Main target: 4,225
➡️ This aligns with the higher-timeframe bullish trend + H1 pullback.
Scenario 2 (Cleanest & Highest RR): Price sweeps 4,163 then reverses
- A strong liquidity grab around 4,163 forms a major HL.
- This is where smart money typically accumulates positions.
- A bullish BOS afterward confirms the reversal on H1.
➡️ Best risk-to-reward setup.
📌 4. ENTRY – SL – TP
🎯 ENTRY 1: 4,181 – 4,185 (after rejection/confirmation)
SL: below 4,172
TP1: 4,200
TP2: 4,215
TP3: 4,225
🎯 ENTRY 2 (safer, high RR): 4,163 – 4,168
SL: below 4,150
TP1: 4,185
TP2: 4,200
TP3: 4,225
📌 5. SUMMARY
H1 structure is bearish, but it is simply a deep pullback inside a bullish higher-timeframe trend.
The best long setups are at 4,181 and 4,163.
Once a new HL forms, bullish continuation targets 4,225.
Every pullback is a chance — not a punishment. Stay patient, trust your structure, and execute like a pro.

Price Is Sitting on a High-Probability Demand Zone 📌 MARKET OUTLOOK
USDJPY continues to move inside a well-defined descending channel, forming a clean sequence of Lower Highs and Lower Lows.
Right now, price has tapped the Demand Zone at the bottom of the channel — a level that has consistently acted as a reaction point. After rejecting this zone, the market created a small pullback, forming a clearer Entry Zone for a potential bullish correction.
The structure shows a classic pattern:
➡️ Bounce from Demand → Pullback → Higher Low → Long Setup
This gives us a high-probability opportunity to follow the upcoming corrective leg of the channel.
🎯 TRADE SETUP (Entry – SL – TP)
✅ ENTRY ZONE
155.10 – 155.25
(Aligned with the pullback and the retest highlighted in the chart.)
❌ STOP LOSS (SL ZONE)
154.70 – 154.85
(Placed safely below the Demand Zone and channel support to avoid noise.)
🥇 TAKE PROFIT 1 (TP1)
155.90 – 156.10
(Targeting the upper boundary of the channel.)
🥈 TAKE PROFIT 2 (TP2 – Extended Move)
156.60 – 157.00
(If price breaks market structure and shifts momentum upward.)

Gold Surges on Weak US Data but Momentum FadesHello everyone,
Last night, spot gold on the international market saw a sharp rally of several dozen dollars per ounce after the US released a series of economic reports that came in weaker than expected — particularly labour market data, which strengthened expectations that the Fed may accelerate its rate-cutting path. This is generally positive for gold, as lower interest rates reduce the opportunity cost of holding non-yielding assets.
However, shortly after the breakout, the market witnessed a large wave of profit-taking from institutional investors, causing gold to reverse and drop sharply.
The downside pressure did not come solely from profit-taking; it was also reinforced by a US economic backdrop showing mixed and increasingly unstable signals: weak employment data, slowing growth prospects, and rising expectations of imminent Fed rate cuts. These factors have left capital flows uncertain — torn between holding gold for safety or shifting toward risk assets as US equities recover slightly.
From my perspective, gold is now standing at a critical crossroads:
Weak US data could support another upward leg.
A dovish Fed remains a strong underlying foundation.
But persistent profit-taking may prolong the short-term correction.
Gold’s next move will depend heavily on upcoming US economic releases this week and how the market reacts to shifting expectations around the Fed’s monetary policy.
Wishing everyone a clear-headed and successful trading day ahead!
USDJPY – Short Rebound Faces Heavy Downside PressureHello everyone, USDJPY has rebounded slightly on the H4 chart after hitting 154.90, yet both technical and macro signals suggest this is just a brief pause, not a trend reversal. Price remains under the Ichimoku cloud, confirming sellers are in control, and liquidity is low. Upper FVG zones at 155.80–156.00 and 156.10–156.30 remain strong resistance. Volume is weak, and the POC at 155.00–155.20 points to price gravitating back.
US economic data has been weak, from PMI to consumer confidence, pushing markets to price in earlier Fed cuts. This pressures USDJPY downward as yields fall. Meanwhile, BOJ signals tighter control and exit from negative rates, boosting JPY demand.
Thus, the downside bias persists. A rise to 155.80–156.20 may act as a retest before selling resumes. Price could drop to 155.00, possibly 154.50–153.80. A bullish reversal would require a clear H4 close above 156.30, but this seems unlikely given the current macro backdrop.
Do you think this rebound can gain traction, or is it just temporary?

EURUSD BEARISH BIAS|SHORT|
EURUSD price broke structure and is now poised for a corrective retest of the inefficiency sweep before displacing lower into the target zone as liquidity beneath recent lows becomes the draw. Time Frame 1H.
SHORT🔥
✅Like and subscribe to never miss a new idea!✅

EURCHF Massive Short! SELL!
My dear friends,
Please, find my technical outlook for EURCHF below:
The price is coiling around a solid key level - 0.9356
Bias - Bearish
Technical Indicators: Pivot Points High anticipates a potential price reversal.
Super trend shows a clear sell, giving a perfect indicators' convergence.
Goal - 0.9343
About Used Indicators:
The pivot point itself is simply the average of the high, low and closing prices from the previous trading day.
Disclosure: I am part of Trade Nation's Influencer program and receive a monthly fee for using their TradingView charts in my analysis.
———————————
WISH YOU ALL LUCK

NZDCHF Under Pressure! SELL!
My dear subscribers,
My technical analysis for NZDCHF is below:
The price is coiling around a solid key level - 0.4632
Bias - Bearish
Technical Indicators: Pivot Points Low anticipates a potential price reversal.
Super trend shows a clear sell, giving a perfect indicators' convergence.
Goal - 0.4620
My Stop Loss - 0.4639
About Used Indicators:
By the very nature of the supertrend indicator, it offers firm support and resistance levels for traders to enter and exit trades. Additionally, it also provides signals for setting stop losses
Disclosure: I am part of Trade Nation's Influencer program and receive a monthly fee for using their TradingView charts in my analysis.
———————————
WISH YOU ALL LUCK

EURUSD BUY | Idea Trading AnalysisEURUSD is moving in an UP trend channel.
The chart broke through the dynamic Resistance line, which now acts as support.
We expect a decline in the channel after testing the current level which suggests that the price will continue to rise
Hello Traders, here is the full analysis.
I think we can soon see more fall from this range! GOOD LUCK! Great BUY opportunity EURUSD
I still did my best and this is the most likely count for me at the moment.
-------------------
Traders, if you liked this idea or if you have your own opinion about it, write in the comments. I will be glad

GBPJPY My Opinion! SELL!
My dear friends,
Please, find my technical outlook for GBPJPY below:
The price is coiling around a solid key level - 206.07
Bias - Bearish
Technical Indicators: Pivot Points High anticipates a potential price reversal.
Super trend shows a clear sell, giving a perfect indicators' convergence.
Goal - 205.64
Safe Stop Loss - 206.34
About Used Indicators:
The pivot point itself is simply the average of the high, low and closing prices from the previous trading day.
Disclosure: I am part of Trade Nation's Influencer program and receive a monthly fee for using their TradingView charts in my analysis.
———————————
WISH YOU ALL LUCK

AUDCHFAUDCHF price is in a correction phase. If the price can hold above 0.50914, it is expected that the price will rebound. Consider buying in the red zone.
*Trading is risky.
🔥Trading futures, forex, CFDs and stocks carries a risk of loss.
Please consider carefully whether such trading is suitable for you.
>>GooD Luck 😊
❤️ Like and subscribe to never miss a new idea!

Global Recession Impact on the Stock Market1. Decline in Corporate Earnings and Profit Margins
A recession directly reduces business activity. Companies face:
Lower consumer spending
Weak industrial output
Supply-chain disruptions
Reduced global trade
All these factors hurt corporate profits. Since stock prices are fundamentally based on future earnings, declining earnings expectations lead to falling stock valuations. Sectors dependent on discretionary spending—such as automobiles, luxury goods, travel, entertainment, and retail—tend to see the largest drops.
Industries like utilities, consumer staples, and healthcare experience comparatively less damage because demand remains steady even in downturns.
2. Sharp Stock Market Sell-Offs and Panic Reactions
Recessions amplify fear and uncertainty, triggering:
Panic selling
Liquidity crunches
Forced margin call selling
Flight to safety (bonds, gold, cash)
Investors prefer safe assets over risky equities. This results in broad market declines, often leading to bear markets—defined as a 20% or more drop in stock indices.
Historical patterns show:
2008 Global Financial Crisis: Markets fell 50–60%
2000 Dot-com Crash: Tech-heavy indices declined massively
2020 COVID Crash: Markets dropped 30% in weeks due to recession fears
Psychology plays a huge role. When investors anticipate economic pain, they exit the market rapidly, causing steep downward moves.
3. Rising Volatility and Unpredictable Market Behaviour
During a recession, stock markets experience extreme volatility. Indices can swing 3–8% in a single day as investors react to:
Policy announcements
Interest rate changes
Earnings warnings
Employment reports
Global news and geopolitical events
The VIX index, known as the “fear index”, typically shoots upward in recession periods, reflecting a sharp rise in market uncertainty.
4. Credit Tightening and High Borrowing Costs
Recessions often lead banks and financial institutions to become risk-averse. This causes:
Reduced lending activity
Higher interest rates for risky borrowers
Difficulty for companies to raise capital
Delayed expansion or investment projects
As finance becomes difficult to access, companies struggle to maintain operations, leading to declining stock prices. Financial sector stocks are heavily affected because loan defaults and credit stress increase during recessions.
5. Job Losses and Lower Consumer Spending Hit Market Sentiment
When unemployment rises, consumers reduce spending. This creates a chain reaction:
Lower sales → lower profits → lower stock prices
Businesses cut costs → more layoffs → weaker economy
Investor sentiment drops further
The stock market is extremely sensitive to consumer confidence. When the global population reduces spending, markets price in weaker future demand, causing indices to fall.
6. Currency Fluctuations and Emerging Market Instability
During global recessions:
Investors move money to safe-haven currencies like USD or CHF
Emerging market currencies weaken
Foreign investors withdraw capital
This capital outflow leads to:
Stock market declines in developing countries
Higher import costs
Interest rate hikes to stabilize currency
These factors further intensify stock market stress in regions dependent on foreign investment.
7. Commodity Price Crashes Hit Commodity-Based Markets
Demand for commodities—oil, metals, energy—drops sharply during recessions. This leads to:
Falling commodity prices
Significant declines in commodity-driven equity markets
Lower revenues for countries and companies dependent on raw materials
Energy and mining stocks especially suffer during global downturns.
8. The Role of Central Banks and Government Interventions
While recessions hurt markets, governments and central banks attempt to stabilize conditions using:
Interest rate cuts
Quantitative easing
Fiscal stimulus packages
Bank bailouts or liquidity injections
Such actions can provide temporary relief and may cause short-term market rallies, even during recessions. However, long-term recovery depends on the real economy improving.
Markets often respond positively to stimulus, but if the recession is deep, the rallies may be short-lived.
9. Shift from Growth Stocks to Value and Defensive Stocks
During recessions, investor preferences shift:
Growth Stocks (Tech, Startups, High-Risk Sectors)
Decline more sharply due to high valuations
Struggle with funding shortages
Reduced investor appetite for risk
Value and Defensive Stocks (FMCG, Utilities, Healthcare)
Hold value better
Provide dividends
Offer stability
Portfolio rotation becomes a major trend during recessions, influencing market behavior across sectors.
10. Long-Term Opportunities for Investors
While recessions cause fear and losses, they also create the best long-term investment opportunities. Historically:
Markets recover and hit new all-time highs after recessions
Quality stocks become undervalued
Long-term investors gain the most during recovery phases
Key benefits for disciplined investors include:
Lower entry prices
Higher future returns
Stronger long-term compounding
However, identifying fundamentally sound companies is crucial.
11. Slow and Uneven Recovery Across Sectors
Even after recession ends:
Some sectors recover quickly (technology, IT services, pharma)
Others take years (travel, real estate, heavy industries)
The recovery of stock markets does not always align with economic recovery. Markets often recover before the economy because they are forward-looking.
Conclusion
A global recession deeply affects stock markets through falling corporate earnings, reduced spending, rising job losses, tightening credit, and panic selling. Market volatility increases dramatically, and global liquidity dries up. Sectors linked to discretionary spending and commodities face the sharpest declines, while defensive sectors remain comparatively stable.
Although recessions cause fear and uncertainty, they also offer long-term buying opportunities. Markets eventually recover and grow beyond previous highs, rewarding patient, disciplined investors with strong returns.
Understanding these dynamics helps traders and investors navigate turbulent times with clarity, strategy, and confidence.

Role of International Trade1. Driving Economic Growth and Development
One of the primary roles of international trade is to accelerate economic growth. When countries engage in cross-border trade:
GDP increases due to higher production and export activities.
Foreign exchange earnings expand, allowing countries to import advanced goods and technologies.
Investment flows rise, as global investors look for new markets and opportunities.
Developing nations particularly benefit from increased exports of agricultural products, textiles, minerals, or manufactured goods. When these countries participate in global markets, they experience:
Higher income levels
Improved infrastructure
Better economic stability
Integration with global supply chains
Historically, trade-led growth has transformed economies like China, South Korea, and Singapore, demonstrating that global integration is a powerful engine for development.
2. Promoting Specialization and Comparative Advantage
International trade allows countries to specialize, producing goods and services they can create most efficiently. This concept is rooted in the theory of comparative advantage, proposed by economist David Ricardo.
For example:
India specializes in IT services, pharmaceuticals, and textiles.
Germany excels in automobile manufacturing and engineering.
Japan specializes in electronics and robotics.
Brazil is strong in agriculture and raw materials.
Specialization increases:
Productivity
Efficiency
Quality of goods
Global competitiveness
By focusing on strengths, nations produce more with fewer resources and trade for goods they cannot efficiently manufacture.
3. Expanding Markets for Businesses
Without international trade, companies are constrained by the size of their domestic markets. Trade opens access to billions of consumers worldwide, allowing firms to scale production, reduce costs, and increase profits.
Key benefits include:
Access to larger customer bases
Opportunity to diversify products
Increased brand recognition
Ability to compete globally
Export-oriented industries often grow faster than domestic-focused ones because they face greater demand and tougher competition, which boosts innovation and efficiency.
4. Generating Employment Opportunities
International trade creates millions of direct and indirect jobs across sectors such as:
Manufacturing
Agriculture
IT and services
Logistics and shipping
Banking and finance
Export industries usually require skilled and unskilled labor, increasing employment opportunities. Additionally, growth in trade-related sectors—port operations, customs, warehousing, and transportation—creates supply chain jobs.
In many developing countries, trade-driven manufacturing has pulled millions out of poverty by providing stable income and opportunities for skill development.
5. Encouraging Innovation and Technology Transfer
A key role of international trade is accelerating global technological advancement. When countries import technology-rich products such as machinery, robotics, medical devices, and software, they indirectly gain access to new knowledge and innovation.
Trade fosters:
Technology transfer, from advanced economies to developing nations
Improved industrial processes through imported machinery
Research and Development (R&D) investments driven by global competition
Multinational companies bring modern production systems, managerial skills, and digital tools to the countries where they operate. This accelerates industrialization and enhances productivity.
6. Enhancing Consumer Choice and Quality of Life
International trade dramatically increases the variety of products available to consumers. Without global trade:
Fruits like apples, kiwis, and oranges would be unavailable in many regions.
Electronics, automobiles, and smartphones would be far costlier.
Medicines and medical equipment would be limited.
Trade ensures:
Lower prices
Better product quality
Wider product variety
Continuous innovation
Competition from foreign producers forces domestic companies to improve their products and cut costs, benefiting consumers directly.
7. Strengthening Geopolitical and Diplomatic Relations
Trade is not just an economic tool but also a strategic instrument in international diplomacy. When countries engage in trade partnerships, they build political trust and cooperation.
Benefits include:
Stronger international alliances
Reduced chances of conflict due to mutual economic dependence
Increased cultural exchange
Collaborative agreements in defense, research, and environment
Institutions like the World Trade Organization (WTO), regional trade blocs (EU, ASEAN, NAFTA/USMCA), and bilateral agreements help maintain global economic stability.
8. Supporting Industrial and Infrastructural Development
International trade encourages governments to invest in:
Ports
Highways
Railways
Digital networks
Special Economic Zones (SEZs)
Warehousing and logistics facilities
These improvements not only boost export capacity but also strengthen domestic economic development. In many developing countries, international trade has driven major upgrades in transportation and communication infrastructure.
9. Reducing Production Costs through Global Supply Chains
Trade enables companies to source raw materials, components, and labor from countries where they are most cost-effective.
Examples:
Electronics manufacturers source chips from Taiwan, assembly from China, and components from Malaysia.
Automobile companies import spare parts from multiple countries.
Fashion brands source textiles from India and Bangladesh.
This interconnected global supply chain reduces production costs and enhances efficiency. It also allows companies to diversify supply sources, reducing dependence on any single country.
10. Promoting Economic Resilience and Diversification
Countries that rely heavily on a single industry or resource are vulnerable to economic shocks. International trade helps diversify economic activities.
For example:
Gulf countries are investing in tourism and manufacturing to reduce oil dependency.
African countries are moving from raw material exports to processed goods.
Asian economies balance IT services, manufacturing, and agriculture.
Diversification through trade strengthens economic resilience and reduces vulnerability to global price fluctuations.
Conclusion
International trade plays a foundational role in shaping the modern global economy. It drives economic growth, promotes specialization, increases innovation, and expands opportunities for businesses and workers alike. It enriches consumer choice, strengthens diplomatic ties, and promotes global economic stability.
For developing nations, international trade is a powerful engine for lifting populations out of poverty, modernizing industries, and integrating into global value chains. For advanced economies, it supports innovation, competitiveness, and continued prosperity.
In a rapidly globalizing world, the role of international trade is more significant than ever—linking nations, building economies, and shaping a more interconnected and prosperous global future.

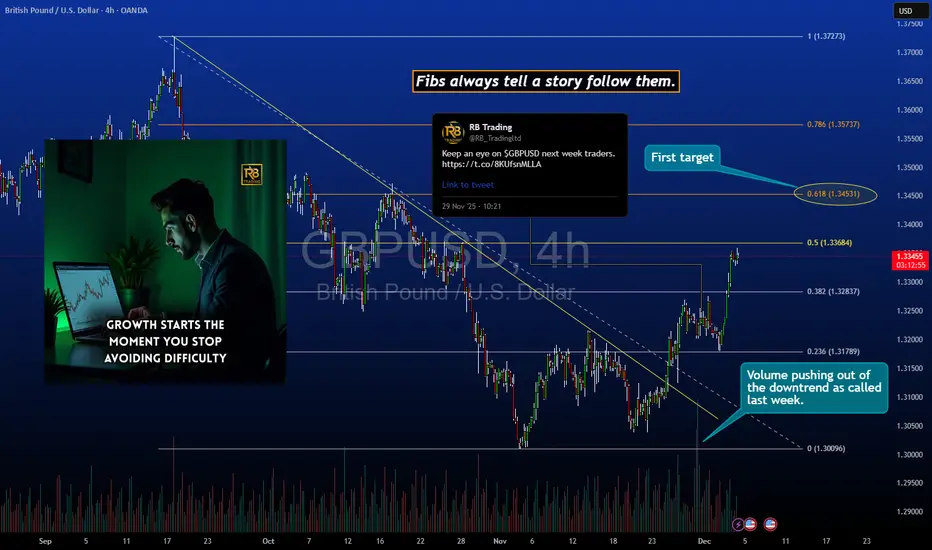
GBP/USD - Daily Downtrend Break Confirmed, Targeting 1.34530GBP/USD Upside Continuation: Breakout from Daily Downtrend Now Targeting 1.34530
Last week's analysis identified GBP/USD breaking out of its daily downtrend structure, and price has confirmed the move with strong follow-through. This update examines the next logical target at the 0.618 Fibonacci retracement level (1.34530) and why geometric levels continue to provide reliable roadmaps in forex price action.
🎯 Trade Update:
Previous Analysis: Daily downtrend break setup
Current Status: Breakout confirmed with momentum continuation
Next Target: 1.34530 (0.618 Fibonacci retracement)
Current Price Action: Advancing toward geometric resistance zone
📊 What Happened Last Week:
The Setup:
GBP/USD was grinding along a multi-week daily downtrend line. Price action showed signs of compression and momentum exhaustion near support, creating a high-probability breakout scenario.
The Call:
Identified the potential for upside breakout from the descending trendline structure, suggesting bullish positioning for the move higher.
The Confirmation:
Price broke above the downtrend with conviction, followed by sustained buying pressure. The breakout has now been validated through both:
Clean break of trendline resistance
Follow-through continuation above the breakout point
No false break or immediate reversal (structure held)
📈 Why 1.34530 Is The Next Target:
Fibonacci Retracement Zone:
The 0.618 level sits at 1.34530, calculated from the recent swing high to swing low. This golden ratio level represents where the current advance would retrace 61.8% of the prior decline—a common reversal or resistance zone.
Why This Level Matters:
Historical price structure shows 1.34530 acted as support/resistance previously
Multiple timeframe confluence (daily and 4-hour charts align here)
Psychological level near 1.3450 attracts institutional attention
Volume profile indicates prior activity concentration in this zone
Geometric Precision:
Fibonacci levels aren't magic they're mathematical representations of natural market rhythm. The 0.618 retracement consistently marks zones where profit-taking and new supply/demand dynamics create price reactions.
🔍 Why Fibonacci Levels Guide Price Action:
Market Psychology:
Traders worldwide use Fibonacci tools, creating self-fulfilling prophecy behavior. When millions watch the same levels, they become magnets for order flow.
Institutional Behavior:
Large funds use algorithmic systems that incorporate geometric retracements and extensions. Their participation at these levels adds liquidity and creates observable reactions.
Natural Market Rhythm:
Markets move in waves impulse, correction, continuation. Fibonacci ratios (0.382, 0.5, 0.618, 1.0, 1.618) mathematically describe where these waves typically pause or reverse.
Historical Validation:
Across all timeframes and instruments, price repeatedly respects these levels. Not every time, but with sufficient frequency to provide edge when combined with structure analysis.
📊 Current Technical Picture:
Trendline Break Confirmed:
The daily downtrend that contained price for weeks has been decisively broken. Price is now establishing higher highs and higher lows—classic uptrend behavior.
Momentum Shift:
Indicators show momentum transitioning from bearish to bullish. The break wasn't a spike and reversal it's sustained directional movement.
Support Structure:
The broken downtrend now acts as dynamic support. Pullbacks toward this area create lower-risk continuation entries.
Volume Confirmation:
The breakout occurred with increased volume, suggesting institutional participation rather than retail speculation.
🎯 Trade Management Framework:
For New Entries:
Pullbacks toward the broken downtrend (now support) offer entry opportunities with tight risk. Wait for price to retest the breakout zone before adding exposure.
For Existing Positions:
First target: 1.34530 (0.618 Fibonacci) - consider reducing partial position here
Extended target: 1.3600+ if price clears 1.34530 cleanly (next Fibonacci extension)
Trailing stops: Move stops to breakeven or above as price advances
Risk Management:
Stop loss below the broken trendline (invalidation of breakout)
If price reclaims the downtrend channel, the bullish thesis is compromised
Position sizing appropriate for forex volatility (leverage discipline essential)
🧠 Why Geometric Levels Work:
They Provide Structure:
Instead of guessing where price "should" go, Fibonacci levels offer objective zones based on mathematical relationships within the price data itself.
They Define Risk:
When targeting 1.34530, you know where the trade invalidates (back inside the downtrend). This allows precise risk calculation.
They Remove Emotion:
Price hits 1.34530 or it doesn't. The level doesn't care about news, opinions, or emotions. This objectivity improves decision-making.
They Stack Probabilities:
When Fibonacci levels align with:
Previous support/resistance
Trendline breaks
Momentum shifts
Volume behavior
...the probability of price reaction at that level increases significantly.
📈 Forex-Specific Considerations:
Session Timing:
GBP/USD sees highest liquidity during London and early New York sessions. Major moves and level tests typically occur during these windows.
Economic Data:
UK and US economic releases can create volatility that overrides technical levels temporarily. Monitor central bank policy and employment data.
Risk Events:
Bank of England and Federal Reserve policy decisions, inflation reports, and geopolitical developments can cause rapid repricing that doesn't respect short-term technical levels.
Leverage Discipline:
Forex allows high leverage. Even with clear technical setups, appropriate position sizing relative to account size is mandatory. One adverse move shouldn't threaten account viability.
📅 Timeframe Expectations:
Not a Sprint:
The move from breakout to 1.34530 may take days or weeks depending on momentum and intermediate profit-taking.
Retest Probability:
Price often retests the breakout level (former downtrend resistance, now support) before continuing higher. This is healthy behavior, not failure.
Consolidation Zones:
Expect temporary consolidation or sideways movement as price approaches 1.34530. Round number resistance at 1.3400 and 1.3450 may cause pauses.
⚠️ What Could Interrupt This:
Fundamental Shocks:
Unexpected central bank decisions or major economic data misses can override technical structure temporarily.
Dollar Strength:
Broad USD strength driven by safe-haven flows or hawkish Fed policy could pressure all GBP/USD levels regardless of chart patterns.
Trendline Reclaim:
If price fails to hold above the broken downtrend and closes back inside the channel, the breakout is invalidated. This requires immediate reassessment.
Fibonacci Rejection:
The 0.618 level at 1.34530 could act as strong resistance. Price may reverse there rather than breaking through. Partial profit-taking at the level manages this risk.
🏆 The Fibonacci Philosophy:
"Fibs Always Guide Us":
This isn't mysticism—it's pattern recognition. Markets have shown for decades that price respects these mathematical levels with remarkable consistency across all instruments and timeframes.
Why They Work:
Collective trader behavior creates self-reinforcing reactions
Algorithmic trading systems incorporate these levels
Natural market waves align with golden ratio mathematics
Historical validation builds confidence, which builds participation
How to Use Them:
Identify swing highs and lows clearly
Apply Fibonacci retracement from swing low to swing high (or reverse)
Watch for price reaction at 0.382, 0.5, 0.618, and extension levels
Combine with structure (trendlines, support/resistance) for confluence
Use them to define targets and invalidation points, not as guarantees
📌 Key Takeaways:
✅ Last week's breakout call validated: GBP/USD broke the daily downtrend and followed through with continuation—setup worked as anticipated.
✅ Next geometric target clear: 1.34530 represents the 0.618 Fibonacci retracement where price reaction is highly probable.
✅ Structure provides confidence: Broken trendline now acts as support; pullbacks toward it offer low-risk continuation entries.
✅ Fibonacci levels guide, not guarantee: While these levels consistently attract price reaction, external factors can override short-term technical structure.
✅ Risk remains defined: Below the broken trendline invalidates the bullish breakout thesis discipline required if structure fails.
⚠️ Important Disclaimers:
This analysis is for educational purposes and reflects a technical view based on trendline analysis, Fibonacci retracement levels, and price structure. It is not financial advice or a recommendation to trade GBP/USD or any instrument.
Forex trading involves substantial risk of loss and is not suitable for all investors. Leverage can amplify both gains and losses. Past breakout success does not guarantee this move will reach 1.34530.
The 0.618 Fibonacci level could act as resistance rather than a waypoint. Price may reverse at this zone, requiring disciplined profit-taking or exit strategies.
Economic data, central bank policy changes, and geopolitical events can cause rapid price movements that override technical analysis. Always use appropriate stop losses and position sizing.
This update reflects ongoing analysis of a previous setup. Markets are dynamic, and technical pictures can change rapidly. Independent analysis and risk management are essential.
Always trade with capital you can afford to lose and consider consulting a financial professional. All trading involves risk.
✨ Community Discussion:
Are you tracking GBP/USD at these levels? How do you use Fibonacci retracements in your forex analysis? Share your perspective in the comments.
📜 Trust the structure. Respect the levels. Trade with discipline.
USDJPY DUBBLE BOTTOM (READ CAPTION)Hi trader's what do you think about USDJPY
The market is currently forming a Double Bottom structure, showing early signs of a potential bullish reversal. Price is moving inside a falling channel, and buyers are starting to react strongly from the lower support zone.
🔹 Key Levels
Support (FVG Support Zone): Strong reaction area around 153.90–154.10 where buyers stepped in.
Double Bottom: Price has formed two equal lows, indicating seller exhaustion and buyer interest.
Resistance: 155.78 — This is the major intraday resistance level.
🔹 Breakout Confirmation
If price breaks and closes above 155.78, this will confirm the reversal and open the path toward the 156.30 demand zone.
🔹 Demand Zone – 156.30
This is the upside target where price is expected to move if the breakout is successful.
This zone previously acted as a supply area and now serves as a potential bullish target.
📉 Scenario if No Breakout
If the market fails to break 155.78, price can make another retest toward the FVG support before another attempt to move upward.
📈 Market Outlook
Breakout above 155.78 → Bullish continuation
Target → 156.30 Demand Zone
Double Bottom + Channel Break = Strong reversal structure
FVG support holding → Buyer strength confirmed
please don't forget to like comment thank you

EURCHF Is Going Down! Sell!
Here is our detailed technical review for EURCHF.
Time Frame: 4h
Current Trend: Bearish
Sentiment: Overbought (based on 7-period RSI)
Forecast: Bearish
The price is testing a key resistance 0.934.
Taking into consideration the current market trend & overbought RSI, chances will be high to see a bearish movement to the downside at least to 0.931 level.
P.S
The term oversold refers to a condition where an asset has traded lower in price and has the potential for a price bounce.
Overbought refers to market scenarios where the instrument is traded considerably higher than its fair value. Overvaluation is caused by market sentiments when there is positive news.
Like and subscribe and comment my ideas if you enjoy them!

EURCAD: Important Breakout 🇪🇺🇨🇦
EURCAD broke and closed above a significant intraday/daily
resistance cluster.
With a high probability, the price will rise more and reach 1.6305 level soon.
❤️Please, support my work with like, thank you!❤️
I am part of Trade Nation's Influencer program and receive a monthly fee for using their TradingView charts in my analysis.

USD/BRL: Is the Real’s High Yield a Trap?The Brazilian Real (BRL) stands at a paradox in late 2025. Local innovation thrives, yet the currency weakens against the US Dollar (USD). UBS analysts forecast the USD/BRL exchange rate will hit 5.50 by mid-2026. This analysis explores the hidden friction points driving this forecast.
Macroeconomics: The Deficit Reality
Brazil’s fiscal health remains the primary drag on the currency. The Central Bank is expected to hold rates at 15% through 2025. This creates a lucrative "carry trade" for foreign investors. However, high yields cannot mask the growing deficit. UBS calculates the true current account deficit at 4.2% when including stablecoin flows. This figure reveals deeper structural fragility than official headline numbers admit.
Geopolitics: The BRICS Dilemma
Brazil’s strategic maneuvering within the BRICS alliance complicates the Real’s outlook. The administration actively pushes to reduce reliance on the US Dollar. This political stance introduces significant market volatility. Furthermore, potential US tariffs on emerging markets create a "risk-off" environment. Investors retreat to the Dollar's safety, adding downward pressure on the BRL. Brazil must balance trade with China against the necessary US investment.
Fintech & Business Models
Brazil’s financial sector provides a critical defense for the currency. The Pix payment system has revolutionized money velocity and reduced transaction costs. Fintech giants are exporting this low-cost banking model globally. These successes prove Brazilian firms can compete internationally. Such innovation attracts essential foreign venture capital, sustaining investment flows that support the Real.
Agri-Tech & Patent Analysis
Agriculture remains the backbone of the economy. Recent patent data ranks Brazil fourth globally in harvesting technology innovations. Biotechnology advancements are boosting crop yields significantly. These scientific breakthroughs lower production costs and improve terms of trade. Efficient agricultural exports provide a vital floor for the currency against external shocks.
Cyber Security & Digital Risk
The digital economy introduces new vulnerabilities. Huge financial flows are now linked to stablecoins and crypto assets. This surge demands a robust cybersecurity infrastructure. Brazil is rapidly expanding its "Cyber-Defense" capabilities to protect these digital assets. This industry maturation reassures global investors. It lowers the perceived risk of deploying capital into the country's digital infrastructure.
Leadership & Corporate Culture
Brazilian corporate culture is maturing rapidly. Executives are moving away from improvisation toward rigorous, data-driven compliance. Banks now aggressively employ AI for precise credit risk management. This shift aligns management practices with strict global standards. It reduces the "governance discount" often applied to Brazilian assets, instilling greater confidence in institutional investors.
Conclusion: A Complex Outlook
The USD/BRL trajectory represents a clash of opposing forces. High interest rates and a booming tech sector support the Real. However, fiscal debt and geopolitical friction pull it down. Traders must tread carefully. The yield is high, but the structural risks are rising.

Potential bearish drop?GBP/AUD is reacting off the pivot and could drop to the 1st support.
Pivot: 2.0178
1st Support: 2.0101
1st Resistance: 2.0235
Disclaimer:
The opinions given above constitute general market commentary and do not constitute the opinion or advice of IC Markets or any form of personal or investment advice.
Any opinions, news, research, analyses, prices, other information, or links to third-party sites contained on this website are provided on an "as-is" basis, are intended to be informative only, and are not advice, a recommendation, research, a record of our trading prices, an offer of, or solicitation for, a transaction in any financial instrument and thus should not be treated as such. The information provided does not involve any specific investment objectives, financial situation, or needs of any specific person who may receive it. Please be aware that past performance is not a reliable indicator of future performance and/or results. Past performance or forward-looking scenarios based upon the reasonable beliefs of the third-party provider are not a guarantee of future performance. Actual results may differ materially from those anticipated in forward-looking or past performance statements. IC Markets makes no representation or warranty and assumes no liability as to the accuracy or completeness of the information provided, nor any loss arising from any investment based on a recommendation, forecast, or any information supplied by any third party.

Bullish momentum to extend?GBP/CHF has reacted off the pivot and could potentially rise to the 1st resistance, which has been identified as a pullback resistance.
Pivot: 1.0662
1st Support: 1.0614
1st Resistance: 1.0744
Disclaimer:
The opinions given above constitute general market commentary and do not constitute the opinion or advice of IC Markets or any form of personal or investment advice.
Any opinions, news, research, analyses, prices, other information, or links to third-party sites contained on this website are provided on an "as-is" basis, are intended to be informative only, and are not advice, a recommendation, research, a record of our trading prices, an offer of, or solicitation for, a transaction in any financial instrument and thus should not be treated as such. The information provided does not involve any specific investment objectives, financial situation, or needs of any specific person who may receive it. Please be aware that past performance is not a reliable indicator of future performance and/or results. Past performance or forward-looking scenarios based upon the reasonable beliefs of the third-party provider are not a guarantee of future performance. Actual results may differ materially from those anticipated in forward-looking or past performance statements. IC Markets makes no representation or warranty and assumes no liability as to the accuracy or completeness of the information provided, nor any loss arising from any investment based on a recommendation, forecast, or any information supplied by any third party.

Falling towards overlap support?EUR/GBP is falling towards the pivot, which has been identified as an overlap support and could bounce to thhe 1st resistance.
Pivot: 0.8717
1st Support: 0.8688
1st Resistance: 0.8763
Disclaimer:
The opinions given above constitute general market commentary and do not constitute the opinion or advice of IC Markets or any form of personal or investment advice.
Any opinions, news, research, analyses, prices, other information, or links to third-party sites contained on this website are provided on an "as-is" basis, are intended to be informative only, and are not advice, a recommendation, research, a record of our trading prices, an offer of, or solicitation for, a transaction in any financial instrument and thus should not be treated as such. The information provided does not involve any specific investment objectives, financial situation, or needs of any specific person who may receive it. Please be aware that past performance is not a reliable indicator of future performance and/or results. Past performance or forward-looking scenarios based upon the reasonable beliefs of the third-party provider are not a guarantee of future performance. Actual results may differ materially from those anticipated in forward-looking or past performance statements. IC Markets makes no representation or warranty and assumes no liability as to the accuracy or completeness of the information provided, nor any loss arising from any investment based on a recommendation, forecast, or any information supplied by any third party.

Bearish reevrsal off key resistance?EUR/CAD is rising towards the pivot, which acts as an overlap resistance that aligns witht he 127.2% Fibonacci extension and could reverse to the 1st support.
Pivot: 1.62915
1st Support: 1.62393
1st Resistance: 1.63225
Disclaimer:
The opinions given above constitute general market commentary and do not constitute the opinion or advice of IC Markets or any form of personal or investment advice.
Any opinions, news, research, analyses, prices, other information, or links to third-party sites contained on this website are provided on an "as-is" basis, are intended to be informative only, and are not advice, a recommendation, research, a record of our trading prices, an offer of, or solicitation for, a transaction in any financial instrument and thus should not be treated as such. The information provided does not involve any specific investment objectives, financial situation, or needs of any specific person who may receive it. Please be aware that past performance is not a reliable indicator of future performance and/or results. Past performance or forward-looking scenarios based upon the reasonable beliefs of the third-party provider are not a guarantee of future performance. Actual results may differ materially from those anticipated in forward-looking or past performance statements. IC Markets makes no representation or warranty and assumes no liability as to the accuracy or completeness of the information provided, nor any loss arising from any investment based on a recommendation, forecast, or any information supplied by any third party.
