AUD-USD Bullish Breakout! Buy!
Hello,Traders!
AUDUSD has broken structure above the demand area, clearing nearby liquidity and opening a path for pro-trend continuation toward premium levels. Expect a corrective dip before expansion resumes.Time Frame 4H.
Buy!
Comment and subscribe to help us grow!
Check out other forecasts below too!
Disclosure: I am part of Trade Nation's Influencer program and receive a monthly fee for using their TradingView charts in my analysis.
M-forex

GBPUSD – Institutional Sell Setup | Multi-TF Supply Confluence GBPUSD is approaching a high-timeframe supply zone, aligning with both fundamental headwinds and a clean technical distribution structure. This presents a high-quality 5.06R bearish swing setup, supported by imbalance fill, liquidity sweep, and multi-month supply alignment.
FUNDAMENTAL ALIGNMENT (Why GBP Should Weaken)
1. Diverging Monetary Policy
The Bank of England faces slowing growth and softer inflationary pressure.
The Federal Reserve remains comparatively restrictive, maintaining tighter policy expectations.
This divergence supports USD strength and GBP weakness.
2. UK Growth Momentum Slowing
Recent UK macro data reflects weakening consumer demand and slower business investment.
Markets are pricing in potential BoE easing earlier than expected → bearish GBP.
3. Risk Sentiment Favours USD
In periods of market uncertainty, capital typically flows into USD as a safe haven.
This adds further downside pressure on GBPUSD.
➡ Overall Macro Bias: Bearish GBPUSD
TECHNICAL ALIGNMENT (Why This Chart Is Bearish)
1. Higher-Timeframe Supply Zone (3M + Daily Confluence)
Price previously reacted strongly from the 3-Month supply zone, rejecting the 1.37 region with aggressive selling.
The current rally is a return-to-origin (RTO) into that same supply area.
2. Liquidity Sweep + Break of Structure
The previous swing high was swept, collecting buy-side liquidity.
Price then broke down, confirming major bearish structure.
This shift signals institutional distribution.
3. Clear Imbalance (IMB) Fill Target
Price is retracing toward a Daily imbalance before continuing the downward leg.
This creates a precise entry window within supply.
4. Trendline Manipulation
The ascending trendline was broken aggressively, and price is now forming a corrective pullback—classic institutional pattern before continuation.
5. High-Probability Entry
The entry aligns with:
✔ A retest of Daily supply
✔ IMB mitigation
✔ Liquidity sweep
✔ Bearish orderflow
✔ Trend continuation structure
Risk-to-Reward: 5.06R, offering strong asymmetric payoff.
TRADE PLAN
Bias: Short (Sell)
Entry: Daily Supply Zone (around 1.36–1.37)
Stop-Loss: Above recent swing high
Target: Revisit lower structure around 1.30 and below
R:R: ≈ 5.06R
TRADE MANAGEMENT PLAN (Institutional Framework)
1. Position Sizing & Risk
Risk 0.5%–1% per position (institutional-grade sizing).
If volatility expands near entry, reduce size proportionally.
No additional scaling until price confirms bearish intent.
2. Entry Execution
✔ Primary Entry:
Execute shorts inside the Daily Supply Zone (1.36–1.37), ideally at the mitigation of imbalance.
✔ Alternative Entry (Confirmation-Based):
If price shows:
rejection wicks
displacement to downside
BOS (Break of Structure) on LTF
then enter on the first pullback.
This allows flexibility while protecting against premature entries.
3. Stop-Loss Management
Initial SL remains above the liquidity sweep / swing high that anchored the distribution (structural invalidation).
Do not tighten SL before price confirms a macro shift, to avoid knockouts during liquidity grabs.
4. Scaling Strategy
No scale-in inside the supply zone (high manipulation area).
Scale-in only after confirmation, such as:
Clear bearish displacement
Lower timeframe BOS
Retest of broken structure
This maintains institutional discipline and preserves risk integrity.
5. Profit Taking Strategy
Use a systematic approach:
TP1 – Partial at 1R
Lock in early profit
Move SL to breakeven only after a clean break of structure (to avoid stop hunts)
TP2 – Major Target at the IMB Fill / Mid-Structure Area
Partial profit where price may temporarily react
Maintain runner for full swing move
TP3 – Final Target at 1.30 (Swing Objective)
This is the full 5.06R target
Exit remaining position here
Structure completes the macro bearish leg
6. Monitoring & Adjustment
Track key things:
A. Fundamentals
BoE statements
Fed policy tone
UK inflation and employment releases
If fundamentals shift toward GBP strength, consider tightening risk.
B. Price Behaviour
If price reclaims the supply zone and holds above structure → invalidate trade
If price consolidates under supply with weak bullish reaction → confirmation of bearish intent
7. Invalidation Criteria (Hard Exit)
Close the trade entirely if:
Daily closes above the supply zone
Structure forms a higher-high and invalidates the distribution
USD loses strength due to major macro shift (e.g., unexpected Fed easing)
No hesitation—professional traders exit mechanically based on rules.
8. Psychological Management
Expect volatility inside supply zones
Avoid emotional management (e.g., moving SL impulsively)
Follow your plan: execution > prediction
Focus on process, not outcome
9. Post-Trade Review
After completion of the 5.06R idea:
Archive chart
Record execution quality
Review entry precision, SL placement, and emotional discipline
Optimize model for future setups
Institutional traders always debrief.
Final Notes
This trade idea is built on multi-timeframe confluence, institutional orderflow, and macro alignment.
The setup remains valid as long as price stays below the Daily/3M supply structure and bearish orderflow persists.

GBPUSDGBPUSD If the price can hold above 1.31805, it is expected that there is a chance that the price will rebound.
🔥Trading futures, forex, CFDs and stocks carries a risk of loss.
Please consider carefully whether such trading is suitable for you.
>>GooD Luck 😊
❤️ Like and subscribe to never miss a new idea!

EUR/USD Chart Pattern...technical-analysis explanation based on what is visible in my chart, without giving financial advice or predicting prices. I’ll simply describe what your chart already suggests.
---
✅ What My Chart Shows
From the my chart, the EUR/USD 1-hour chart includes:
1. Upward Price Channel
Price is moving inside a rising channel (two parallel trendlines).
The current candle is near the top of the channel, meaning:
Momentum is bullish
But price is also near potential resistance
2. Ichimoku Cloud
Price is above the cloud, confirming bullish trend structure.
Future cloud is bullish, giving upward bias, but price being far above the cloud means:
Market may be overextended
Pullback possible toward cloud support
3. My Chart Has Two Marked Target Points
I drew two blue arrows:
Target Point #1 (smaller arrow)
Approx around 1.1560 – 1.1580
This is likely your first bearish retracement target, aligned with:
Mid-channel level
Ichimoku cloud top/bottom
Previous structure support
Target Point #2 (larger arrow)
Approx around 1.1500 – 1.1510
This appears to be my major bearish target, aligned with:
Lower channel boundary
Previous swing lows
HTF support zone
---
🎯 Interpretation of the Targets
Based on my drawing:
📌 If the price respects channel resistance
It may retrace down to:
1️⃣ Target 1 zone: ~1.1560–1.1580
2️⃣ Target 2 zone: ~1.1500–1.1510
📌 If price breaks ABOVE the channel
My targets may be invalidated, and the trend could continue upward.
---
⚠️ Important Notes
This is not financial advice — I’m only interpreting what my chart visually shows.
Markets are volatile; manage risk.
✔ redraw the setup
✔ identify support/resistance
✔ calculate Fibonacci targets
✔ check bullish/bearish scenarios

GBP/USD — Technical Analysis....GBP/USD — Technical Analysis Targets (Based on My Chart)
My chart shows:
Timeframe: 4H
Tools: Ichimoku Cloud, support/resistance zones, and your projected bearish path (blue line).
Price currently around: 1.3300 area
Price is inside a higher‐timeframe supply zone (green region).
From what’s visible, the market structure suggests:
---
📌 Key Levels & Target Zones
🔹 Immediate Resistance (Supply Zone)
1.3330 – 1.3350
Price is testing this upper supply area. This is where my projection shows a rejection.
---
🔹 First Bearish Target (Near-term Support)
1.3230 – 1.3200
This is the highlighted small support block in the middle of the chart. If price rejects from the top, this is the first logical pullback target.
---
🔹 Breakpoint Level
1.3170
You marked this red zone beneath the Ichimoku cloud.
A clean break below 1.3170 likely confirms bearish continuation.
---
🔹 Major Bearish Target (Demand Zone)
1.3050 – 1.3000
This is the large pink demand zone at the bottom of the chart.
My arrow also points to this region.
This would be the full target for the downside move.
---
📉 Summary of Bearish Targets
Target Price Zone Notes
TP1 1.3230 – 1.3200 Minor support, first reaction zone
TP2 1.3170 Key break level
TP3 1.3050 – 1.3000 Major demand zone, full bearish target
---
📈 What To Watch
Rejection candle around 1.3330–1.3350
Kumo breakdown below cloud support
Chikou Span confirming bearish momentum (not fully visible but implied)

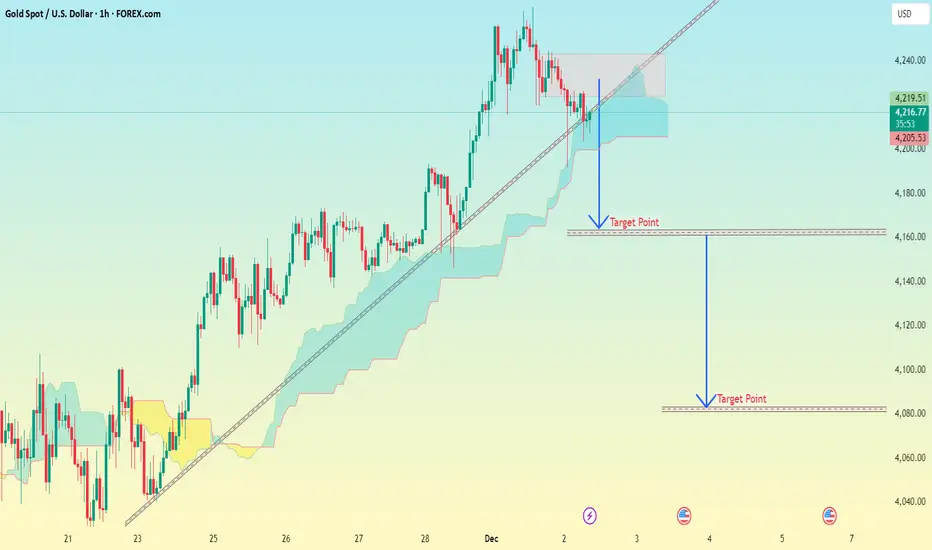
Xauusd 1H chart Pattern..Here is a clean professional analysis with accurate targets based on the chart I'm shared (trendline break + cloud retest + liquidity zones):
---
📉 XAUUSD Analysis & Targets
Market Structure
Price broke the ascending trendline
Currently retesting the cloud support zone
Sellers are strong from 4235–4245 supply zone
Liquidity is resting below 4180 & 4160
---
🎯 Target Levels (Based on Analysis)
🔻 TP1: First Breakdown Target
4185 – 4178
Reason: First liquidity pocket + trendline retest.
---
🔻 TP2: Major Support Target
4165 – 4155
Reason: Imbalance fill + cloud lower band + horizontal demand.
---
🔻 TP3: Extended Drop Target
4120 – 4105
Reason: Large imbalance area + my lower drawn target zone.
---
🔻 TP4 (Deep Target / Final)
4095 – 4085
Reason: Strong historical demand + liquidity sweep zone.
---
📌 Summary
Target Level
TP1 4185–4178
TP2 4165–4155
TP3 4120–4105
TP4 4095–4085
SILVER Will Go Lower From Resistance! Sell!
Please, check our technical outlook for SILVER.
Time Frame: 4h
Current Trend: Bearish
Sentiment: Overbought (based on 7-period RSI)
Forecast: Bearish
The market is testing a major horizontal structure 5,852.3.
Taking into consideration the structure & trend analysis, I believe that the market will reach 5,592.7 level soon.
P.S
Overbought describes a period of time where there has been a significant and consistent upward move in price over a period of time without much pullback.
Like and subscribe and comment my ideas if you enjoy them!

USDCAD Will Go Higher! Buy!
Here is our detailed technical review for USDCAD.
Time Frame: 1h
Current Trend: Bullish
Sentiment: Oversold (based on 7-period RSI)
Forecast: Bullish
The market is approaching a key horizontal level 1.394.
Considering the today's price action, probabilities will be high to see a movement to 1.399.
P.S
Please, note that an oversold/overbought condition can last for a long time, and therefore being oversold/overbought doesn't mean a price rally will come soon, or at all.
Like and subscribe and comment my ideas if you enjoy them!

GOLD BEARS WILL DOMINATE THE MARKET|SHORT
Hello, Friends!
GOLD is making a bullish rebound on the 4H TF and is nearing the resistance line above while we are generally bearish biased on the pair due to our previous 1W candle analysis, thus making a trend-following short a good option for us with the target being the 4,132.94 level.
Disclosure: I am part of Trade Nation's Influencer program and receive a monthly fee for using their TradingView charts in my analysis.
✅LIKE AND COMMENT MY IDEAS✅

EUR/CAD SENDS CLEAR BEARISH SIGNALS|SHORT
EUR/CAD SIGNAL
Trade Direction: short
Entry Level: 1.626
Target Level: 1.624
Stop Loss: 1.628
RISK PROFILE
Risk level: medium
Suggested risk: 1%
Timeframe: 1h
Disclosure: I am part of Trade Nation's Influencer program and receive a monthly fee for using their TradingView charts in my analysis.
✅LIKE AND COMMENT MY IDEAS✅

BTC 100K Breakout or Rejection Next? | Follow for more insightsBITSTAMP:BTCUSD is approaching a key support zone near $87,500–$88,000. If price holds and bounces from this zone, the next upside target could be $95,000 — with possible follow‑through toward $100,000+ if bulls regain strength.
On the flip side — a decisive break below $87,500 would raise risk toward $80,000.
Watch for a clean daily close and volume confirmation before entering. Manage risk carefully; avoid chasing a bounce.
EURUSD: Rejection Signals Move Toward 1.15500 SupportHello everyone, here is my breakdown of the current EURUSD setup.
Market Analysis
EURUSD continues to trade inside a broader downward channel, where bearish structure remains dominant. After reaching the Resistance Zone around 1.16500, the pair formed another rejection near the descending trendline, confirming strong seller pressure and completing yet another fake breakout inside this key supply area. From there, price reversed sharply and moved back below the structure, respecting the market’s overall bearish sentiment.
Currently, EURUSD is pulling back from resistance and heading toward the Support Zone near 1.15500, which has previously acted as a significant reaction area. This zone also aligns with multiple breakout points seen earlier, making it an important liquidity region where buyers have stepped in before. Despite temporary bullish corrections, the pair remains capped under the channel resistance, keeping the downtrend intact.
My Scenario & Strategy
My scenario as long as the market stays below the descending channel’s resistance and under the 1.16500 zone, my bias remains bearish. The price is likely to continue moving toward the 1.15500 Support Zone, where the next significant reaction may occur. A clean retest of this level could initiate either a short-term corrective bounce or a continuation of the bearish trend, depending on the strength of incoming momentum.
Therefore, if the pair breaks below 1.15500, this would open the door for deeper downside movement within the channel, extending toward lower supports. However, if buyers defend this zone strongly, we may see a temporary upward correction — but any upside remains limited unless EURUSD breaks above the Resistance Zone with confirmation. For now, I expect a move toward support as sellers remain in control of market structure.
That's the setup I'm tracking. Thank you for your attention, and always manage your risk.

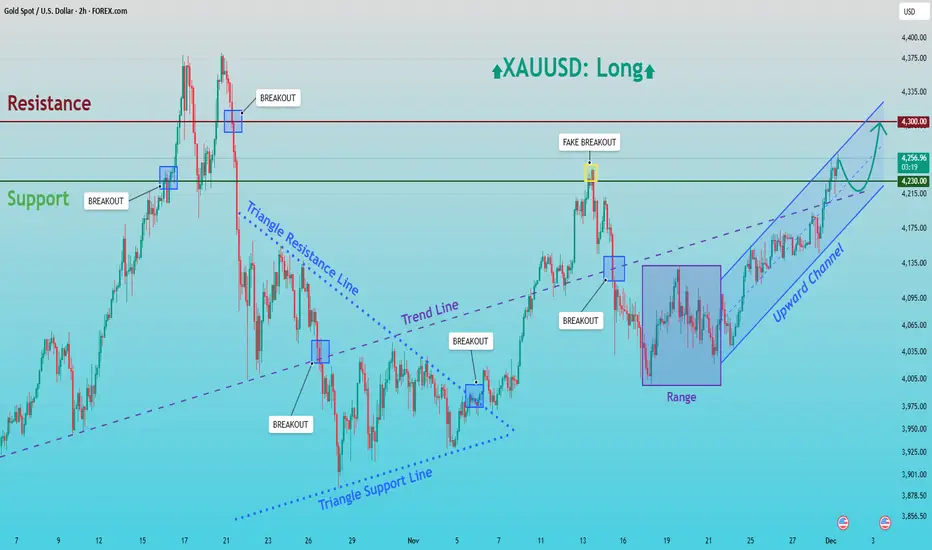
XAUUSD: Buyers Eye Retest of the $4,300 Resistance ZoneHello everyone, here is my breakdown of the current XAUUSD setup.
Market Analysis
Gold continues to trade within a well-structured bullish environment following a strong recovery from the lower Triangle Support Line earlier in the month. After a prolonged corrective phase inside a symmetrical triangle, price eventually broke above the Triangle Resistance Line, shifting the market structure from consolidation into bullish continuation. This breakout created a clear trend shift, supported by a steady sequence of higher highs and higher lows. After the breakout, XAUUSD entered a temporary Range phase, suggesting accumulation from buyers before the next impulsive move. Once price broke out of that range to the upside, the market formed a clean Upward Channel, showing sustained bullish pressure. A notable fake breakout above the Resistance Zone around 4,260 occurred recently, indicating strong seller activity at the top of the zone, but buyers quickly regained control and continued to push price upward within the channel.
Currently, gold is trading near the mid-upper area of the Upward Channel, approaching the 4,300 key Resistance Zone. The broader technical picture shows clear bullish market structure, with trendline support and channel dynamics favoring further upside as long as the channel remains intact.
My Scenario & Strategy
My scenario is bullish, supported by the strong rebound within the Upward Channel and the consistent higher-low structure. As long as price remains above the 4,215–4,230 Support Zone and respects the channel’s lower boundary, buyers hold a clear advantage. My expectation is that XAUUSD may make a minor pullback toward the mid-channel zone near 4,230 to gather liquidity before continuing the upward movement.
Therefore, the primary bullish target remains the 4,300 Resistance Zone, where a retest is highly probable. A clean breakout above 4,300 would open the door for a stronger rally and signal continuation of the broader bullish cycle. However, if gold fails to break the resistance and forms a deeper correction, the Upward Channel support and the prior breakout zone at 4,215 will be key levels to watch. The bullish bias remains valid as long as these supports hold. For now, the structure favors a long scenario with attention on the move toward 4,300 and potential bullish continuation beyond that level.
That's the setup I'm tracking. Thank you for your attention, and always manage your risk.
EUR/USD | What to expect? (READ THE CAPTION)Hello everybody, Amirali here, back with another analysis.
By examining the 4H chart of EURUSD, you can see that yesterday, EURUSD dropped all the way to 1.15900 before going back up to 1.16520 and then consolidated below 1.16500, before closing the supply zone. and going up to 1.16600 There's an old New Week Opening Gap (NWOG) between 1.1651 to 1.1667, I believe that if it fails to go through there, it might drop all the way to 1.16250. If it manages to go through the NWOG, a rise to 1.17000 is possible.

EURUSD 1.20 Move Might Begin SoonIt looks like the 1.20 move is about to begin.
1- Hassett is most likely the winner of FED chair race which is a big negative for the dollar.
2- Rising Japan yields should put pressure on dollar because of the reverse carry trade potential.
3- FED likely to cut this month because of the high expectations on plus of the Hassett news. Combo bullish for EURUSD
4- EU has decent data, good and stable PMIs, inflation around the target, some weak data from Germany and some political risks from France but overall it is doing ok. Citi surprise index 17.40.
5- Bond market pricing a stable 2026.
6- Trump administration wants a weak dollar + low yield.
For 2026, I expect EURUSD is doing okay above 1,20 average. A move towards 1.20 likely begin soon.

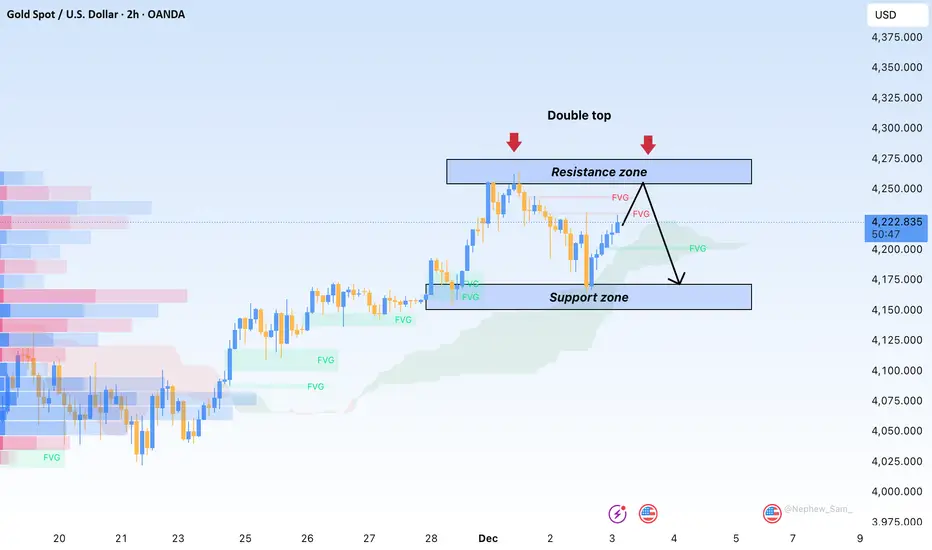
Gold Surges Strongly but Fails to Maintain MomentumHello everyone, the recent movement of gold reflects a market heavily influenced by “news-driven support overshadowed by selling pressure.” XAUUSD made an impressive breakout to 4,237 USD/ounce — the highest level in six weeks — as safe-haven flows returned on geopolitical tensions and expectations that the Fed will continue its rate-cut cycle. But only hours later, profit-taking rushed in, sending gold down more than 30 USD and pulling the metal back to the 4,207 USD region this morning.
This weakness mainly stems from improving risk sentiment: US equities rebounded, with the S&P 500 turning green and the Nasdaq pushing higher as tech stocks led the move. Japanese markets also stabilised as bonds cooled, reducing demand for safety. And with the DXY climbing to 99.18, downward pressure on gold became even more evident — a stronger USD rarely favours the precious metal.
From a technical perspective, the 4,180–4,190 FVG zone helped lift price again after the sharp drop, but gold remains capped beneath the upper FVG resistance. The Ichimoku cloud on the 2H timeframe shows price approaching the Kijun–Senkou intersection — an area that historically attracts selling pressure. This keeps the current price action more aligned with a supply retest rather than the beginning of a genuine bullish trend.
In summary, gold is facing an important test. The 4,235–4,245 region remains the key barrier: a breakout could quickly extend momentum toward 4,260–4,285, while another rejection could push XAUUSD back toward 4,190 to collect liquidity before deciding on its next direction.
GOLD ANALYSIS 13/02/2025Fundamental Analysis:
a) Economy:
• USD:
The USD slightly rebounded after a deep decline due to profit-taking flows during the week, but the broader trend remains weakening as the market expects the FED to keep or cut rates in upcoming meetings, supporting gold.
• US Stock Market:
Wall Street rose slightly; capital is leaning toward risk assets but not strongly. This prevents gold from being heavily sold and helps maintain stable buying momentum.
• FED:
FED officials signal maintaining a stable policy stance, with no signs of rate hikes returning. This continues to support gold in the medium term.
• TRUMP:
The Trump administration is applying trade pressure in multiple regions, creating a certain degree of uncertainty → gold benefits from geopolitical risks.
• Gold ETF (SPDR):
SPDR sold 1.72 tons as a probing move yesterday, showing institutional profit-taking. A negative signal for gold.
b) Politics:
• Geopolitical tensions in the Middle East and several hotspots remain unstable.
• New tensions in Europe regarding energy and borders.
→ These factors support gold in maintaining its upward bias.
c) Market Sentiment:
• The market is in a mild risk-off state, with defensive flows returning after yesterday’s sharp 70-dollar drop.
• Strong dip-buying appeared densely around the support area, causing price to rebound quickly.
• Gold demand in Asia rises during the year-end season, supporting gold.
→ Current sentiment leans toward buying when price corrects.
Technical Analysis:
M15 timeframe:
• Gold sharply flushed 70 dollars down to the support zone at 4,164 and bounced back.
• The bullish structure remains intact, not yet broken.
• MA20 – MA50 are converging, preparing to restore upward momentum.
• RSI bounced from the 30 zone → showing a clear counterattack from buyers.
• The neckline around 4,186 is being retested.
• If it breaks above 4,231 → next targets: 4,274 → 4,320 → 4,380.
→ Overall, the model still signals a continuing uptrend; yesterday’s drop was only a market reset.
→ When gold flushes, do not catch the falling knife, do not chase sells (Sell orders are dangerous because selling comes from panic, buying comes from greed). Wait for price to hit strong support and show bullish signals, then buy strongly. Still captures the move but safely.
RESISTANCE: 4,231 - 4,274 - 4,320
SUPPORT: 4,200 - 4,186 - 4,164
Market Recap (Dec 2):
• Gold dropped sharply by 70 dollars due to profit-taking and thin liquidity in the US session.
• Then it rebounded strongly, proving the uptrend has not been broken.
• SPDR’s probing sell indicates gradual profit-taking near ATH.
Strategy for Today (Dec 3):
🪙 SELL XAUUSD | 4277 – 4275
SL: 4281
TP1: 4269
TP2: 4263
🪙 BUY XAUUSD | 4191 – 4193
SL: 4187
TP1: 4199
TP2: 4205

USDCHF H4 | Bearish Drop In PlayMomentum: Bullish
The price has reacted off the sell entry and is trading below the descending trendline and the Ichimoku cloud.
Sell entry: 0.8026
Pullback resistance.
Stop loss: 0.8063
Pullback resistance.
Take profit: 0.7970
Pullback support
Slightly above the 61.8% Fibonacci retracement.
High Risk Investment Warning
Stratos Markets Limited (tradu.com ), Stratos Europe Ltd (tradu.com ):
CFDs are complex instruments and come with a high risk of losing money rapidly due to leverage. 70% of retail investor accounts lose money when trading CFDs with this provider. You should consider whether you understand how CFDs work and whether you can afford to take the high risk of losing your money.
Stratos Global LLC (tradu.com ): Losses can exceed deposits.
Please be advised that the information presented on TradingView is provided to Tradu (‘Company’, ‘we’) by a third-party provider (‘TFA Global Pte Ltd’). Please be reminded that you are solely responsible for the trading decisions on your account. Any information and/or content is intended entirely for research, educational and informational purposes only and does not constitute investment or consultation advice or investment strategy. The information is not tailored to the investment needs of any specific person and therefore does not involve a consideration of any of the investment objectives, financial situation or needs of any viewer that may receive it. Past performance is not a reliable indicator of future results. Actual results may differ materially from those anticipated in forward-looking or past performance statements. We assume no liability as to the accuracy or completeness of any of the information and/or content provided herein and the Company cannot be held responsible for any omission, mistake nor for any loss or damage including without limitation to any loss of profit which may arise from reliance on any information supplied by TFA Global Pte Ltd.
Update idea
Add note
Tradu
Disclaimer
The information and publications are not meant to be, and do not constitute, financial, investment, trading, or other types of advice or recommendations supplied or endorsed by

International Payment Gateways1. What Are International Payment Gateways?
An international payment gateway is a digital service that authorizes, processes, and settles payments made across countries through various methods such as credit cards, debit cards, wallets, bank transfers, and cross-border digital payment systems. Unlike domestic gateways, international gateways must handle multiple currencies, comply with global regulatory standards, and connect with overseas banking networks.
They act as secure intermediaries between:
The customer’s issuing bank
The merchant’s acquiring bank
Card networks like Visa, Mastercard, and Amex
Alternative international payment methods such as PayPal, Alipay, and Wise
Their primary function is to ensure that a transaction is authenticated, encrypted, and completed without exposing sensitive information.
2. How International Payment Gateways Work
Although the process happens in seconds, an international transaction goes through several steps:
Step 1: Customer Initiates Payment
A buyer selects a product or service on a website or app and chooses a payment method — credit card, digital wallet, or bank transfer.
Step 2: Encryption and Authorization
The payment information is encrypted by the gateway to prevent theft or fraud.
The gateway then forwards the encrypted request to:
The merchant’s bank
The relevant card network
The customer’s bank
Step 3: Verification
The customer’s bank verifies:
Card or account validity
Available balance
Compliance and anti-fraud checks
If all parameters are satisfied, the bank approves the transaction.
Step 4: Transaction Approval
The authorization signal is sent back through the same route — issuer bank → network → acquiring bank → payment gateway → merchant.
Step 5: Currency Conversion
For cross-border payments, the gateway automatically converts the amount to the merchant’s preferred settlement currency using:
Real-time FX rates
Predefined conversion margins
Step 6: Settlement
Funds are transferred to the merchant’s bank account after settlement cycles, typically ranging from 1–7 days depending on the gateway and region.
3. Key Features of International Payment Gateways
To operate globally, gateways must include advanced capabilities:
a. Multi-Currency Support
They can accept payments in dozens or hundreds of currencies, enabling customers to pay in their local currency while the merchant receives in their preferred one.
b. Global Payment Methods
They support:
International cards
Cross-border wallets (PayPal, Skrill, Alipay)
Bank debits
Buy Now Pay Later services
QR-based global payments
c. Fraud Prevention Systems
Gateways employ:
3D Secure
AI-based fraud detection
AVS (Address Verification System)
Tokenization
Risk scoring
These safeguards are crucial in cross-border transactions where fraud risks are higher.
d. Strong Compliance Framework
Gateways must comply with:
PCI DSS (Payment Card Industry Data Security Standard)
KYC/AML regulations
GDPR and data protection laws
Local banking laws
Compliance ensures security and global acceptance.
e. Multiple Payment Channels
They provide:
API integration for websites and apps
Hosted payment pages
Payment links
Invoicing systems
Subscription billing for global SaaS
This versatility makes them valuable for small businesses and multinational corporations alike.
4. Major International Payment Gateways
Several global companies dominate the cross-border payments industry:
a. PayPal
One of the oldest and most trusted global payment services supporting over 200 countries and 25 currencies. Ideal for freelancers, eCommerce, and subscription businesses.
b. Stripe
Known for developer-friendly APIs, multi-currency support, and advanced fraud tools. Popular among tech startups, SaaS companies, and global marketplaces.
c. Payoneer
Widely used for cross-border payouts, especially by freelancers, eCommerce sellers, and international service providers.
d. Razorpay International
An Indian-origin payment gateway that now supports global payments, allowing businesses to accept more than 100 currencies.
e. Adyen
A unified global payment platform trusted by enterprise clients like Netflix, Spotify, and Uber.
f. Checkout.com
A fast-growing global gateway offering high approval rates and advanced fraud detection.
Each gateway differs in fees, supported currencies, payout mechanisms, and integration flexibility, allowing businesses to choose based on their requirements.
5. Importance of International Payment Gateways in Global Trade
a. Expanding Business Reach
With cross-border payments, even small businesses can sell globally—expanding their customer base without physical presence.
b. Convenience for Customers
International buyers prefer paying in their local currency using familiar methods. Gateways make this possible, improving conversion rates.
c. Secure and Fast Payments
They reduce risk through encryption, risk scoring, and compliance protocols, ensuring trust.
d. Multi-Currency Pricing Advantages
Businesses can display prices in local currencies, enhancing transparency and reducing cart abandonment.
e. Support for Global Marketplaces
Marketplaces like Amazon, eBay, and Etsy rely heavily on sophisticated global gateways to pay sellers and collect payments securely.
6. Challenges of International Payment Gateways
Despite their advantages, they face complexities:
a. Higher Fees
Cross-border fees, currency conversion charges, and settlement costs make transactions more expensive than domestic ones.
b. Regulatory Complexity
Different countries have varying rules regarding:
Data localization
Foreign exchange laws
Merchant onboarding
Anti-fraud compliance
Gateways must continuously adapt to these requirements.
c. Fraud Risk
Cross-border fraud is more sophisticated, requiring advanced risk management systems.
d. Settlement Delays
International settlements sometimes take longer due to intermediary banks and FX processes.
e. Currency Volatility
Exchange rate fluctuations can impact merchant revenues unless hedged properly.
7. The Future of International Payment Gateways
Global payment systems are evolving fast with new technologies:
a. Blockchain and Crypto Payments
Decentralized systems promise:
Instant cross-border transfers
Lower fees
Transparent settlements
Gateways are increasingly integrating stablecoin and blockchain-based payments.
b. AI-Based Fraud Systems
AI models help detect suspicious behavior in milliseconds, reducing chargebacks.
c. Real-Time Cross-Border Payments
New initiatives like SWIFT gpi, UPI-Linkages, and digital currency corridors are speeding up transactions globally.
d. Embedded Finance
Gateways will become part of every app, allowing payments through social media, messaging apps, and IoT devices.
Conclusion
International payment gateways are essential for enabling smooth, secure, and efficient global transactions. They empower businesses of all sizes to expand worldwide by offering multi-currency support, global payment methods, compliance tools, and advanced security systems. While challenges such as regulatory complexity and fraud risks remain, technological advancements are continuously improving the speed, safety, and affordability of cross-border payments. In an increasingly interconnected world, international payment gateways will remain at the center of global commerce, driving digital trade and financial inclusion across nations.

Investing in the World Trade Market1. Understanding the World Trade Market
The world trade market is not a single unified marketplace. Instead, it consists of several interconnected segments:
Goods and Services
Countries trade products such as automobiles, electronics, oil, agricultural goods, and software services. Investors can participate through stocks, ETFs, or multinational companies involved in global trade.
Foreign Exchange (Forex)
Global currency trading supports international business. Investors participate to profit from exchange rate fluctuations driven by economic data, interest rates, and geopolitical events.
Commodities
Oil, natural gas, gold, silver, wheat, and other commodities are exchanged globally. Commodity markets are crucial because they influence trade balances, inflation, and corporate profitability.
Global Financial Markets
International stock markets, bonds, derivatives, and cross-border investment instruments allow investors to trade foreign assets.
Together, these components form the backbone of global commerce, offering multiple investment avenues.
2. Why Invest in the World Trade Market?
a. Diversification Beyond Domestic Borders
Investing globally spreads risk across countries and industries. When one nation faces recession, another may experience growth. Diversification helps protect capital from country-specific political or economic downturns.
b. Access to High-Growth Economies
Many emerging markets—India, China, Vietnam, Brazil, and African economies—offer rapid growth rates higher than developed countries. Investing early in these regions can yield substantial long-term returns.
c. Exposure to Global Brands
Companies like Apple, Toyota, Samsung, Nestlé, and LVMH operate across continents. Investors benefit from their global revenues and stability.
d. Currency Appreciation
Global investing exposes investors to foreign currencies. Gaining from strong currencies can multiply returns when converted back into the home currency.
e. Hedge Against Domestic Market Instability
If the domestic market faces inflation, political instability, or economic slowdown, global assets may provide stability.
3. Ways to Invest in the World Trade Market
Investors can participate globally in several ways depending on risk tolerance, knowledge, and financial goals.
a. International Stocks
Investors can buy shares of foreign companies through:
Direct foreign exchanges
Indian brokers offering global investment accounts
American Depositary Receipts (ADRs)
Global Depositary Receipts (GDRs)
This provides direct exposure to overseas corporations.
b. Exchange-Traded Funds (ETFs)
Global ETFs track:
Foreign stock indices (e.g., S&P 500, Nikkei, FTSE)
Global bonds
Emerging markets
Commodities
Multi-asset portfolios
They offer simplicity, diversification, and lower cost.
c. Forex Trading
Investors trade currency pairs like:
USD/INR
EUR/USD
GBP/JPY
Forex gives quick profit potential but carries high volatility and requires knowledge.
d. Commodity Investments
Investors can trade:
Gold and silver
Oil and natural gas
Agriculture (wheat, cotton, coffee)
Commodities are influenced by supply–demand dynamics, weather, geopolitical tensions, and global economic cycles.
e. Global Mutual Funds
Mutual fund companies offer international and global schemes, allowing investors exposure without direct trading in foreign markets.
f. Investing in Multinational Corporations (MNCs)
Buying shares of companies heavily engaged in global trade gives indirect access to world markets. These companies spread risk across continents and benefit from diverse revenue streams.
g. Digital Assets (Crypto)
Crypto markets operate globally and provide decentralized trading opportunities. However, they carry higher risk and require regulatory awareness.
4. Factors Driving Success in World Trade Investments
To succeed in the world trade market, investors must understand key global drivers.
a. Geopolitical Stability
Conflicts, trade wars, sanctions, or diplomatic tensions affect global markets. For example:
War can raise oil and gold prices.
Trade sanctions can reduce corporate profits.
Political instability disrupts supply chains.
b. Economic Indicators
Investors track:
GDP growth
Inflation
Interest rates
Employment data
Consumer spending
Countries with strong indicators attract foreign capital and generate higher returns.
c. Global Supply Chain Trends
Events like pandemics, port shutdowns, or semiconductor shortages create volatility. Understanding these trends helps investors position themselves better.
d. Currency Strength
A strong foreign currency boosts returns when converted back into the home currency. Conversely, currency depreciation can reduce profits.
e. Technological Advancements
Technology facilitates global trade through:
E-commerce
Digital payments
Blockchain logistics
AI-driven global analytics
Industries adopting modern innovations often grow faster.
5. Risks of Investing in the World Trade Market
While opportunities are high, global investing carries distinct risks.
a. Currency Risk
A profitable foreign investment could still result in loss if the target country’s currency weakens relative to the investor’s home currency.
b. Geopolitical Risk
Wars, coups, border disputes, and political changes can disrupt markets.
c. Regulatory Differences
Each country has unique taxation rules, trading restrictions, and compliance standards.
d. Economic Instability
Recessions, inflation, or corporate bankruptcy in foreign nations can negatively affect investments.
e. Liquidity Risk
Some international markets lack trading volume, making it hard to buy or sell assets quickly.
f. Information Gap
Investors may not fully understand foreign markets due to language, cultural, or informational barriers.
Understanding and mitigating these risks is crucial for long-term success.
6. Strategies for Smart Global Investing
a. Research Countries Before Investing
Consider:
Economic strength
Growth potential
Political stability
Currency trends
Market regulations
b. Diversify Across Regions
Spread investments across:
Developed markets (USA, Europe, Japan)
Emerging markets (India, Brazil, Indonesia)
Frontier markets (Africa, Vietnam)
c. Use Global ETFs for Beginners
They provide:
Automated diversification
Low cost
Easy access
Reduced risk
d. Hedge Currency Exposure
Some global funds offer currency-hedged versions to minimize exchange-rate risk.
e. Keep a Long-Term Perspective
Global markets move slower than domestic ones but yield stable, compounding returns over time.
f. Stay Updated with Global News
Monitor:
Trade agreements
Economic releases
Interest-rate decisions
Commodity price movements
Being informed helps anticipate trends earlier.
7. The Future of the World Trade Market
The next decade will transform global investing due to:
Rise of digital currencies
Expansion of India and Southeast Asia
Major shifts in manufacturing hubs
AI-driven global forecasting
Green energy and carbon-credit trading
Growth of cross-border fintech platforms
Global trade is becoming faster, more digital, and more interconnected, opening significantly larger opportunities for investors worldwide.
Conclusion
Investing in the world trade market allows investors to participate in the global economy, benefit from international growth, and diversify their portfolios beyond domestic boundaries. Although it comes with risks such as currency fluctuations, political uncertainty, and regulatory complexities, strategic planning, informed research, and diversification can help investors achieve strong long-term returns. As the world continues to integrate economically, global markets will increasingly influence investment outcomes, making world trade investing not only an opportunity but a necessity for modern investors.

Potential bearish drop off?Loonie (USD/CAD) has reacted off the pivot and could drop to the 1st support.
Pivot: 1.3986
1st Support: 1.3879
1st resistance: 1.4048
Disclaimer:
The opinions given above constitute general market commentary and do not constitute the opinion or advice of IC Markets or any form of personal or investment advice.
Any opinions, news, research, analyses, prices, other information, or links to third-party sites contained on this website are provided on an "as-is" basis, are intended to be informative only, and are not advice, a recommendation, research, a record of our trading prices, an offer of, or solicitation for, a transaction in any financial instrument and thus should not be treated as such. The information provided does not involve any specific investment objectives, financial situation, or needs of any specific person who may receive it. Please be aware that past performance is not a reliable indicator of future performance and/or results. Past performance or forward-looking scenarios based upon the reasonable beliefs of the third-party provider are not a guarantee of future performance. Actual results may differ materially from those anticipated in forward-looking or past performance statements. IC Markets makes no representation or warranty and assumes no liability as to the accuracy or completeness of the information provided, nor any loss arising from any investment based on a recommendation, forecast, or any information supplied by any third party.

Bearish drop?USD/JPY is reacting off the pivot, which acts as a pullback resistance and could drop to the 1st support.
Pivot: 155.79
1st Support: 154.14
1st Resistance: 156.91
Disclaimer:
The opinions given above constitute general market commentary and do not constitute the opinion or advice of IC Markets or any form of personal or investment advice.
Any opinions, news, research, analyses, prices, other information, or links to third-party sites contained on this website are provided on an "as-is" basis, are intended to be informative only, and are not advice, a recommendation, research, a record of our trading prices, an offer of, or solicitation for, a transaction in any financial instrument and thus should not be treated as such. The information provided does not involve any specific investment objectives, financial situation, or needs of any specific person who may receive it. Please be aware that past performance is not a reliable indicator of future performance and/or results. Past performance or forward-looking scenarios based upon the reasonable beliefs of the third-party provider are not a guarantee of future performance. Actual results may differ materially from those anticipated in forward-looking or past performance statements. IC Markets makes no representation or warranty and assumes no liability as to the accuracy or completeness of the information provided, nor any loss arising from any investment based on a recommendation, forecast, or any information supplied by any third party.

GOLD breaks out of accumulation phaseOANDA:XAUUSD has moved from a consolidation phase to an active bull run: spot is trading around ~$4,200/oz, supported by expectations of Fed easing (markets are pricing in ~89% probability of a 25bp cut in December), central bank buying and a still uncertain geopolitical backdrop. In this context, a $5,000/oz target is no longer a pipe dream but a conceivable scenario, but only if a number of technical and fundamental conditions align.
Analysis (fundamentals — geopolitics)
1. Fundamentals: Central banks’ net buying (WGC: strong net buying), a weaker USD and falling real Treasury yields are the three fundamentals supporting gold. Recent weak US economic data (weak manufacturing PMI, ADP and PCE potentials reinforce cooling sentiment) push the market to price in higher interest rate cuts, reducing the opportunity cost of holding gold.
2. Geopolitics: Russia-Ukraine negotiations remain uncertain; regional tensions (Middle East, US-Venezuela relations…) maintain safe-haven demand. External shocks could spur rapid and strong demand for gold.
Conditions for the $5,000 scenario (necessary & sufficient)
• Necessary: The Fed makes at least one 25 bps cut in the near term (December) or the market is certain of a rate cut cycle; real yields continue to fall; the USD remains weak; the central bank continues to buy net.
• Sufficient: Price breaks the $4,216–$4,226 resistance zone on higher than average volume, accompanied by a sustained decline in real yields (-real basket) and no sharp reversal in the USD. When all three factors (technical break, real yield decline, sustained official demand) are present, the $5,000 target becomes a trackable possibility in the medium-long term.
Risks
Bear case risks include: the Fed unexpectedly takes a hard/clear stance without cutting, the USD strengthens again (e.g. due to better employment data), or market liquidity declines leading to massive profit-taking by funds. These factors could push gold back below $4,000 and break the short-term bullish structure.
In summary, the journey to $5,000 is a structurally plausible scenario: the macro fundamentals and the official demand flow are tilted to the upside, but that scenario will only be triggered by a volume-driven technical breakout combined with a sustained decline in real yields. I maintain a cautiously positive stance, closely monitoring the underlying geopolitical developments and yield developments to assess the sustainability of this rally.
Technical analysis and recommendations OANDA:XAUUSD
Gold price is maintaining a clear bullish structure as it continues to follow the medium-term rising channel and holds the important support zone around 4,128 – 4,130 USD/ounce (Fibo 0.236). The price continuously making higher lows and bouncing back above the short-term MA shows that active buying power is still dominant. The most recent candlestick pattern shows strong absorption at the support zone, implying that money flow is protecting the uptrend.
With no break below 3,973 USD/ounce (Fibo 0.382), the bullish structure continues to be consolidated. The next target of the current cycle is 4,300 – 4,380 USD/ounce, corresponding to the top of the rising channel and the extended Fibo zone. RSI is recovering from the neutral zone, showing that the upside momentum still has room to grow.
SELL XAUUSD PRICE 4277 - 4275⚡️
↠↠ Stop Loss 4281
→Take Profit 1 4269
↨
→Take Profit 2 4263
BUY XAUUSD PRICE 4191 - 4193⚡️
↠↠ Stop Loss 4187
→Take Profit 1 4199
↨
→Take Profit 2 4205
