Swing Failure Pattern (SFP): When Price ReversesThe swing failure pattern is a liquidity event, not a candle pattern. It marks the moment when the market reaches for obvious stops, absorbs them, and reveals true intent.
An SFP forms when price trades beyond a well-defined swing high or low and then fails to hold acceptance outside that level. The extension triggers breakout entries and stop losses. The immediate rejection back inside the range confirms that the move was used to collect liquidity rather than to continue.
What the structure tells you
The key information is not the wick itself, but the context around it. The prior high or low must be obvious and widely watched. Equal highs, range extremes, or clean swing points carry the most liquidity. When price briefly breaks that level and closes back inside, the market signals that opposing orders have been filled.
This failure traps late participants. Breakout traders are positioned in the wrong direction, while stop losses from earlier positions have already been taken. That imbalance becomes fuel for the next move.
Why SFPs matter
SFPs often appear at major range boundaries or after extended directional moves. In ranges, they define the edges where reversals are most likely. In trends, they frequently mark local distribution or accumulation before a deeper retracement or full reversal.
The move after the SFP is usually cleaner than the move into it. Once liquidity is taken, price no longer needs to revisit the level. Structure shifts, momentum changes, and expansion follows away from the failed breakout.
How to use SFPs correctly
An SFP is not a signal by itself. It requires confirmation through acceptance back inside the range and alignment with higher-timeframe context. When combined with structure, it provides precise locations where risk can be defined tightly and intent is clear.
The market does not reverse because price touched a level. It reverses because liquidity was collected and the objective at that level was completed. The swing failure pattern is the footprint of that process.
M-oscillator

INIL, 1D - Descending Channel breakoutINIL,1D
Descending channel breakout and perfect re-test.
TPs: 205, 220, 250
SL: 175
Arsalan Anwer
Stags

Alibaba May Be Breaking DownAlibaba climbed sharply in September, but some traders may think it’s giving back the gains.
The first pattern on today’s chart is the failed rally after the last earnings report on November 25. BABA has made lower highs since that session, resulting in a potentially bearish descending triangle.
Second, prices closed below the triangle’s bottom yesterday. Could that represent a breakdown?
Third, last month’s peak continued a succession of lower weekly highs. Prices are also below the 50-day simple moving average. Those signals may be consistent with a bearish intermediate-term trend.
Next, MACD is falling and the 8-day exponential moving average (EMA) is below the 21-day EMA. Those signals may reflect a bearish short-term trend.
Finally, BABA is an active underlier in the options market. (It’s averaged 166,000 contracts per session in the last month, according to TradeStation data.) That may help traders take positions with calls and puts.
TradeStation has, for decades, advanced the trading industry, providing access to stocks, options and futures. If you're born to trade, we could be for you. See our Overview for more.
Past performance, whether actual or indicated by historical tests of strategies, is no guarantee of future performance or success. There is a possibility that you may sustain a loss equal to or greater than your entire investment regardless of which asset class you trade (equities, options or futures); therefore, you should not invest or risk money that you cannot afford to lose. Online trading is not suitable for all investors. View the document titled Characteristics and Risks of Standardized Options at www.TradeStation.com . Before trading any asset class, customers must read the relevant risk disclosure statements on www.TradeStation.com . System access and trade placement and execution may be delayed or fail due to market volatility and volume, quote delays, system and software errors, Internet traffic, outages and other factors.
Securities and futures trading is offered to self-directed customers by TradeStation Securities, Inc., a broker-dealer registered with the Securities and Exchange Commission and a futures commission merchant licensed with the Commodity Futures Trading Commission). TradeStation Securities is a member of the Financial Industry Regulatory Authority, the National Futures Association, and a number of exchanges.
Options trading is not suitable for all investors. Your TradeStation Securities’ account application to trade options will be considered and approved or disapproved based on all relevant factors, including your trading experience. See www.TradeStation.com . Visit www.TradeStation.com for full details on the costs and fees associated with options.
Margin trading involves risks, and it is important that you fully understand those risks before trading on margin. The Margin Disclosure Statement outlines many of those risks, including that you can lose more funds than you deposit in your margin account; your brokerage firm can force the sale of securities in your account; your brokerage firm can sell your securities without contacting you; and you are not entitled to an extension of time on a margin call. Review the Margin Disclosure Statement at www.TradeStation.com .
TradeStation Securities, Inc. and TradeStation Technologies, Inc. are each wholly owned subsidiaries of TradeStation Group, Inc., both operating, and providing products and services, under the TradeStation brand and trademark. When applying for, or purchasing, accounts, subscriptions, products and services, it is important that you know which company you will be dealing with. Visit www.TradeStation.com for further important information explaining what this means.

AUD/JPY eyes 102.40 as BOJ loomsThe bearish correction in AUD/JPY has stalled above the key 102.40 level, coinciding with the swing high set in November 2024. While the pair bounced on Wednesday after an exploratory probe beneath the level, it remains close enough to use for protection depending on how near-term price action evolves.
With the message from the oscillators more neutral than bullish, with RSI (14) approaching 50 while MACD has crossed the signal line from above and is pushing lower, price action should take precedence when assessing whether to go long or short.
If AUD/JPY can hold 102.40 into the European session, consider initiating longs with a stop beneath the level for protection, targeting a retest of resistance above 104 and the December swing high.
But if the pair reverses back beneath 102.40 into the European open and holds there, the setup could be flipped, with shorts established on the break and a stop above for protection, targeting 101.50 initially.
Friday’s Bank of Japan interest rate decision looms as a major volatility catalyst, so ensure risk management is top of mind when assessing setups. I suspect the bank will deliver a dovish hike, lifting overnight rates by 25 basis points while talking down the urgency for more imminently. Such an outcome would normally lend itself to upside, given the pair has seen strong relationships with risk appetite and rate differentials between Australia and Japan over recent weeks.
Good luck!
DS

Long Term Silver Bull Going ShortThis post is a follow up to my "Grand Silver Supercycle" chart posted on 2/2/2023. I recommend referencing that chart to understand my commentary here. In that chart, I called for silver to double in price by the end of 2025 and to reach $95 by 2027. Since then, silver has overshot my near term price targets. I'm here to argue that silver has gone up too far too quickly and is due for a sharp pullback to the $50-$55 range.
Why am I calling this the near term top?
Silver has very neatly followed Elliot Wave Theory throughout its history. In 2023, I predicted Wave 3 of the current cycle, which began with the low in the summer of 2022, to have a 1.618 extension of Wave 1. Instead, silver just reached the 2.618 extension, which back in 2023, I thought was too bold of a prediction. While it is possible for a 4.618 extension to 102.5, these extensions are very rare. The bias is towards a pullback here.
There is also a convergence between the Elliot Wave extension, a fib retracement level, and logarithmic trendline. This indicates that any attempts to breakout higher will face strong resistance.
Finally, I need to talk about gold. The monthly RSI has been over 90 for 3 months, closing in on 4 months. Gold has only held an RSI above 90 for 4 consecutive months at one point prior in its charted history. Gold is still silver's big brother and will determine the direction the two move.

XAUUSD BUY ENTRYAs GOLD has been significantly rallying I'm going to place buy limit order on that DEMAND/LPS zone

Pickup $ROKU ahead of monster breakoutNASDAQ:ROKU is on the cusp of a potential breakout with monster upside targets of 50% and 100%.
The weekly chart shows the broader picture with a years long consolidation period pressing at times on the current resistance $110/$111 area. Notably Morgan Stanley has upgraded the stock to overweight, however there's pressure from insider selling to contend with.
Recent action shows a tighter consolidation, highlighted on the 4h chart. The slight bearish divergence suggests it may take a bit longer for the price to finally break through resistance so choose call expiries wisely. I'm targeting June of 2026 with my bag.


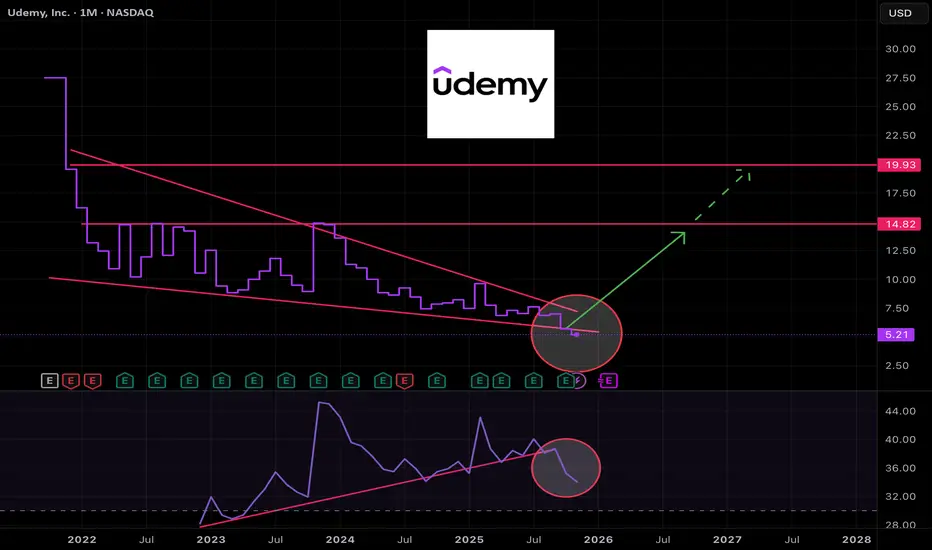
UDMY turning profitable and in deep value territoryNASDAQ:UDMY stock has been left for dead. It's formed a massive falling wedge on the monthly chart and until late has done so with improving momentum.
While not strictly aligned to disciplined charting techniques I view the recent meltdown in momentum as capitulation and a good time to start a small position.
Looking at the annual and quarterly profit figures we can see the company has been bleeding cash for years, but in recent quarters is starting to make a small profit.
It's a speculative buy, so keep the position sizing small, but I think there's room to double or even triple with sufficient time.
Hubco Daily Technical levels and Bearish DivergenceThere is a clear Bearish Divergence on Daily and Weekly Timeframe.
It may retrace to 217 or to 205.
There are two scenarios
1) The price action will be in range bound for some time until it breakout above 232.
2) it could drop to 205 range. which will be a good buy opportunity for investors.
For Trader: Wait for 232 to breakout.
Note: Always trade with proper risk management.

INTC – What Price and Volume Are Telling Us ?INTC - CURRENT PRICE : 37.40 - 37.60
INTC is currently undergoing a controlled pullback within a broader rising structure, as indicated by the rising trendline support (white dashed line). Notably, the recent price decline is accompanied by diminishing volume, which suggests that selling pressure is losing momentum rather than aggressive distribution.
This type of price-down / volume-down behavior typically reflects profit-taking and short-term exhaustion by sellers, often seen during healthy corrections within an uptrend. As long as price continues to respect the rising trendline, the broader bullish structure remains intact.
From a volume perspective, there is no evidence of panic selling, while prior upswings were supported by higher relative volume — reinforcing the view that buyers remain in control at higher timeframes.
Take note that stochastic oscillator is approaching near oversold zone. In an uptrend, any oversold condition may be considered as a potential buy on dips.
Trading Plan (Price & Volume Based)
Buy on pullback near the rising trendline support
ENTRY PRICE : 36.00 - 37.00 zone
Upside Targets:
🎯 Target 1: 40.00 (near-term resistance)
🎯 Target 2: 44.00 (prior swing high)
🧊 Cut Loss: Below 33.00, which would signal a breakdown of trend support.

NVA.TO — Swing Trade Idea💰 NVA.TO — Swing Trade Idea
🏢 Company Snapshot
• NuVista Energy is a Canadian natural gas–weighted E&P with Montney exposure
• Matters now due to sustained uptrend, higher lows, and constructive Energy sector tape supporting continuation setups
📊 Fundamental Context (Trade-Relevant Only)
• Valuation: Trading at a discount to large-cap peers, typical for gas-weighted names
• Balance Sheet: Deleveraging trend, manageable net debt
• Cash Flow: Stable to improving, leveraged to gas pricing
• Dividend: Modest; neutral to supportive
Fundamental Read: Balance sheet stability and cash flow visibility support holding risk through a technical pullback within trend.
🪙 Industry & Sector Backdrop
• Short-Term (1–4 weeks): Energy consolidating but relative strength vs TSX remains intact
• Medium-Term (1–6 months): Uptrend persists with higher highs across Canadian Energy
• Macro Influence: Natural gas volatility, but no immediate macro headwind to trend continuation
Sector Bias: Bullish
📐 Technical Structure (Primary Driver)
• Trend: Above rising 50-SMA, well above 200-SMA
• Momentum: RSI(2) reset into oversold, now stabilizing near trend support
• Pattern: Orderly pullback from recent highs into rising 50-SMA (mean-reversion within trend)
• Volume: No distribution spike; pullback volume contracting vs prior advance
Key Levels
• Support: 17.40 – 17.60 (50-SMA + prior structure)
• Resistance: 18.90 – 19.10 (recent highs / measured move)
🎯 Trade Plan (Execution-Focused)
• Entry: 17.50 – 17.70 on confirmation hold above 50-SMA
• Stop: 17.35 (clean break below trend support invalidates)
• Target: 19.00 (prior high / continuation extension)
• Risk-to-Reward: ~2.4R
Alternate Scenario:
• If price loses 50-SMA, stand aside and reassess near 17.00 for a deeper trend-support reaction.
🧠 Swing Trader’s Bias
Price remains in a controlled uptrend with RSI(2) resetting into a high-probability support zone. Looking for a continuation move back toward recent highs on confirmation strength. A decisive close below the 50-SMA invalidates the setup.

EURUSD sellEURUSD approached my weekly high from the last week on 1hr timeframe. If we take a look at 1hr timeframe, we can see a DXY confirmation showing a sign of reversal.
Overall technical bias show a bearish trend for this week, in terms of fundamentals on DXY, this day should be neutral - I recommend extreme cautiousness on Tuesday and Thursday when taking EU/GU shorts

AUD/USD tests 0.6625 as bulls lose steamAUD/USD has retraced back towards 0.6625, a level that previously capped bullish advances earlier in the year. Having already tested the level before bouncing, the proximity allows for two-way trades to be established depending on how price action evolves in the near term.
The message from RSI (14) and MACD is one of waning upside strength, providing a cautious signal to bulls rather than an outright bearish bias favouring downside. That adds weight to placing more emphasis on price action when assessing directional risks and trade setups.
Should the pair continue to hold above 0.6625, longs could be set above the level with a stop below, targeting 0.6685 (10 Dec high) or resistance at 0.6700.
Alternatively, if the pair extends the bearish retracement beneath 0.6625 and holds there, the setup could be flipped with shorts set on the break with a stop above for protection. 0.6580 (13 Nov high) or 50-day moving average both screen as potential targets, although those entering the trade should pay close attention to price action around 0.6600. If the price can’t push through convincingly, consider nixing the position.
Good luck!
DS

Stocking up on longs as Christmas cheer kicks inHaving failed to clear resistance layered above 8,726 last week, our ASX 200 contract has retraced back towards support at 8,575 and bounced, generating a setup where traders can look to play what is typically a strong seasonal period for Australian equities without leaving too much risk on the table.
Longs could be set above 8,575 with a stop below, targeting a bullish reversal back towards resistance at 8,726. While the oscillators are providing mildly bearish signals, with RSI (14) pushing lower away from the neutral level and MACD rolling over towards the signal line while remaining in negative territory, the message is overridden given we’re approaching the roll in futures and the likelihood of far lower volumes heading into Christmas.
Essentially, this trade is underpinned by the Santa rally playing out as institutional traders pack up for the year, providing a window for retail to dominate proceedings.
Good luck!
DS

NZDUSD to find buyers at previous support?NZDUSD - 24h expiry
There is no clear indication that the upward move is coming to an end.
Although we remain bullish overall, a correction is possible with plenty of room to move lower without impacting the trend higher.
Risk/Reward would be poor to call a buy from current levels.
A move through 0.5800 will confirm the bullish momentum.
The measured move target is 0.5850.
We look to Buy at 0.5760 (stop at 0.5725)
Our profit targets will be 0.5835 and 0.5850
Resistance: 0.5800 / 0.5825 / 0.5850
Support: 0.5775 / 0.5760 / 0.5725
Risk Disclaimer
The trade ideas beyond this page are for informational purposes only and do not constitute investment advice or a solicitation to trade. This information is provided by Signal Centre, a third-party unaffiliated with OANDA, and is intended for general circulation only. OANDA does not guarantee the accuracy of this information and assumes no responsibilities for the information provided by the third party. The information does not take into account the specific investment objectives, financial situation, or particular needs of any particular person. You should take into account your specific investment objectives, financial situation, and particular needs before making a commitment to trade, including seeking, under a separate engagement, as you deem fit.
You accept that you assume all risks in independently viewing the contents and selecting a chosen strategy.
Where the research is distributed in Singapore to a person who is not an Accredited Investor, Expert Investor or an Institutional Investor, Oanda Asia Pacific Pte Ltd (“OAP“) accepts legal responsibility for the contents of the report to such persons only to the extent required by law. Singapore customers should contact OAP at 6579 8289 for matters arising from, or in connection with, the information/research distributed.

How To Enter Using The 3-Step Rocket Booster StrategyThe price is following the trend line upward
Waiting for the stochastic to signal momentum shift
for entry.
Avoid entering the trade
before the stochastic crosses below
This is the entry signal you should wait for.
You may be thinking,
" But what if it doesn't go my way?"
Yes the trade may end up going in the
opposite direction
But you need to make sure you
have planned for risk management and profit taking
ranges between 10% to 50%
This range is what i saw in the cashflow
board game
created by Richdad company.
Also remember that this price action
follows the 3 step rocket booster strategy
What is the Rocket booster strategy?
1-The price has to be above the 50 EMA
2-The price has to be above the 200 EMA
3-The price should gap up or reverse in this case
Rocket boost this content to learn more.
Disclaimer:Trading is risky please use a simulation
trading account before you trade with real money
FRSH - Long US MarketFRSH
Back at historic support of approx 10.50-11.50.
Breaking trend line with bullish harmonic patterns behind it and back testing support level.
Class A MACD bullish divergence on weekly, indicating potential strong reversal
Exit 25% of position at each TP level.
Weekly trade so could be slow going, but historically this moves fast.
Have previously traded this stock from this level with good results.

LGEN - UK LongPrice is above weekly and daily 200ma
Local reaccum range broken
Break above historic level 2014 high and break/test of local reaccum range
Weekly hidden bullish divergence on MACD
Tight stop
Slow boomer stock trade

Canadian Natural Resources Ltd. (CNQ) — Swing Trade💰 CNQ — Swing Trade Breakdown (TSX)
Canadian Natural Resources Ltd.
🏢 Company Snapshot
Canadian Natural Resources (CNQ) is one of Canada’s largest integrated energy producers, with long-life oil sands, heavy oil, natural gas, and offshore assets. The stock is drawing attention after a sharp pullback into its rising 50-day moving average, aligning with mean-reversion setups in an otherwise intact primary uptrend and continued strength in crude prices.
📊 Fundamentals
Valuation & Profitability
P/E: ~10–11×
Below large-cap North American E&P peers, reflecting disciplined capital returns rather than aggressive growth.
P/B: ~2.0–2.2×
Reasonable for a high-ROE, asset-heavy producer with long reserve life.
ROE: ~25–30%
Strong profitability driven by operating leverage and cost control.
Balance Sheet & Cash Flow
Debt/Equity: ~0.4–0.5
Moderate leverage and steadily improving balance sheet.
Free Cash Flow: Strong and recurring
Supports dividends, buybacks, and debt reduction even at mid-cycle oil prices.
Dividend Yield: ~4.5–5%
Attractive income component with a long track record of dividend growth.
Summary:
High-quality large-cap energy name with strong free cash flow, disciplined capital returns, and a reasonable valuation relative to peers.
📈 Trends & Catalysts
Revenue Growth:
Moderate YoY growth, largely driven by commodity pricing and stable production volumes.
EPS Trend:
Uptrend over the past year, with some quarterly volatility tied to oil price fluctuations.
Cash Flow Trend:
Consistently strong; excess cash increasingly directed toward shareholder returns.
Balance Sheet:
Debt trending lower over time, improving financial resilience.
Catalysts:
Directional move in WTI crude oil
Continued share buybacks and dividend increases
Energy sector rotation during inflationary or risk-off macro phases
Seasonal winter demand and geopolitical supply risks
Risks:
Pullback in crude oil prices
Broad market risk-off environment
Policy or regulatory pressure on Canadian energy producers
🪙 Industry Overview (Energy)
Weekly:
Performance: ▲ modest
Trend: Up
Sentiment: Bullish to Neutral
Monthly:
Performance: ▲
Trend: Up
Sentiment: Rotation back into energy on inflation and geopolitical risk
12-Month:
Performance: Outperforming TSX
Trend: Up
Sentiment: Supported by cash-flow durability and capital discipline
📐 Technicals (Daily Chart)
Price: ~45.4 CAD
50-SMA: ~45.5 CAD
Price pulling back into rising trend support.
200-SMA: Well below current price
Confirms long-term uptrend.
RSI(2): Oversold / deeply compressed
Classic mean-reversion condition within an uptrend.
Pattern: Pullback continuation
Higher-high structure intact despite recent volatility.
Key Levels
Support: 44.5 – 45.0
Resistance: 47.5 – 48.0
Volume:
Recent selloff occurred on elevated but not climactic volume, suggesting profit-taking rather than distribution.
🎯 Trade Plan (Swing)
Entry Zone:
45.0 – 45.5
Pullback into 50-SMA / prior support.
Stop Loss:
~44.7
Below recent swing low and trend invalidation level.
Target:
~47.7 – 48.0
Prior highs / resistance zone.
Risk/Reward:
~2:1
Meets minimum swing-trade criteria.
Alternate Setup:
Bullish continuation on a reclaim and hold above 46.5 with expanding volume.
🧠 My Take
CNQ remains a textbook large-cap energy swing candidate: strong fundamentals, reliable cash flow, and a clean technical pullback into trend support. As long as price holds the 50-SMA, this looks like a mean-reversion long targeting a retest of recent highs, with crude oil acting as the primary accelerator.

Bitcoin breakdown risk intensifiesSitting in a rising wedge following an extended downtrend, traders should be on alert for a resumption of the broader bearish trend in bitcoin, putting a retest of the November lows, or even the year-to-date lows, on the cards.
The price is now resting against the November uptrend, with a breach of this level opening the door for another potential wave of selling. If we see a break of $87,800—the low set on 7 December, which sits beneath the uptrend—shorts could be considered with a stop above to protect against reversal.
The 1 December low just beneath $84,000 screens as an initial target, with a break beneath that level putting the 21 November nadir of $80,540 on the menu for bears. Should that target be achieved, traders could assess whether to cut, hold, or reverse the position depending on price action at the time.
With RSI (14) breaking its uptrend and moving further away from the neutral 50 level, it indicates downside pressure is building yet again, favouring bearish setups. While not yet confirmed by MACD, it too is curling over towards the signal line, moving closer to a crossover that would strengthen the bearish signal.
Good luck!
DS

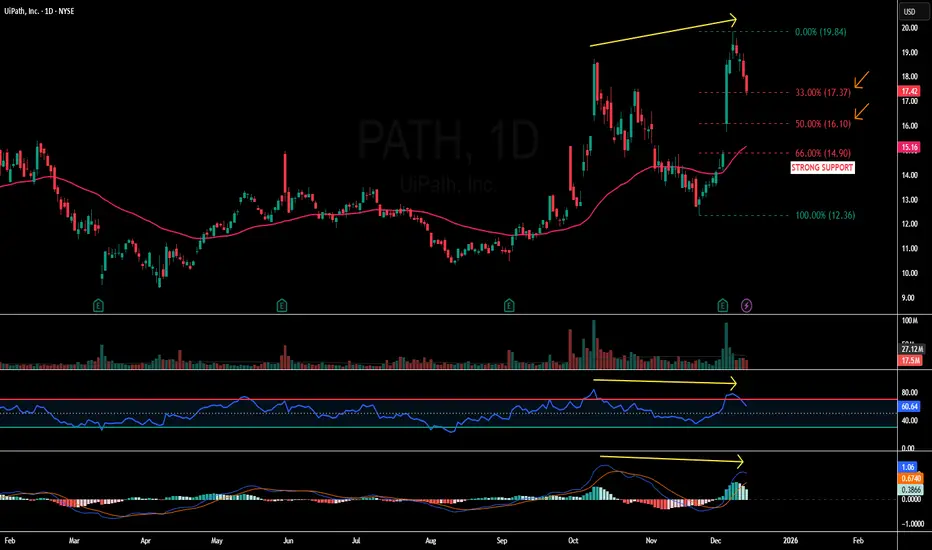
PATH - 14.90 – The Line That MattersPATH - CURRENT PRICE : 17.42
UiPATH (PATH) – Previous Targets Achieved, Buy-on-Dips Setup After Healthy Pullback
The previous technical buy call on UiPATH has successfully achieved all stated upside targets (refer to the earlier analysis via the shared link for reading context). Following this strong rally, the stock has now entered a pullback phase, which is technically expected after an extended upside move.
The current retracement is accompanied by a bearish divergence between price and momentum indicators (RSI & MACD) , as highlighted by the yellow arrows on the chart. Bearish divergence occurs when price makes a higher high while momentum indicators fail to confirm with higher highs, often signaling short-term exhaustion and a corrective move rather than a trend reversal. This explains the ongoing pullback and supports the view that the decline is corrective in nature.
From a structural perspective, the pullback remains constructive and healthy. Price has retraced approximately 33% of the prior advance, which aligns well with Dow Theory, where strong trends commonly retrace one-third or one-half before resuming the primary trend. Importantly, price continues to trade above the 50-day EMA, while both RSI and MACD remain in bullish territory, indicating that the broader bullish momentum is still intact despite near-term consolidation.
A critical level to watch is 14.90, which serves as STRONG SUPPORT. This level represents a two-thirds (≈66%) retracement under Dow Theory, coincides with a previous gap-up demand zone, and is located near the rising 50-day EMA, creating a strong confluence of technical support.
Trading Plan (Buy-on-Dips Approach):
At current levels, traders may consider initiating HALF of the intended position.
If price retraces further toward the 50% retracement level, the remaining half position may be added, as this remains a healthy pullback within an uptrend.
A decisive break below 14.90 (66% level) would invalidate the setup and should be treated as a cut-loss level.
As long as price holds above this support zone, the pullback can be viewed as a buy-the-dip opportunity, with the potential for the primary uptrend to resume.
FIRST TARGET : 18.50
SECOND TARGET : 19.80
SUPPORT : 14.90
ETH/BTC 6 hour Coinbase ChartETH/BTC Just closed a 6 hour candle at 0.03452 the same close 18 hours ago, but a higher wick than the previous close. The RSI is was higher this last 6 hour period. The Chaikin Oscillator sits at 0 with my settings.
I’m not predicting anything, it’s just an interesting observation. I will remain neutral adhering to risk management.
