The #1 Reason This Is A Strong Support Am currently thinking of the worse case scenario..
What if I fail in business?
What if I face a family crisis? For example the death of a family bread winner
What if Bitcoin or Ethereum or Pepe coin get delisted on the exchange?
Imagine this happens to you when you have borrowed 💰 money
On the price of Bitcoin going up.
Hoping to use that money to support your business or financial independence?
Life is full of challenges and you have to burn the ⛵ boat.
Now don't get reckless and place all your eggs in one basket.Thats foolishness right?
Well that's what I did I placed all my eggs in one basket.Atleast in the beginning.
Why ?
Because diversification is fake..
It doesn't exist.
What matters are systems and strategies.
With out the right mentors you will fall hard this is what happens to the best of us.
The key is to stay cool and fall back on a system.A system you can hang on to.
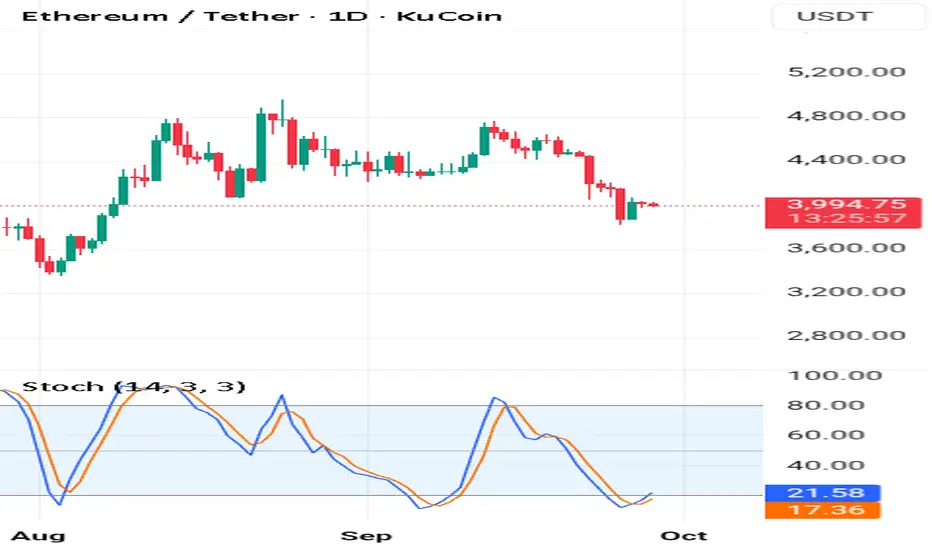
Ethereum has its faults but if you can trade it with confidence you will be okay.
Especially if you have a hardware wallet to store it in.
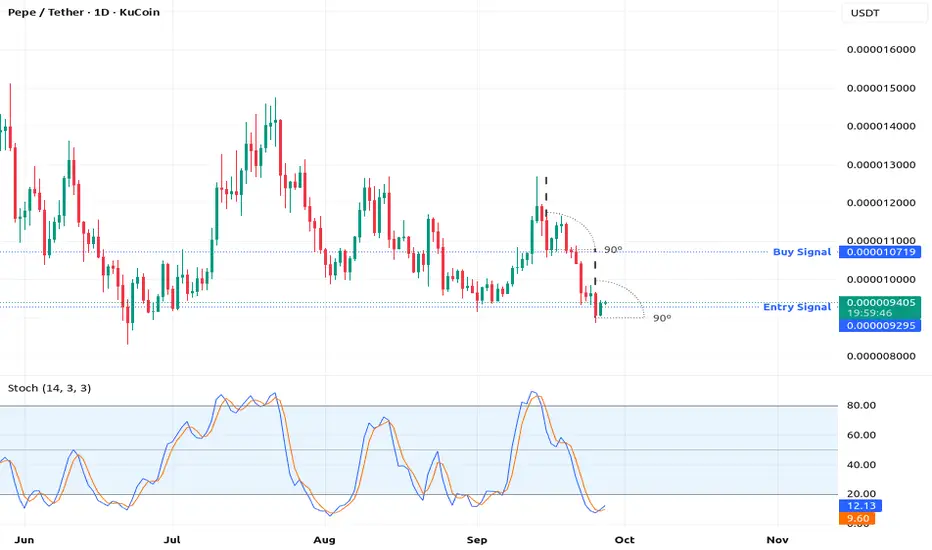
Look at the stochastic the blue line has crossed above the orange line.
Right below level 20 the oversold territory.
This has came after the bullish harami and so far the price is yet to break this support.
The bullish harami support is strong that the reason it's a good buy.
Rocket 🚀 Boost This Content To Learn More
⚠️Warning!!! Don't trade zero day options that expire in one day with high fees for forex trades.
Disclaimer ⚠️ Trading is risky please learn about risk management and profit taking strategies. Also feel free to use a simulation trading account.
M-oscillator
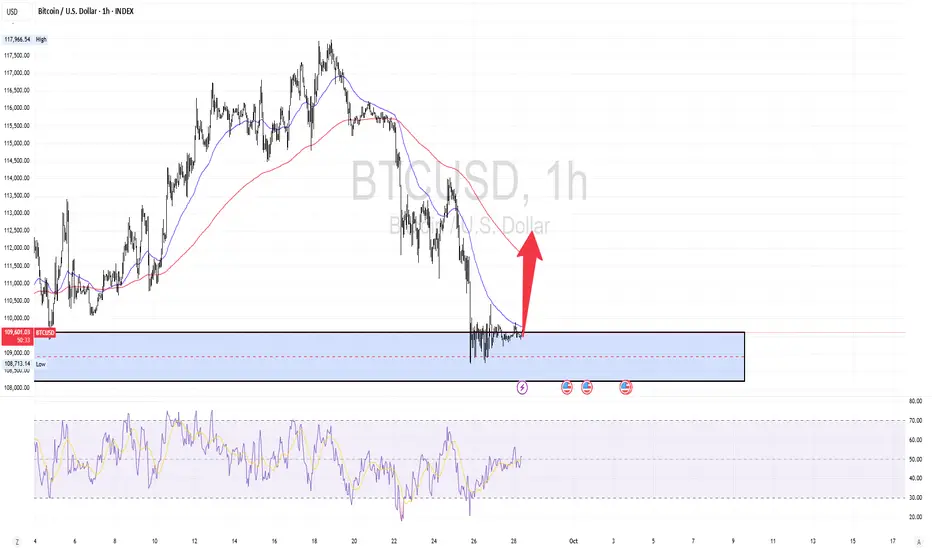
Here is my btcusd technical setup idea.1.The market is currently on the support zone ( H4 SUPPORT ZONE)
2.I am expecting the bounce back from the zone (H4 SUPPORT ZONE)
3.RSI >50 , this indicates momentum to the upside
4.These confirm buy opportunity on H1 time frame
5.Apply proper risk management
CCO | Distribution Pattern | FractalsLooking ahead we can see the next phase of price action falling into a distribution pattern
Since correction wave 4 buyers took off but seem to be running out of steam. Eventually sellers will have to show what they can do after this trend breaks on a lower timeframe.
Ideal move going forward would focus on short positions only with a local swing target of ~$96 since that was the last area of support
Entries would be somewhere at the Head if using textbook patterns (HnS) or SMR
A confirmation entry to be on the safe side would be after the Breakout Bar indicating a change in trend, and then waiting for the Distribution phase to kick in for more shorting opportunities.
To add confluence to this trade idea we can look back at historical price action and find similar fractals that matches with current price movement
At least two fractals are spotted with the same patterns that are building the same price structure we're in
Elliott Impulse Wave, HnS Pattern, and Distribution Phases.
If buyers are not interested in the local support lvl then liquidity at $76 will be next zone.

How To Profit From The Bitcoin Crash In 3 StepsI have to journal this trade
because its a non negotiable thing
to do..also it will help you as well.
Bitcoin has experienced a bad crash...
and if you are fan of this bitcoin
then you have also felt the pain.
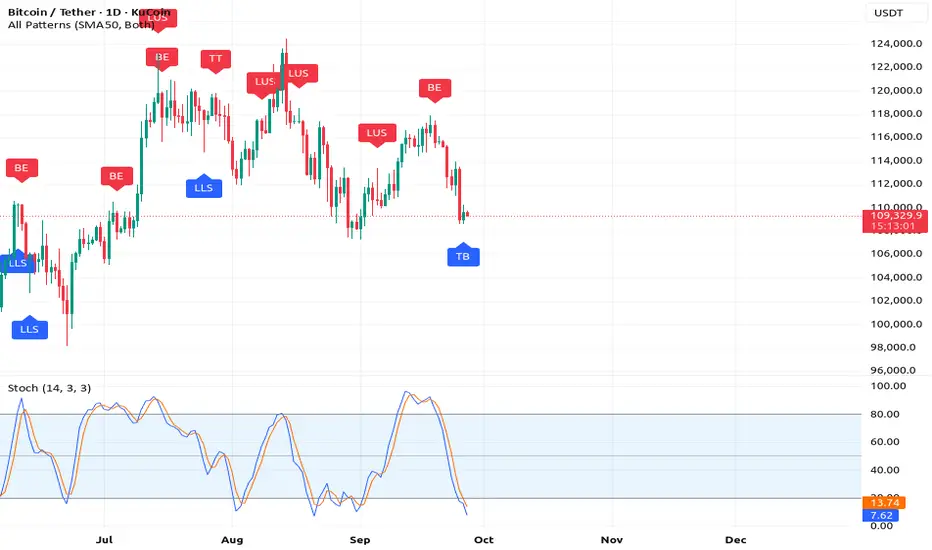
The monthly moving average
is a strong buy..
Because
1- The price is above the 50 ema
2- The price is above the 200 ema
3-The price has gapped up - Via the tweezer bottom
You can see this is called the Rocket Booster Strategy
you can also see the
bullish candlestick pattern
on the screen.
It also appears like its coming
from a bullish harami
This crash compared to gold has
made gold the better asset of 2025,
But i feel bitcoin will beat gold next year
so congratulations
to the gold bugs.
But am warning you Bitcoin KUCOIN:BTCUSDT
is coming.
This is your chance to profit from the
bitcoin market crash.
Rocket boost this content to learn more.
Disclaimer: trading is risky please
learn risk management and profit taking strategies.
Also use a simulation trading account
before you trade with real money.
How To Use the #1 Entry SignalAm trying to understand
how to best love my family.
Its not been easy as i learn how to trade.
This skill is kind of invisible.
So its very difficult if you come
from a poor back ground to
explain the financial markets.
The truth is the financial markets
have been around
since the beginning of civilisation
And back in the day they used
different technology to calculate
the financial markets.
In today's world you are at an advantage
because you understand computers.
Now look at this chart look at the 90 degree
angles.
Look at the stochastic
Robert kiyosaki says its like
landing a crashing helicopter.
You first have to turn off the engine
Let the helicopter nose dive.
Then you pull the front of
the crashing helicopter.
Meanwhile as you nose dive you
are throwing away every thing that makes
the helicopter heavy,
As you are about to reach the surface...
pull up let the helicopter slide on
its bottom
Its called "Crash Landing"
This story i got from Robert Kiyosaki
Is the best way i could explain to
you trading psychology
of buying in a reversal trading system.
Look again at the stochastic
the blue line has crossed above the
orange line this is your entry signal
this is the time to enter this trade.
Rocket boost this content for you to learn more.
Disclaimer: Trading is risky please learn
risk management
and profit taking strategies.
Also feel free to use a
simulation trading account.
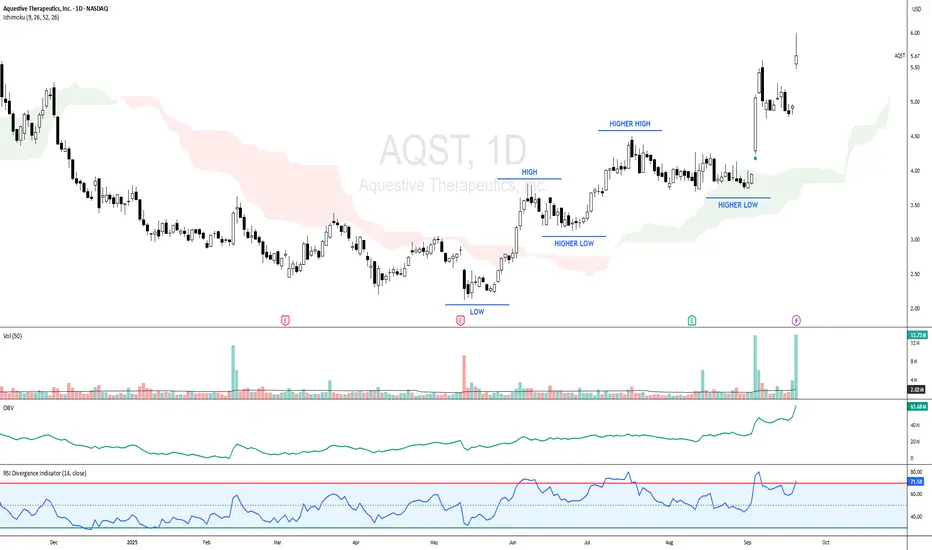
AQST - RISING PRICES is supported by INCREASING VOLUMEAQST - CURRENT PRICE : 5.67
Key Observations :
Uptrend Structure – The chart shows a clear uptrend where both highs and lows are moving higher, confirming bullish price action.
Volume Confirmation – Rising prices are supported by increasing trading volume, which validates the strength behind the uptrend.
OBV Indicator – On-Balance Volume line is trending upward, confirming strong accumulation and participation from buyers.
RSI Momentum – RSI is above 70, reflecting strong bullish momentum with no immediate signs of weakness.
Overall, the combination of higher highs & higher lows, volume confirmation, and bullish indicators (OBV & RSI) suggest that AQST (Aquestive Therapeutics, Inc.) is well-positioned for further upside in the short to medium term.
ENTRY PRICE : 5.47 - 5.67
FIRST TARGET : 6.40
SECOND TARGET : 7.90
SUPPORT : 4.97
The #1 Bearish Chart PatternThere is something so powerful;
about technical analysis
that's very hard to put together
but once you do piece them together
you will begin to see the power of it
Tracking the price for
these alt coins
has been the best hing
i have ever witnessed.
Seeing the pennant bearish
price pattern
Has been something
i didn't think i would
see
This stuff is starting to get
more and more clear the more
i study about it.
Studying about the reversal pattern
is like reverse psychology
It gives you
the advantage in the market
Because?
Because everyone wants
a bullish signal when
the market is bullish
every one wants a bearish signal
when the market is bearish.
No one wants a correction.
No one wants the reversal.
Think about it how many
times have you seen a sucker
and you know deep down in your heart
that sucker
wont make it
Now imagine a sucker
that makes it in life.
That what this reversal pattern
is all about my man
this is what separates you
from the crowd
because you have hope that one
day that loser guy
you see will make it
think of the buy signal as
the potential you see in that loser
guy friend of yours
You have seen the potential but
no one around
you has..you have seen
it using the buy signal
now you see a big potential
he finally tells you he has made it
because you saw the potential in him
a long time ago and now
he is thanking you for seeing
this potential in him
and vows to help you
with hand outs if you will
ever need one.
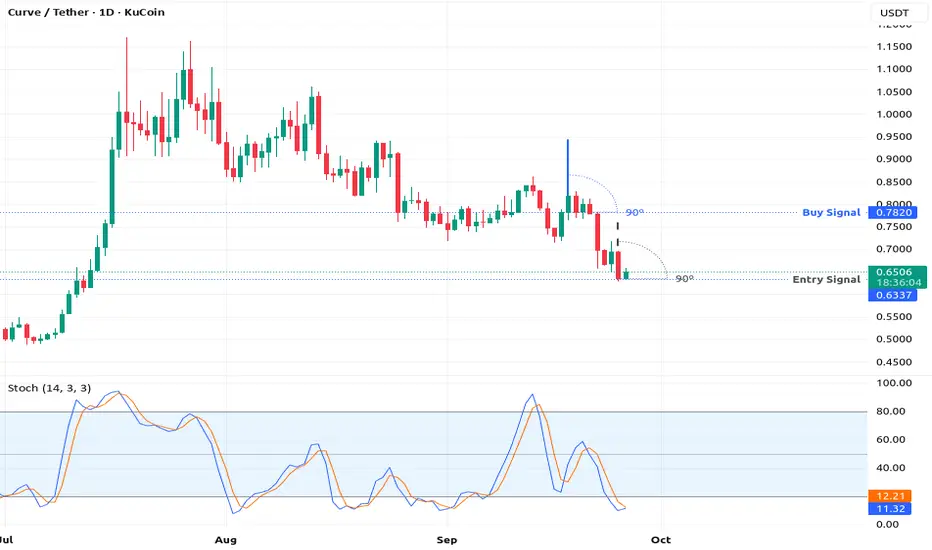
That's what this correction is all about
Notice the angles
there all 90 degrees
this chart pattern is
called the pennant bearish pattern
i got it form Steve Nison's book
on Japanese candlestick patterns.
Thats where i first saw
this pattern.
Patterns are important .
If you want to learn more check
out the resources below.
Rocket boost this content to learn more.
Disclaimer:Trading is risky please learn risk
management and profit
taking strategies.Also
feel free to use a simulation trading account
before you trade with real money.
The #1 Entry SignalHello sorry for being quiet.
Am gong to tell you the reason.
These past days have
been crazy as am learning
about business taxes.
Also i remember this one lady
that for some reason used to tell me
everything that's wrong with me.
But never at one point
complimented my efforts.
Am talking to you my
sister.
Sometimes all you need to do is
give a man a compliment
for him to know that you
are really interested in him.
Going for a man that has money
is not always
the answer my dear sister.
Listen i have a good sister
thats married.
She always compliments
my business dreams
she always congratulates me when
i do something that am proud
of myself in doing
This sister of mine is so confident
in herself that her husband
is confident in her.
This means he trusts her so much
And he knows i love her as a sister.
To the point that i tell her to
always submit to him.
Do you see what am saying?
Imagine the weight that carries.
To where me as her brother
is encouraging my sister
to submit to her husband...
Thats the support that you will
need if you want a good man, my
sister the answer is simple
be good as well and
read books on relationship
and marriage that support
you especially
if that's what you desire.
What if your marriage doesn't
work out ?
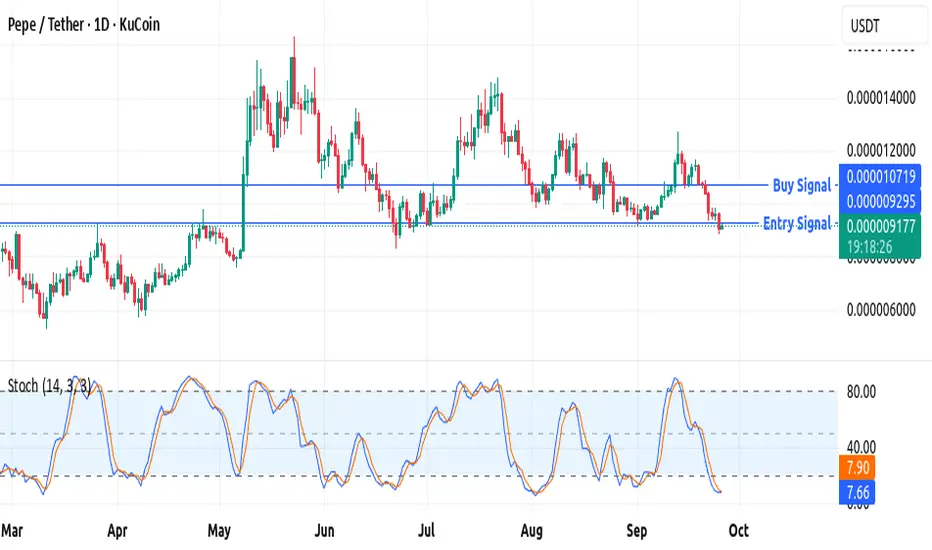
This chart has a buy signal
but its like a failed marriage.
So it crashed.
We are looking for a "CORRECTION"
That correction is your entry signal.
In order to see the correction we use the
stochastic indicator
What happens is the lines
crossover below the
the 20 level line.
Look at the chart to see
clearly
what am talking to you about.
This correction is the relationship
getting fixed,
This correction is me as your brother
dear sister telling you
to submit to your husband
Study the stochastic indicator
Also please rocket boost
this content to learn more.
Disclaimer:Trading is risky please use
a simulation trading account
and learn risk management and
profit taking strategies.
Dow rolls over, shifting directional risksDirectional risks in the Dow Jones contract appear more balanced following the break of uptrend support earlier this week, a view supported by momentum indicators such as RSI (14) and MACD, which have also rolled over, delivering a neutral signal. More weight should be placed on price action in the near term rather than maintaining a specific bias.
If the price can hold above support at 45,762, longs could be established above the level with a stop beneath for protection, targeting the record high of 46,723 set earlier this month. Should the uptrend break lead to an extension of the bearish move beneath 45,762, the setup could be flipped, with shorts placed below the level and a stop above for protection. The 50DMA, 45,000 or 44,500 screen as potential targets.
Good luck!
DS

$BTC Bulls Must Step Up Or Next Target 200MA₿itcoin testing the perimeter of the DANGER ZONE ⚠️
Thankfully closed inside of it.
Notice how well PA respects this zone.
Bulls really need to step up here, otherwise the long awaited retest of the 200MA awaits CRYPTOCAP:BTC at $104k.
It has to retest there eventually nonetheless.
Note the RSI is nearly at the level we bottomed on Liberation Day.

LALPATHLAB BullishLALPATHLAB 🟢
Shows continuous profitable growth
EPS growth per year is seen by almost 10 to 15%
Sales growth is also consistent

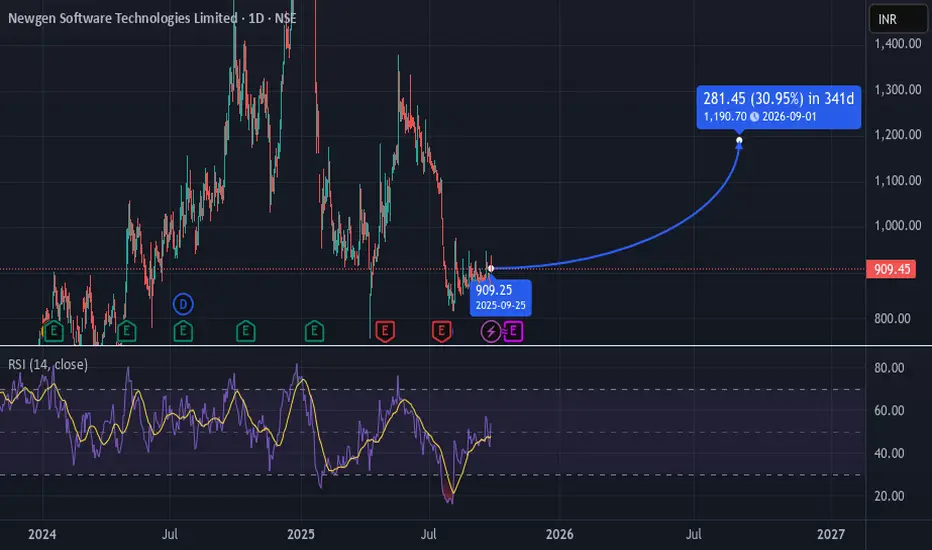
NEWGEN Bullish LongNEWGEN 🟢
EPS for last 3 consecutive years has shown positive growth
Revenue growth is excellent every year
Growth looks promising for next 1 year
Company is almost debt free
ETH Oversold Again – Is a Bounce Coming?Ethereum (ETHUSDT) on the 4H chart is showing signs of oversold conditions as the RSI once again dips below the 30 level. This setup has historically aligned with local bottoms, where ETH tends to bounce back shortly after reaching such extreme levels of selling pressure. The current price action around $4,170 highlights a critical zone to monitor for potential reversal.
If ETH can hold this level and buying momentum steps in, a relief rally could follow in the short term. However, if weakness persists, further downside retests cannot be ruled out. Traders should closely watch RSI recovery and volume confirmation for signals of a stronger rebound.

uniQure N.V - Positive divergenceOn the above 2-week chart uniQure N.V. price action has corrected 90% without the aid of share splits. A number of reasons now exist to consider a long position. They include:
1) Price action returns to legacy support.
2) RSI resistance breakout.
3) Strong positive divergence as measured over a 2-month period. Look left.
4) No share splits.
5) Price action previously topped out at the Fibonacci 1.414. Were that performance to repeat price action would top out at $215 with a 3600% return.
Is it possible price action continues to correct? Sure.
Is it probable? No.
Ww
Type: Investment
Risk: <6%
Timeframe for long: Qrt 1 2024
Stop loss: Will say elsewhere

EUR/USD: Coiling for a breakout as triangle tightenSitting in an ascending triangle with RSI (14) and MACD generating bullish signals on price momentum, traders should be on alert for a potential topside break in EUR/USD.
If we see a definitive push above 1.1820, longs could be established with a tight stop beneath for protection, targeting 1.1848 initially and 1.1860 after that.
While the price and momentum picture favours longs, you can’t ignore that the pair struggled around these levels during the North American session, putting a possible countertrend short trade on the menu should no definitive bullish break emerge when Asian trade is in full swing later today.
Shorts could be placed beneath 1.1820 with a stop above the level for protection, targeting uptrend support found around 1.1795 currently.
Good luck!
DS

DXY | Boxed In Between 96.60 & 97.20 – Powell Holds the KeyThe dollar softened in line with expectations, shrugging off hawkish Fed remarks. With DXY caught between 96.60 support and 97.20 resistance, Powell’s speech tonight could set the tone—further downside if dovish, or consolidation if steady.

CELH - From BEARS to BULLSCELH - CURRENT PRICE : 57.82
After completing a bearish reversal formation in the shape of a Double Top , the stock broke down from the neckline and entered a prolonged downtrend phase. This weakness was confirmed by the Relative Strength Index (RSI) , which stayed consistently below the 50 level, indicating persistent bearish momentum.
Subsequently, the stock established a saucer (bottom reversal) pattern , signaling a gradual shift in sentiment from selling pressure to accumulation (indicating a slow accumulation phase rather than a sharp reversal). Although there was no distinct breakout point, the gradual price recovery signaled a shift in market sentiment. This transition is supported by the RSI moving above and holding above the 50 level, suggesting strengthening bullish momentum.
Additionally, the stock has recently bounced off an internal trendline , reinforcing a "buy-on-dips" opportunity within the current uptrend. With this setup, there's an estimated upside potential of around 9% toward retesting its 52-week high, making it a favorable technical setup for short- to medium-term traders. For ICHIMOKU CLOUD traders, take note also that the share price is trading above cloud since 17 March 2025.
ENTRY PRICE : 56.00 - 58.00
TARGET : 63.00 and 69.00
SUPPORT : 52.00 (CUTLOSS below 52.00 on closing basis)
Notes : INTERNAL TRENDLINES are variations of the trendline that don't rely on extreme highs or lows. Instead, internal trendlines are drawn through the price action and connect as many internal peaks or troughs as possible. Some chartists develop good eye for this type of trendline and find them useful. The problem with internal trendlines is that their drawing is very subjective, whereas the rules for drawing of more traditional trendlines along the extreme highs and lows are more exact.

$BTC Battle of the Bulls and Bears is ON! Pretty wild day in the crypto market.
CRYPTOCAP:BTC Bears closed below the 100MA, but thankfully right above the .236 Fib and avoided the DANGER ZONE ⚠️
Bulls need a big next couple of days.
Can't hang out here for too long.
RSI is looking healthy after this reset tho.
How you feeling?
Bullish or Bearish?

Gold's Gann Square of 4 analysis. 21/Sept/25 XAUUSD monthly water RSI bills almost "boiling" at 88.96 "degree".. What do you think should it "cooling" down a bit?..

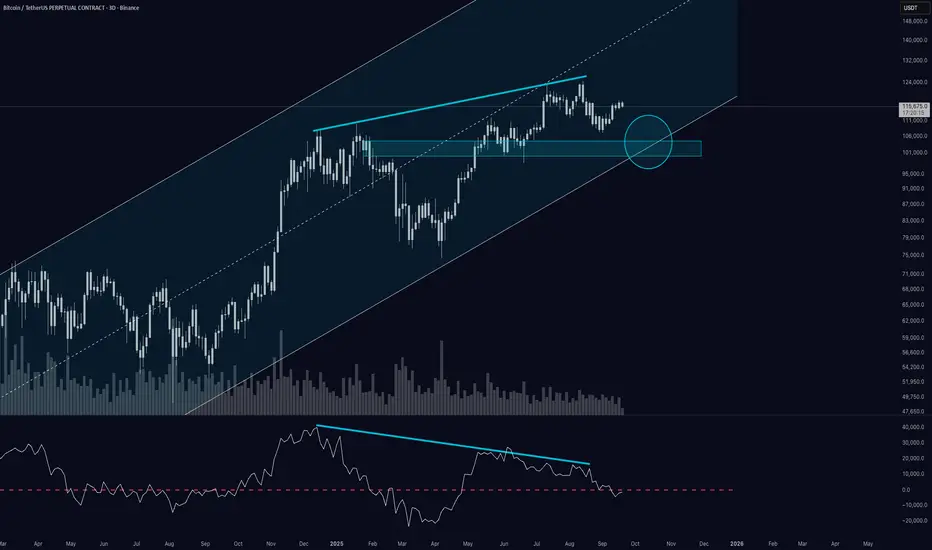
Is Bitcoin Losing Momentum?On the 3-day chart, Bitcoin continues to respect its long-term ascending channel, with both the upper and lower boundaries acting as clean structural guides.
🔹 Momentum: After months of strength, momentum has slipped below the 0-line and is currently retesting it – a key pivot that often defines whether trend continuation or correction follows.
🔹 Structure: The lower boundary of the channel lines up almost perfectly with the horizontal support zone built from previous highs (around 100k–103k). This confluence makes it a natural candidate for a pullback area.
🔹 Volume: A noteworthy observation is the declining volume profile during the most recent leg higher – a potential early warning that participation is fading.
If the 100k–103k support area holds , the long-term uptrend remains intact.
But a decisive breakdown could open the door to a deeper correction.
👉 What do you think – is Bitcoin gearing up for another strong bounce off the channel, or are we on the edge of a deeper retracement?
Let’s discuss in the comments.
Disclaimer: This is a market observation, not financial advice.
The #1 Trading Strategy: The Butter Knife Trading SystemI told you once in while
i will be posting about forex trading.
This strategy is a bit advanced and am sorry
for introducing this to you so early in your trading
journey but its okay
to be open minded the key is i want you
to learn how to trade to the point
You can have multiple strategies.
The truth is you only
need one powerful strategy
to make it in this game.But my calling
is different
Because i want to tech you and build
you, and help you and share with you
So i have to make sure that i kept learning
new strategies to entertain you
with trading knowledge
The truth is A.I. is boring
if all you do is talk to A.I. the whole day
you wont have anything interesting
to share with people.
Am old school buddy.I use old school methods
Now are these new school methods such as
A.I. powerful yes...
But nothing beats the old tricks man.
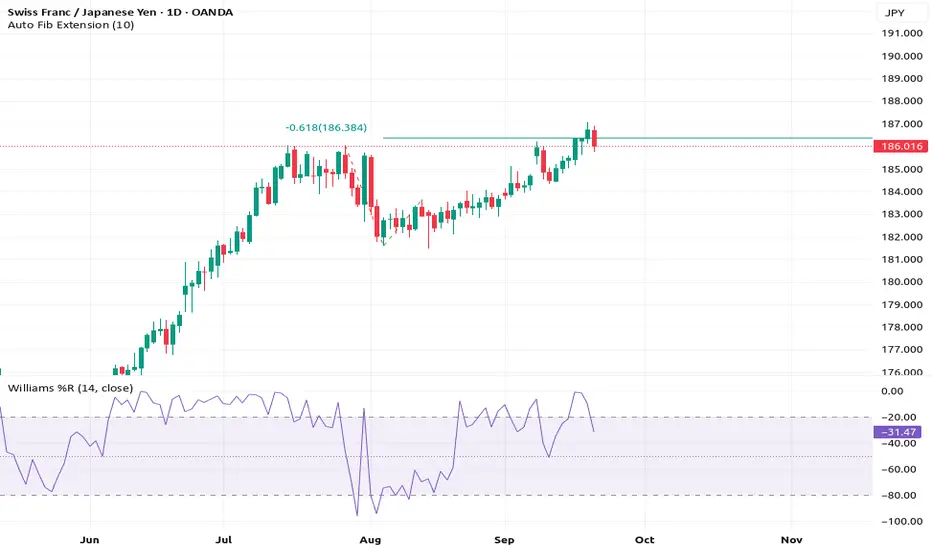
So now look at the Fibonacci.
I call this the Butter Knife Trading system.
Because when that Fibonacci level
cuts through the price.
oh boy..Its going to crash!
If you dont believe this forex will
crash look at the
momentum on the William %r
Its hit the Oversold zone.
This is a short selling strategy
my friend.
If you want to learn more rocket boost this content
Disclaimer:Trading is risky
please learn risk management and profit
taking strategies
also feel free to use a simulation trading account before
you trade with real money.
The #1 Trading Mindset Shown On This ChartMan this is crazy there is this girl
that am digging.It was crazy i just
spoke my mind
bro she kept laughing..i honestly
dont think am very funny.
But she kept laughing
at my talk.
She insisted i see her tomorrow again.
Now am doubting if am ready to be
in a relationship with her.
Anyway we will see how this goes.
I will update on the story. Tomorrow,
after i see her tomorrow.
Meanwhile there is this other girl that
i really love but she doesn't see me man.
Its like i don't have a body
Bro she ignores me like
no mans business
i cant even get her attention.
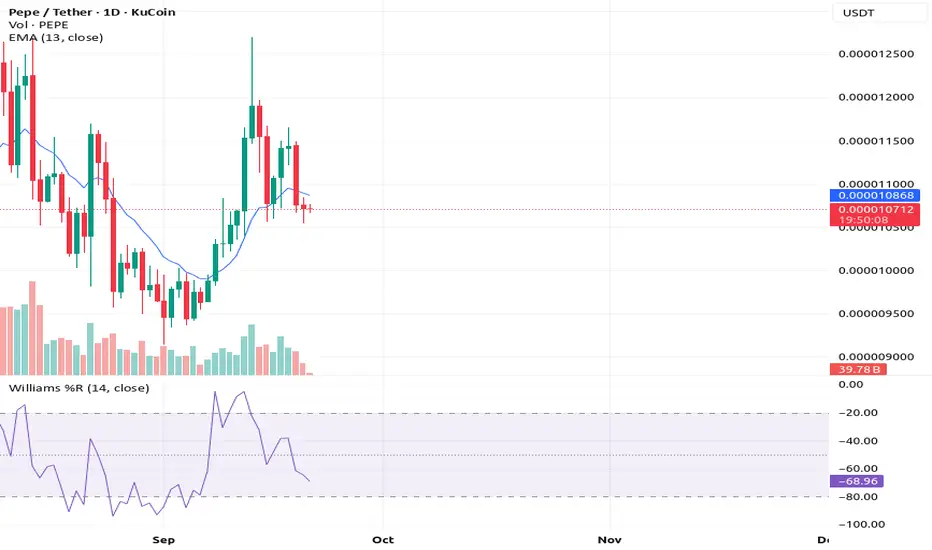
Look at this chart KUCOIN:PEPEUSDT
what you see is a doji .
Thats fear my friend.
This is when you have to enter
During fear.
The price action looks like a double
bottom meanwhile
on the momentum chart below
you can see a new low..
Have you seen the new low
on the william %R ?
This is very important for you
to understand because
this is called the new high new low
chart pattern .
Its pure trading psychology at
its best and am sharing it with you.
Rocket boost this content to learn more.
Disclaimer: Trading is risky please risk management
and profit taking strategies.Also feel free
to use a simulation trading account before you
trade with real money.
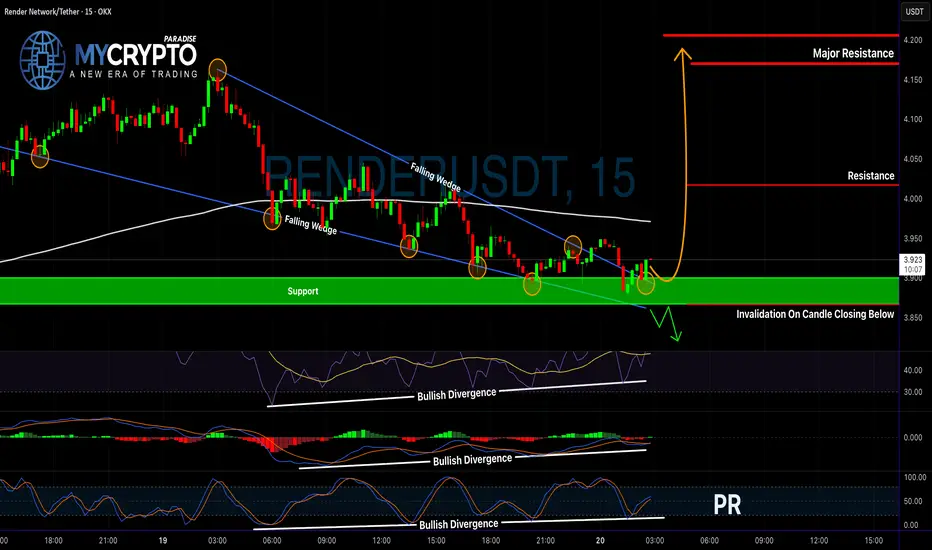
Is RENDER About to Explode?Yello Paradisers, are you watching closely? RENDERUSDT just completed a textbook breakout—and it might be your best shot at catching a high-probability move before the crowd even notices.
💎RENDERUSDT has officially broken out of a falling wedge—a powerful bullish pattern—confirmed by bullish divergence on the RSI, MACD, and Stochastic RSI. When all three indicators align like this, the probability of a strong upside move significantly increases.
💎Even better, price action has already retested the wedge breakout, and from the current levels, the market is offering a favorable risk-to-reward (RR) setup.
💎Now, if you’re looking for additional confirmation, a more cautious play would be to wait for a pullback into the nearest support zone, and then enter on a bullish candlestick formation. This approach could not only boost your confidence but also improve your overall RR.
💎However, stay sharp—if price breaks and closes below the support and our invalidation level, the entire setup gets invalidated. In that case, patience is key. Wait for stronger price action before considering re-entry.
🎖Strive for consistency, not quick profits. Treat the market as a businessman, not as a gambler. Be patient, stay focused, and let the market come to you, Paradisers. That’s how the winners play this game long-term.
MyCryptoParadise
iFeel the success🌴