$USDT.D Analysis - Oct 8 | 4H Time FrameCRYPTOCAP:USDT.D Analysis - 4H
Hello and welcome to another analysis from the Satoshi Frame team!
I’m Abolfazl, and today we’re going to analyze Bitcoin on the 4-hour timeframe.
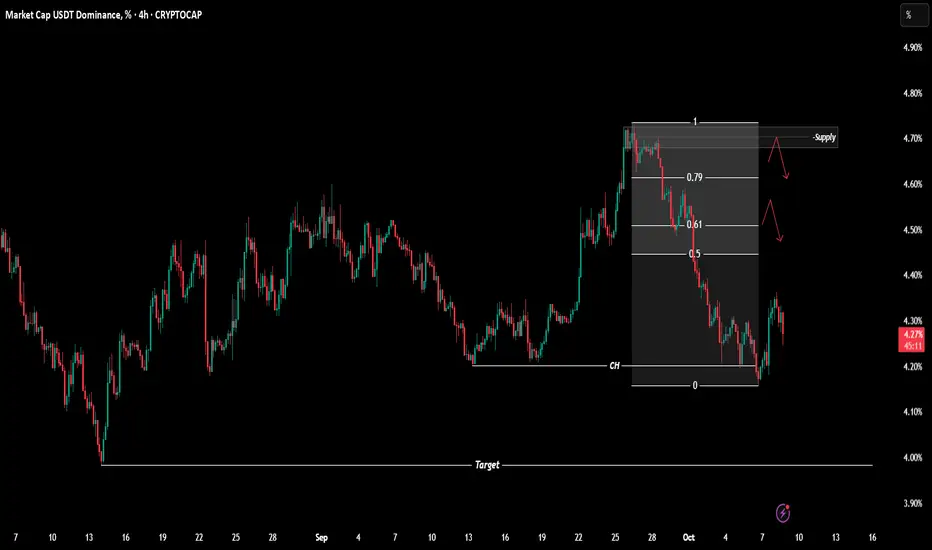
USDT dominance has shown a trend reversal on the 4-hour timeframe and has turned bearish.
The OTE zone and the marked supply area could act as potential rejection zones if dominance makes a short-term pullback upward.
On the other hand, we could also see another drop from the current level, moving toward the lower support area near the recent low.
The main target (4%) is already marked on the chart.
See you in the next analyses!
Stay tuned with the Satoshi Frame team...
M-signal
$BTCUSDT Analysis - Oct 8 | 4H Time FrameBINANCE:BTCUSDT Analysis - 4H
Hello and welcome to another analysis from the Satoshi Frame team!
I’m Abolfazl, and today we’re going to analyze Bitcoin on the 4-hour timeframe.
Bitcoin has been rejected from the $120,000 level, and we currently expect it to move toward the all-time high.
You can look for entry confirmations on the 15-minute timeframe.
See you in the next analyses!
Stay tuned with the Satoshi Frame team...

AUDNZD: Bearish Forecast & Bearish Scenario
The recent price action on the AUDNZD pair was keeping me on the fence, however, my bias is slowly but surely changing into the bearish one and I think we will see the price go down.
Disclosure: I am part of Trade Nation's Influencer program and receive a monthly fee for using their TradingView charts in my analysis.
❤️ Please, support our work with like & comment! ❤️

NZDCHF: Short Signal with Entry/SL/TP
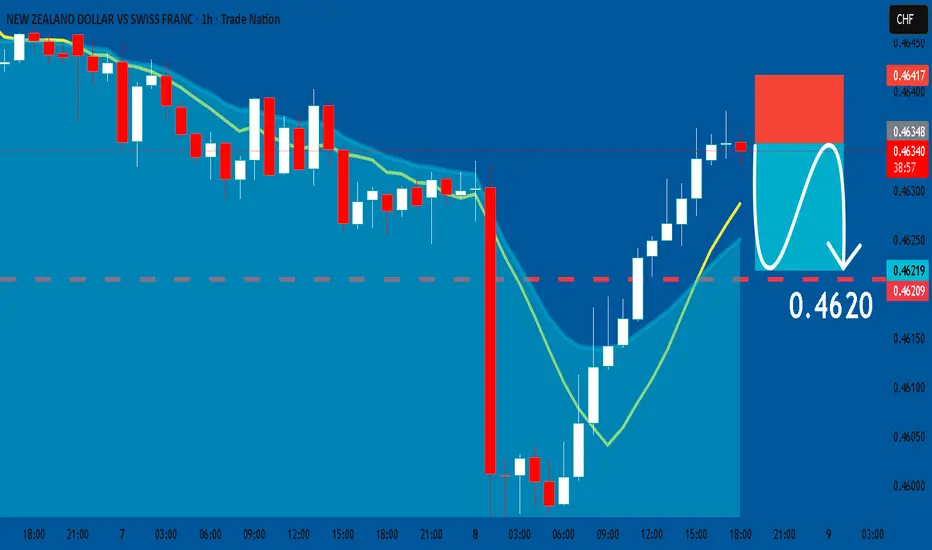
NZDCHF
- Classic bearish formation
- Our team expects fall
SUGGESTED TRADE:
Swing Trade
Sell NZDCHF
Entry Level - 0.4634
Sl - 0.4641
Tp - 0.4620
Our Risk - 1%
Start protection of your profits from lower levels
Disclosure: I am part of Trade Nation's Influencer program and receive a monthly fee for using their TradingView charts in my analysis.
❤️ Please, support our work with like & comment! ❤️
GBPAUD What Next? BUY!
My dear subscribers,
My technical analysis for GBPAUDis below:
The price is coiling around a solid key level - 2.0332
Bias - Bullish
Technical Indicators: Pivot Points High anticipates a potential price reversal.
Super trend shows a clear buy, giving a perfect indicators' convergence.
Goal - 2.0375
About Used Indicators:
By the very nature of the supertrend indicator, it offers firm support and resistance levels for traders to enter and exit trades. Additionally, it also provides signals for setting stop losses
Disclosure: I am part of Trade Nation's Influencer program and receive a monthly fee for using their TradingView charts in my analysis.
———————————
WISH YOU ALL LUCK

AUDCHF A Fall Expected! SELL!
My dear followers,
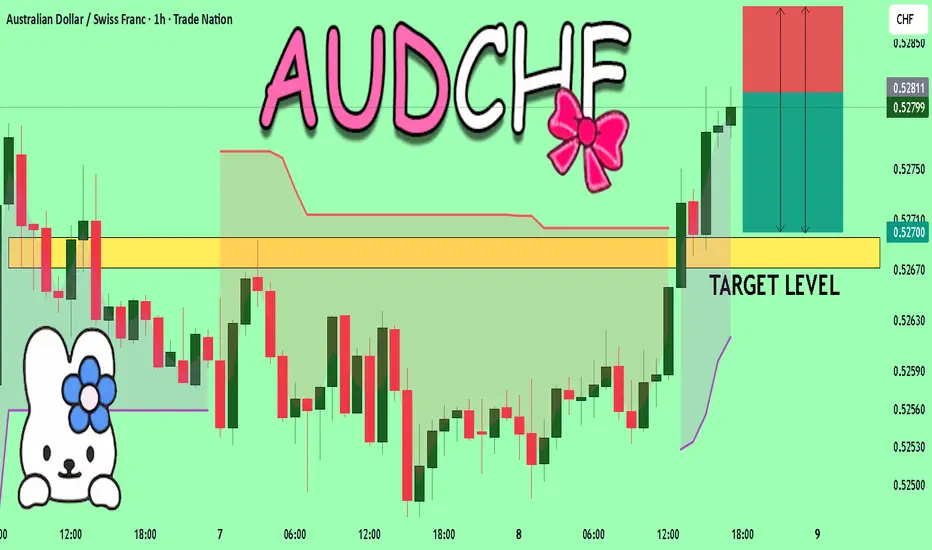
This is my opinion on the AUDCHF next move:
The asset is approaching an important pivot point 0.5280
Bias - Bearish
Safe Stop Loss - 0.5287
Technical Indicators: Supper Trend generates a clear short signal while Pivot Point HL is currently determining the overall Bearish trend of the market.
Goal - 0.5269
About Used Indicators:
For more efficient signals, super-trend is used in combination with other indicators like Pivot Points.
Disclosure: I am part of Trade Nation's Influencer program and receive a monthly fee for using their TradingView charts in my analysis.
———————————
WISH YOU ALL LUCK
GBPCHF: Bears Will Push Lower
It is essential that we apply multitimeframe technical analysis and there is no better example of why that is the case than the current GBPCHF chart which, if analyzed properly, clearly points in the downward direction.
Disclosure: I am part of Trade Nation's Influencer program and receive a monthly fee for using their TradingView charts in my analysis.
❤️ Please, support our work with like & comment! ❤️

GOLD: Short Trade with Entry/SL/TP
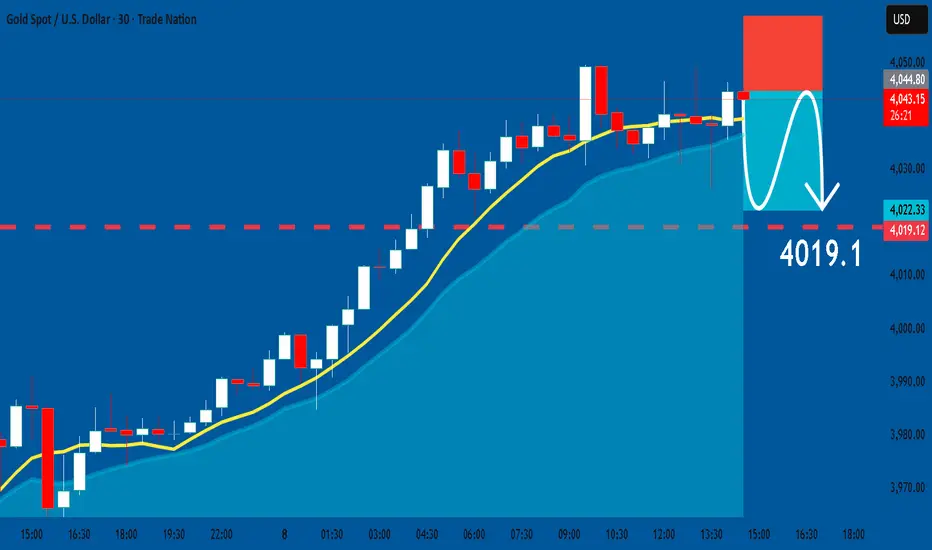
GOLD
- Classic bearish formation
- Our team expects pullback
SUGGESTED TRADE:
Swing Trade
Short GOLD
Entry - 4045.1
Sl - 4058.9
Tp - 4019.1
Our Risk - 1%
Start protection of your profits from lower levels
Disclosure: I am part of Trade Nation's Influencer program and receive a monthly fee for using their TradingView charts in my analysis.
❤️ Please, support our work with like & comment! ❤️
EURUSD My Opinion! BUY!
My dear followers,
I analysed this chart on EURUSD and concluded the following:
The market is trading on 1.1633 pivot level.
Bias - Bullish
Technical Indicators: Both Super Trend & Pivot HL indicate a highly probable Bullish continuation.
Target - 1.1677
About Used Indicators:
A super-trend indicator is plotted on either above or below the closing price to signal a buy or sell. The indicator changes color, based on whether or not you should be buying. If the super-trend indicator moves below the closing price, the indicator turns green, and it signals an entry point or points to buy.
Disclosure: I am part of Trade Nation's Influencer program and receive a monthly fee for using their TradingView charts in my analysis.
———————————
WISH YOU ALL LUCK

NZDJPY Trading Opportunity! SELL!
My dear friends,
Please, find my technical outlook for NZDJPY below:
The instrument tests an important psychological level 88.173
Bias - Bearish
Technical Indicators: Supper Trend gives a precise Bearish signal, while Pivot Point HL predicts price changes and potential reversals in the market.
Target - 87.931
Recommended Stop Loss - 88.340
About Used Indicators:
Super-trend indicator is more useful in trending markets where there are clear uptrends and downtrends in price.
Disclosure: I am part of Trade Nation's Influencer program and receive a monthly fee for using their TradingView charts in my analysis.
———————————
WISH YOU ALL LUCK

USD/CHF: Bears Defending the TrendlineUSD/CHF continues to respect the descending channel structure that has been in place since mid-August.
After a short-term recovery, the price is now retesting the upper trendline resistance and the 0.8000–0.8020 supply zone, where sellers have previously stepped in.
Technical Outlook
Structure: Descending channel – clear series of lower highs.
Resistance zone: 0.8000–0.8020 (channel top + previous rejection zone).
Support zone: 0.7870–0.7840 (recent demand area).
Moving averages: Both 50 and 100 MAs are flattening but still below the resistance, suggesting limited bullish momentum.
Bias: Bearish below 0.8020 — expecting rejection and continuation to the downside.
Fundamental Context
Recent U.S. data has shown mixed inflation numbers, while Swiss CPI remains stable, reducing expectations for any SNB intervention.
The stronger Swiss franc remains supported by safe-haven flows amid global uncertainty.
Unless the U.S. delivers a clear upside surprise in macro data, the pair is likely to remain under pressure in Q4.
Trade Setup (Not Financial Advice)
Entry zone: 0.79700–0.79800
Stop-loss: 0.8020
Targets:
TP1 → 0.7900
TP2 → 0.7845
🧭 A break below 0.7930 would confirm bearish continuation within the channel.

GBPCAD: Long Trade with Entry/SL/TP
GBPCAD
- Classic bullish pattern
- Our team expects retracement
SUGGESTED TRADE:
Swing Trade
Buy GBPCAD
Entry - 1.8727
Stop - 1.8708
Take - 1.8764
Our Risk - 1%
Start protection of your profits from lower levels
Disclosure: I am part of Trade Nation's Influencer program and receive a monthly fee for using their TradingView charts in my analysis.
❤️ Please, support our work with like & comment! ❤️

NZDUSD Set To Grow! BUY!
My dear friends,
NZDUSD looks like it will make a good move, and here are the details:
The market is trading on 0.5813 pivot level.
Bias - Bullish
Technical Indicators: Supper Trend generates a clear long signal while Pivot Point HL is currently determining the overall Bullish trend of the market.
Goal - 0.5830
About Used Indicators:
Pivot points are a great way to identify areas of support and resistance, but they work best when combined with other kinds of technical analysis
Disclosure: I am part of Trade Nation's Influencer program and receive a monthly fee for using their TradingView charts in my analysis.
———————————
WISH YOU ALL LUCK

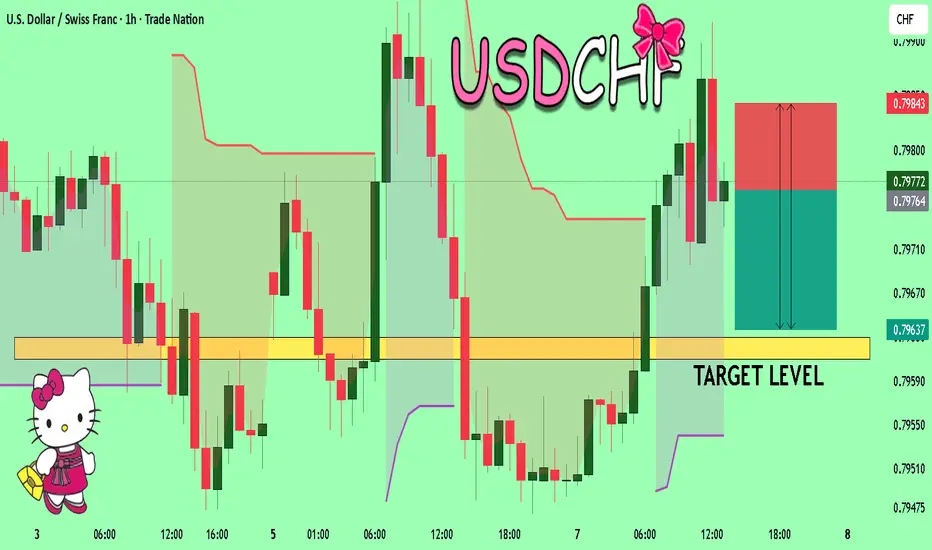
USDCHF What Next? SELL!
My dear subscribers,
My technical analysis for USDCHF is below:
The price is coiling around a solid key level - 0.7976
Bias - Bearish
Technical Indicators: Pivot Points Low) anticipates a potential price reversal.
Super trend shows a clear sell, giving a perfect indicators' convergence.
Goal - 0.7963
My Stop Loss - 0.7984
About Used Indicators:
By the very nature of the supertrend indicator, it offers firm support and resistance levels for traders to enter and exit trades. Additionally, it also provides signals for setting stop losses
Disclosure: I am part of Trade Nation's Influencer program and receive a monthly fee for using their TradingView charts in my analysis.
———————————
WISH YOU ALL LUCK
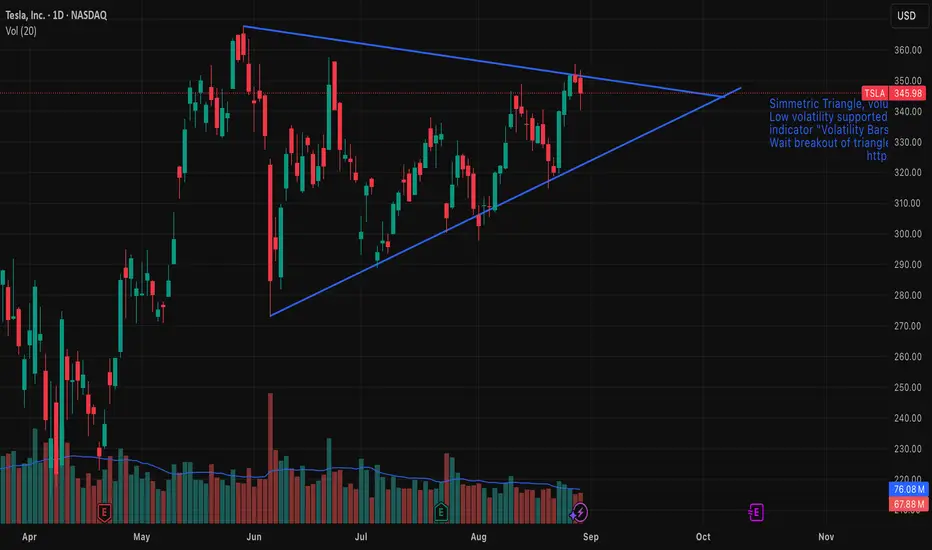
Tesla (TSLA) — Symmetrical Triangle Breakout IdeaSummary
Pattern: Symmetrical triangle on daily chart.
Expected timeframe for breakout: Within 1–2 weeks.
Targets: $367 on an upside breakout; $273 on a downside breakout.
Risk management: Use a stop-loss just outside the triangle after breakout confirmation; position size per your risk rules.
Setup & Rationale
A well-defined symmetrical triangle has formed on TSLA’s price action, characterized by converging trendlines connecting lower highs and higher lows. Volume has contracted inside the pattern, consistent with consolidation. Symmetrical triangles are neutral continuation/reversal patterns; the breakout direction provides the trading signal.
Key technical points:
Price is approaching the apex, increasing the likelihood of a decisive breakout in the next 1–2 weeks.
Volume decline during the consolidation and a volume spike on breakout would confirm conviction.
The breakout should be taken after a daily close beyond the upper or lower trendline (or after a retest), not merely intraday probes.
Entry Criteria
Upside trade: Enter long on a daily close above the upper trendline (or on a confirmed retest).
Downside trade: Enter short on a daily close below the lower trendline (or on a confirmed retest).
Targets & Measurement
Measure the pattern height (vertical distance between the initial high and low of the triangle) and project it from the breakout point.
Upside target (projected): $367.
Downside target (projected): $273.
Adjust targets proportionally if you use a measured move from the actual breakout point rather than the pattern’s maximum height.
Stops & Risk Management
Place stop-loss slightly outside the opposite trendline or beyond a recent swing point to avoid false breakouts.
Preferred approach: fixed-risk percent per trade (e.g., 1–2% of portfolio) and scale position size accordingly.
Consider tightening stops to breakeven after price clears ~50% of the distance to the target.
Confirmation: daily close beyond trendline plus above-average volume (up or down depending on direction).
Symmetrical triangles are neutral; false breakouts occur. Wait for confirmation.
News, earnings, or market-wide events can invalidate technical setups quickly—monitor catalysts.
Adjust targets/stops if volatility expands or if the breakout lacks volume confirmation.
GBPCAD Technical Analysis! BUY!
My dear subscribers,
This is my opinion on the GBPCAD next move:
The instrument tests an important psychological level 1.8738
Bias - Bullish
Technical Indicators: Supper Trend gives a precise Bullish signal, while Pivot Point HL predicts price changes and potential reversals in the market.
Target - 1.8766
My Stop Loss - 1.8722
About Used Indicators:
On the subsequent day, trading above the pivot point is thought to indicate ongoing bullish sentiment, while trading below the pivot point indicates bearish sentiment.
Disclosure: I am part of Trade Nation's Influencer program and receive a monthly fee for using their TradingView charts in my analysis.
———————————
WISH YOU ALL LUCK

EURUSD Massive Long! BUY!
My dear friends,
My technical analysis for EUR/USD is below:
The market is trading on 1.1659 pivot level.
Bias - Bullish
Technical Indicators: Both Super Trend & Pivot HL indicate a highly probable Bullish continuation.
Target - 1.1691
About Used Indicators:
A pivot point is a technical analysis indicator, or calculations, used to determine the overall trend of the market over different time frames.
Disclosure: I am part of Trade Nation's Influencer program and receive a monthly fee for using their TradingView charts in my analysis.
———————————
WISH YOU ALL LUCK

AUDCHF My Opinion! SELL!
My dear friends,
AUDCHF looks like it will make a good move, and here are the details:
The market is trading on 0.5268 pivot level.
Bias - Bearish
Technical Indicators: Supper Trend generates a clear short signal while Pivot Point HL is currently determining the overall Bearish trend of the market.
Goal - 0.5260
Recommended Stop Loss - 0.5273
About Used Indicators:
Pivot points are a great way to identify areas of support and resistance, but they work best when combined with other kinds of technical analysis
Disclosure: I am part of Trade Nation's Influencer program and receive a monthly fee for using their TradingView charts in my analysis.
———————————
WISH YOU ALL LUCK

EURUSD: Bullish Continuation & Long Trade
EURUSD
- Classic bullish setup
- Our team expects bullish continuation
SUGGESTED TRADE:
Swing Trade
Long EURUSD
Entry Point - 1.1665
Stop Loss - 1.1653
Take Profit - 1.1695
Our Risk - 1%
Start protection of your profits from lower levels
Disclosure: I am part of Trade Nation's Influencer program and receive a monthly fee for using their TradingView charts in my analysis.
❤️ Please, support our work with like & comment! ❤️

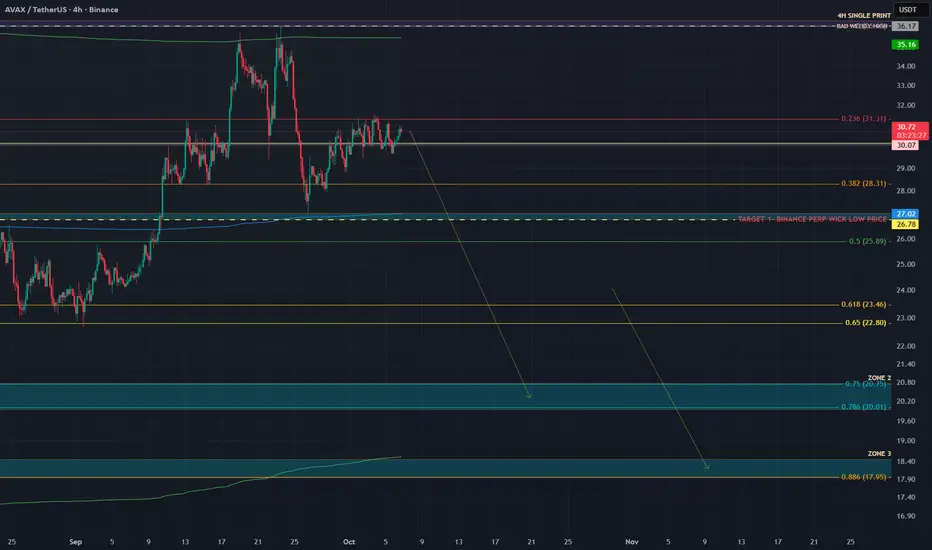
AVAX | ANOTHER DUMP IS LOADING | CHOO CHOOOOCRYPTOCAP:AVAX looks ready for another potential dump. In my CRYPTOCAP:AVAX analysis of August 26 we nailed the entry and exit pixel perfect.
The CRYPTOCAP:AVAX analysis of September 11 was also on point.
I believe that we're not setting up for another hard leg down. Lets look at the data to validate our thesis.
We’re currently in a textbook compression before expansion phase. Price has been moving sideways for days.
CVD Spot is trending down while price holds flat.
CVD Stablecoin-Margined Contracts is also trending down.
CVD Coin-Margined Contracts is trending down even more aggressively.
This tells us that while price is stable, market participants are hitting the bid — selling through the order book. The only reason price hasn’t dropped yet is because passive buyers (limit bids) are absorbing that selling pressure. Once that liquidity weakens or gets pulled, price can easily air pocket lower.
Now, here’s where it gets interesting.
Open Interest (Stablecoin-Margined) is flat.
Open Interest (Coin-Margined) is rising steadily.
At the same time, Coin-Margined CVD continues to drop, and price remains flat inside the range.
Conceptually, this combination is very bearish. Rising OI means new positions are being opened. Falling CVD means those positions are being opened via market sells — in other words, traders are adding shorts. The steady rise in coin-margined OI tells us these are leveraged positions taken directly against the asset, not just speculative stablecoin longs.
This pattern shows that new short exposure is building quietly under the surface, while spot and stablecoin flows fail to show any real buying. It’s the kind of distribution that looks like “accumulation” on the chart — but it’s actually leveraged sellers being absorbed by patient buyers. When those buyers step away, the imbalance resolves sharply to the downside.
In plain English:
Price is holding up because someone keeps catching the falling knife. But the knife is still falling.
Unless Spot CVD turns positive and stablecoin OI starts rising with it (showing real demand returning), this setup points to one thing — another leg down is coming for AVAX.
I'm targeting ZONE 2 and ZONE 3. Check the Order Flow Data here: ibb.co
Trade safe, Nomads!
Bullish Thesis: Why AMD Stock Could Soar by Year-End 2025If you haven`t bought AMD before the previous rally:
What to consider now:
1. AI Tailwinds Are Accelerating
AMD is finally gaining serious traction in the AI GPU race. Its MI300X accelerator chips are being adopted by big names like Microsoft, Meta, and Oracle for data center AI workloads. While NVIDIA is still dominant, AMD is expected to grab 10–20% of the AI GPU market share by 2025, according to industry estimates. That’s a multibillion-dollar opportunity.
The MI300X already passed $1B in revenue within its first quarters.
AI server TAM (total addressable market) is expected to grow to $400B by 2027 — AMD is positioning itself aggressively to carve out its slice.
2. Valuation Looks Reasonable vs Peers
AMD trades at a forward P/E around 40, significantly below Nvidia (which trades over 60x) despite similar growth projections for the next 2 years.
Revenue expected to grow over 15–20% YoY in 2025.
Gross margins expanding as high-performance chips dominate the mix.
3. Diversified Growth: Beyond AI
Gaming segment (PlayStation 5 and Xbox Series X chips) remains strong.
Embedded segment from Xilinx acquisition continues to generate solid cash flow.
Client CPU business is rebounding as the PC market stabilizes.
4. Strong Management and Execution
CEO Lisa Su is widely respected for turning AMD around and guiding the company through major innovations and acquisitions (Xilinx, Pensando). Execution has remained consistent, especially in delivering cutting-edge performance-per-watt chips.
Disclosure: I am part of Trade Nation's Influencer program and receive a monthly fee for using their TradingView charts in my analysis.

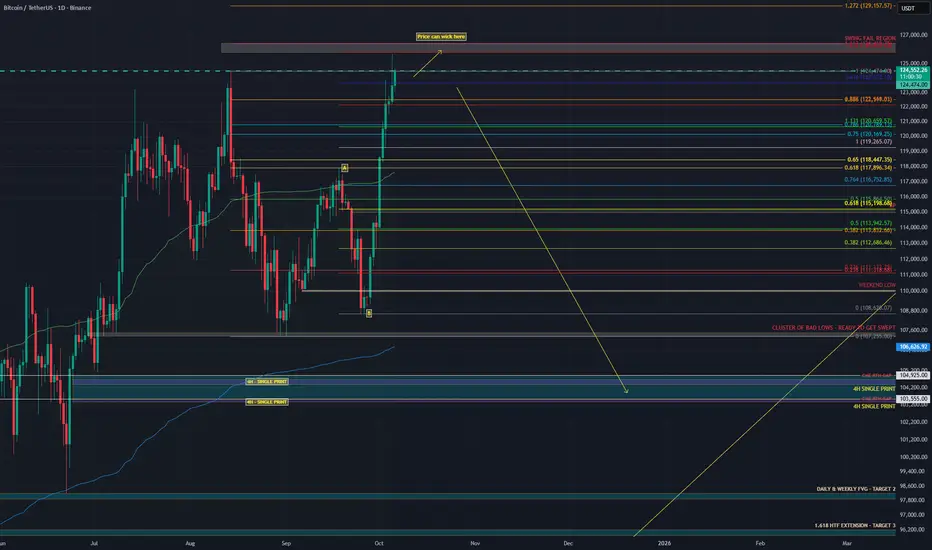
Why MY “Big Dump” THESIS STILL STANDS. BITCOIN WILL BLEEDHappy Monday traders,
I’ve reviewed the latest data again and nothing has changed my view. The structure still looks weak underneath the surface and the setup for downside remains strong.
Summary:
• Price rising → Market pushing higher, looks strong on the surface.
• Stablecoin OI increasing → New leveraged perp positions opening. Speculative money is driving the move, not real buyers.
• Coin-margined OI dropped, then slightly increased → Shorts were closed during the breakout, and now new shorts are opening near the highs.
• Spot CVD flat or slightly negative → Real demand is still missing. Spot traders aren’t supporting this move.
• Stablecoin CVD rising → Perp traders are aggressively buying, lifting price artificially.
• Long/Short ratio falling (2.05 → 1.02) → Fewer longs and more shorts entering. Shorts are fading strength while price keeps rising.
• Price up + OI up + Spot CVD flat → Buyers are being absorbed by new shorts. This is distribution forming at the highs.
• Possible short-term move to 126K → Could sweep weekend highs during RTH for liquidity before a potential reversal.
• If Spot CVD stays flat while OI rises on that move → That would likely be the final squeeze before a deeper dump.
-------------------
1️⃣ The same leverage-driven structure
The breakout on September 25 looked impressive, but it was built on leverage rather than real spot demand.
Stablecoin OI (aggregated) increased from 257K → 285K contracts (+10.9%)
This shows fresh leveraged exposure coming from perps, not genuine buyers
Coin-margined OI dropped from 7.58B → 7.29B during that breakout as shorts were closed out
It has now started to rise slightly again at current prices, meaning new coin-margined positions are opening near the highs, most likely shorts fading strength
2️⃣ Spot demand is still missing
Spot CVD moved from -18.38K → -16.44K (about +10.5%), while futures OI rose almost the same amount. That tells you everything: the breakout was driven by futures leverage, not real spot buying.
Everyone’s renting Ferraris (perp longs), but no one is actually buying one (spot BTC). Once the rental stops, the cars vanish and prices drop.
3️⃣ The long-short ratio collapse
On September 25, the aggregated long/short ratio (Binance + Bybit) was 2.05, meaning twice as many longs as shorts. Today it sits near 1.02, even though price is higher.
Early breakout longs have been closed or liquidated
New traders entering the market are mostly shorts
OI is still rising, showing new short positioning, not liquidation exits
Stablecoin-perp CVD is still climbing, meaning buyers are pushing price up but every uptick is met with new short liquidity
This is a classic case of perps pushing while smarter money fades.
4️⃣ Why I still think Bitcoin will bleed
This looks like distribution, not accumulation.
Perp traders are driving the move
Spot buyers still haven’t shown up
Shorts are building into the highs
That’s not a healthy uptrend. It’s a top-heavy market waiting for the bid to dry up. When it does, the unwind will likely be quick as leveraged positions are forced out.
Think of it like a rubber band. The more it’s stretched by leverage without real demand, the harder it snaps when buying power runs out.
⚖️ TL;DR
Stablecoin OI +10.9% → leverage driven
Coin OI fell, then rose slightly → shorts covered, new shorts forming near highs
Spot CVD flat → no real buyers
Long/Short ratio 2.05 → 1.02 → longs out, shorts in
The move up was built on leverage, not ownership.
Spot hasn’t confirmed, and shorts are stacking into strength.
🎯 Short-term note
There’s a chance we see one more push toward the 126K region during RTH to sweep the weekend highs before rolling over. If that happens with spot CVD still flat and OI climbing, it’ll likely be the final liquidity grab before a larger move down.
Until spot CVD turns positive and OI stabilizes, my view remains the same: Bitcoin will bleed.
Interested in the Order Flow data that I used for this Analysis? Check it out here => ibb.co
GBPAUD: Great Trading Opportunity
GBPAUD
- Classic bullish formation
- Our team expects growth
SUGGESTED TRADE:
Swing Trade
Buy GBPAUD
Entry Level - 2.0337
Sl - 2.0322
Tp - 2.0370
Our Risk - 1%
Start protection of your profits from lower levels
Disclosure: I am part of Trade Nation's Influencer program and receive a monthly fee for using their TradingView charts in my analysis.
❤️ Please, support our work with like & comment! ❤️
