$XAUUSD Analysis - Oct 6 | 15m Time FrameFX:XAUUSD Analysis - 15m
Hello and welcome to another analysis from the Satoshi Frame team!
I’m Abolfazl, and today we’re going to analyze XAUUSD on the 15-minute timeframe.
Gold is showing a strong bullish trend on the 15-minute timeframe, so I recommend avoiding sell positions and focusing only on buy setups.
The marked zones are suitable for trading opportunities.
Price may also react to Fibonacci levels, and the OTE range offers a good area for potential entries.
See you in the next analyses!
Stay tuned with the Satoshi Frame team...
M-signal

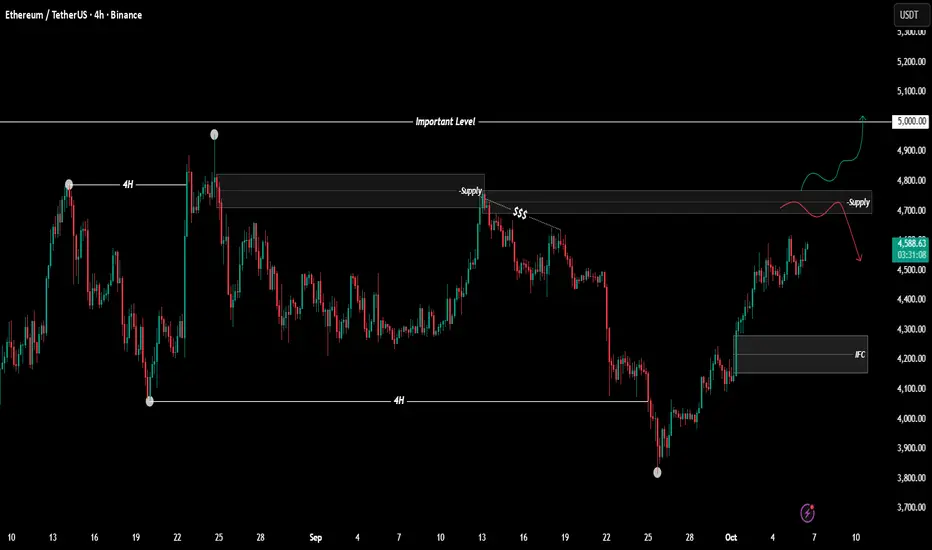
$ETHUSDT Analysis - Oct 6 | 4H Time FrameBINANCE:ETHUSDT Analysis - 4H
Hello and welcome to another analysis from the Satoshi Frame team!
I’m Abolfazl, and today we’re going to analyze Ethereum on the 4-hour timeframe.
As you know, USDT dominance has been trending downward, and the overall market structure is bullish. On the other hand, Bitcoin has set a new all-time high! Considering these factors, it’s clear that Ethereum also has the potential to move toward $5,000, which isn’t unrealistic.
From another perspective, Ethereum has shown a change of character (CHOCH) on the 4-hour timeframe, and the marked supply zone could create a pullback in price.
When the price reaches the supply zone, make sure to look for proper entry confirmations, and keep in mind that there’s a higher chance of the zone being broken and I’m personally looking for long positions.
See you in the next analyses!
Stay tuned with the Satoshi Frame team...
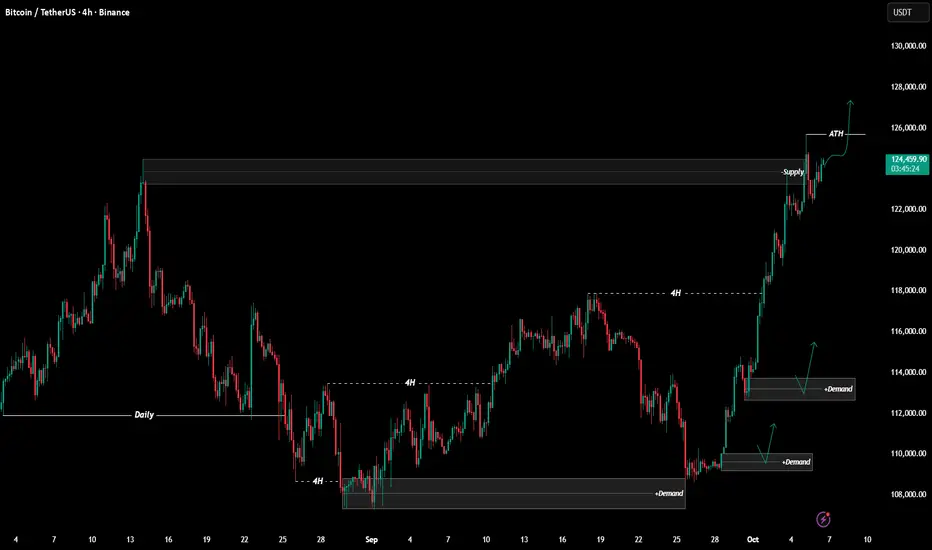
$BTCUSDT Analysis - Oct 6 | 4H Time FrameBINANCE:BTCUSDT Analysis - 4H
Hello and welcome to another analysis from the Satoshi Frame team!
I’m Abolfazl, and today we’re going to analyze Bitcoin on the 4-hour timeframe.
After reaching a new all-time high and making a slight correction, Bitcoin has started moving upward again and could rise up to $127,000
If we see any trend reversal in Bitcoin, we’ll discuss it in future analyses.
On the lower timeframe (15 minutes), you can look for buy positions targeting $127,000** and $130,000.
See you in the next analyses!
Stay tuned with the Satoshi Frame team...
GOLD: Bearish Continuation & Short Signal
GOLD
- Classic bearish pattern
- Our team expects retracement
SUGGESTED TRADE:
Swing Trade
Sell GOLD
Entry - 3940.7
Stop - 3954.8
Take - 3915.7
Our Risk - 1%
Start protection of your profits from lower levels
Disclosure: I am part of Trade Nation's Influencer program and receive a monthly fee for using their TradingView charts in my analysis.
❤️ Please, support our work with like & comment! ❤️

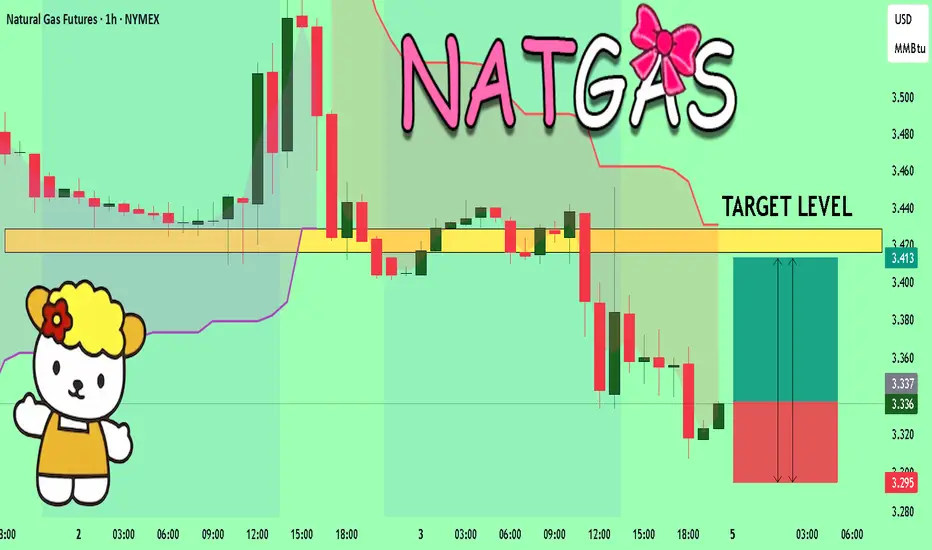
NATGAS Trading Opportunity! BUY!
My dear subscribers,
NATGAS looks like it will make a good move, and here are the details:
The market is trading on 3.336 pivot level.
Bias - Bullish
My Stop Loss - 3.295
Technical Indicators: Both Super Trend & Pivot HL indicate a highly probable Bullish continuation.
Target - 3.416
About Used Indicators:
The average true range (ATR) plays an important role in 'Supertrend' as the indicator uses ATR to calculate its value. The ATR indicator signals the degree of price volatility.
Disclosure: I am part of Trade Nation's Influencer program and receive a monthly fee for using their TradingView charts in my analysis.
———————————
WISH YOU ALL LUCK
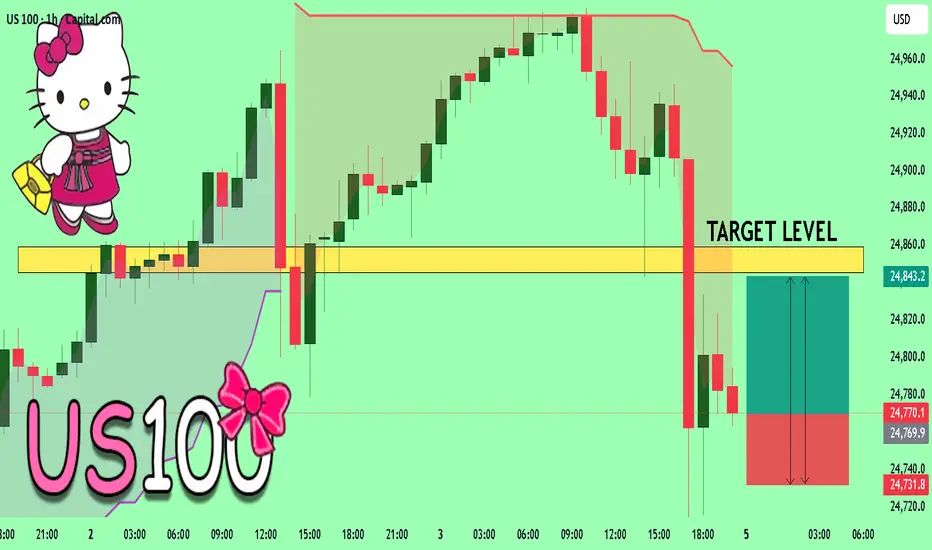
US100 Expected Growth! BUY!
My dear friends,
Please, find my technical outlook for US100 below:
The price is coiling around a solid key level - 24770
Bias -Bullish
Technical Indicators: Pivot Points High anticipates a potential price reversal.
Super trend shows a clear buy, giving a perfect indicators' convergence.
Goal - 24845
Safe Stop Loss - 24731
About Used Indicators:
The pivot point itself is simply the average of the high, low and closing prices from the previous trading day.
Disclosure: I am part of Trade Nation's Influencer program and receive a monthly fee for using their TradingView charts in my analysis.
———————————
WISH YOU ALL LUCK
XAGUSD GOOD SELL OPTIONWe have seen metals roaring upwards. However after recent Diplomatic and Geopolitical situations we can see slight pull back

USDJPY - Range Floor + Trend Support = ConfluenceUSDJPY remains overall bullish within a rising channel, while price has been ranging between a lower demand band and the upper supply.
We’re now dipping into the 146.0–146.7 support area, which aligns with the channel’s lower boundary — a classic confluence zone to hunt for longs.
🔑 Key levels
Support: 146.0–146.7 (range floor + channel support)
Resistance: 149.8–151.0 (range top / supply)
📊 Scenarios
Bullish 📈 Look for a higher-low / bullish candle from 146s → path toward 149.8–151.0.
Bearish 📉 Daily close below 146.0 would invalidate the setup and open a deeper pullback before buyers try again.
Do you buy the retest into the 146s, or wait for momentum to kick in first? 🤔
⚠️ Disclaimer: This is not financial advice. Always do your own research and manage risk properly.
📚 Stick to your trading plan regarding entries, risk, and management.
Good luck! 🍀
All Strategies Are Good; If Managed Properly!
~Richard Nasr

AlgorandAlgo usdt daily analysis
Time frame 4 hours
Risk rewards ratio >2.5 👈
Target = 0.33 $
I entered long position at the end of down trend
LS is so close and tight to decrease of damage

Bitcoin Btc usdt daily analysis
Time frame daily
Btc reached my target
It reached new high price last night about 125.000 $
I think btc will play in yellow box that you can watch in the chart and let other assets to grow up
Alt party has started

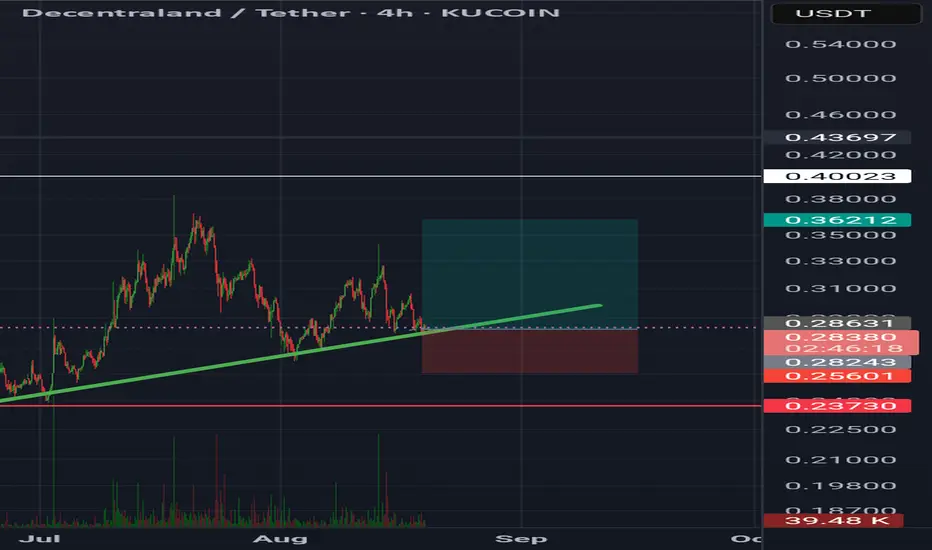
Decentraland (mana) Decentraland token
Mana usdt daily analysis
Time frame 4hours
Risk rewards ratio >3 👈👌
Target
Mana has unacceptable behaviour in crypto market and couldn't break it's resistance line for months.
I don't like this token but I guess here is a good place to open a position and take a good benefit
bitcoinbtc usdt daily analyse
time frame 4 hours
risk rewards ratio > 5 woooow
target 123.000 $
btc is in the down side of my critical red box
here is good area to pump
LS is very tight to decrease my probably damage
so I open a long position to win


GoldXau usd daily analysis
Time frame 4hours
Long position Risk rewards ratio=1.5👈Short position Risk rewards ratio>4.2👈


BTCUSD Set To Fall! SELL!
My dear subscribers,
BTCUSD looks like it will make a good move, and here are the details:
The market is trading on 12278 pivot level.
Bias - Bearish
Technical Indicators: Both Super Trend & Pivot HL indicate a highly probable Bearish continuation.
Target - 11884
About Used Indicators:
The average true range (ATR) plays an important role in 'Supertrend' as the indicator uses ATR to calculate its value. The ATR indicator signals the degree of price volatility.
Disclosure: I am part of Trade Nation's Influencer program and receive a monthly fee for using their TradingView charts in my analysis.
———————————
WISH YOU ALL LUCK

EURUSD: Short Trading Opportunity
EURUSD
- Classic bearish setup
- Our team expects bearish continuation
SUGGESTED TRADE:
Swing Trade
Short EURUSD
Entry Point - 1.1741
Stop Loss - 1.1750
Take Profit - 1.1724
Our Risk - 1%
Start protection of your profits from lower levels
Disclosure: I am part of Trade Nation's Influencer program and receive a monthly fee for using their TradingView charts in my analysis.
❤️ Please, support our work with like & comment! ❤️

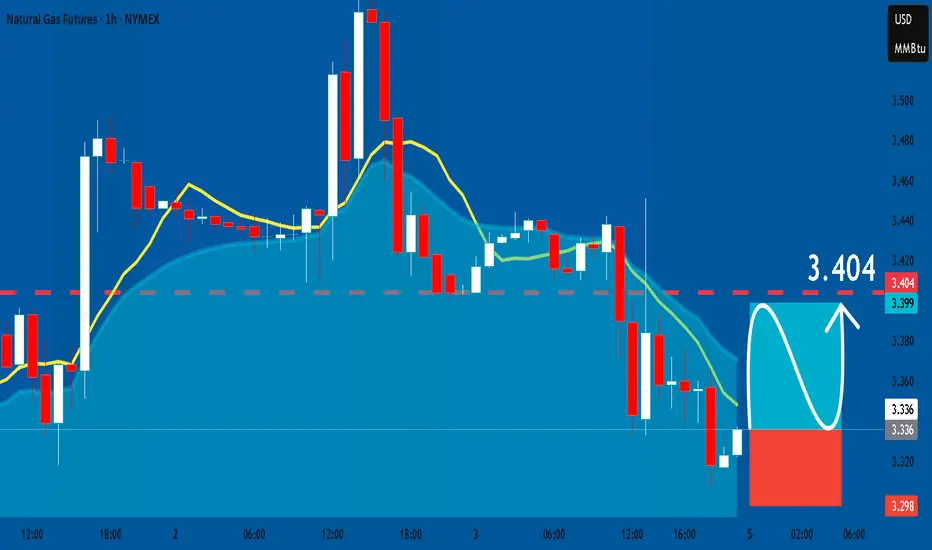
NATGAS: Long Signal Explained
NATGAS
- Classic bullish formation
- Our team expects pullback
SUGGESTED TRADE:
Swing Trade
Long NATGAS
Entry - 3.336
Sl - 3.298
Tp - 3.404
Our Risk - 1%
Start protection of your profits from lower levels
Disclosure: I am part of Trade Nation's Influencer program and receive a monthly fee for using their TradingView charts in my analysis.
❤️ Please, support our work with like & comment! ❤️
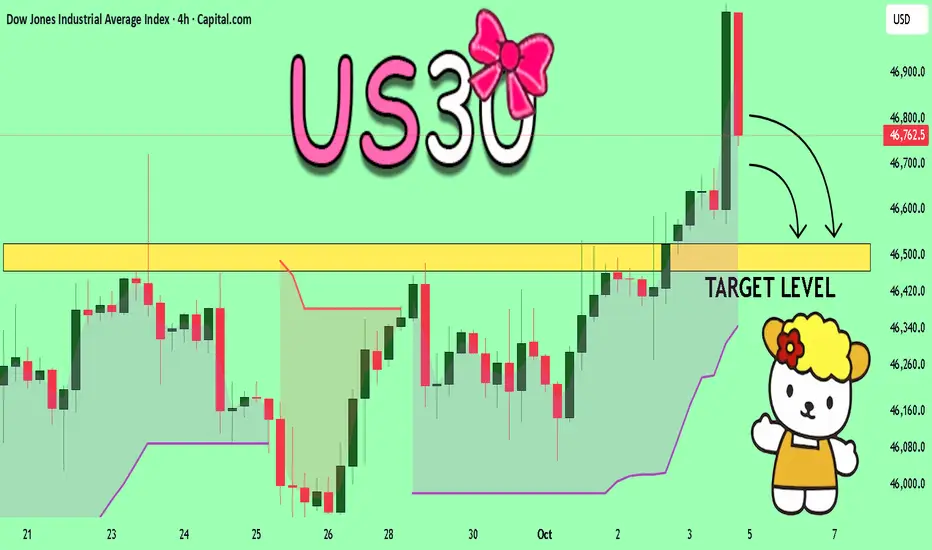
US30 Will Collapse! SELL!
My dear followers,
This is my opinion on the US30 next move:
The asset is approaching an important pivot point 46.762
Bias - Bearish
Technical Indicators: Supper Trend generates a clear short signal while Pivot Point HL is currently determining the overall Bearish trend of the market.
Goal - 46.525
About Used Indicators:
For more efficient signals, super-trend is used in combination with other indicators like Pivot Points.
Disclosure: I am part of Trade Nation's Influencer program and receive a monthly fee for using their TradingView charts in my analysis.
———————————
WISH YOU ALL LUCK