EURCAD - Follow the Bears!Hello TradingView Family / Fellow Traders. This is Richard, also known as theSignalyst.
📈EURCAD has been overall bearish , trading within the falling red channel and it is currently retesting the upper bound of the channel.
Moreover, it is rejecting a weekly resistance marked in blue.
📚 As per my trading style:
As #EURCAD is around the red circle zone, I will be looking for trend-following sell setups on lower timeframes. (like a double top pattern, trendline break , and so on...)
📚 Always follow your trading plan regarding entry, risk management, and trade management.
Good luck!
All Strategies Are Good; If Managed Properly!
~Rich
Disclosure: I am part of Trade Nation's Influencer program and receive a monthly fee for using their TradingView charts in my analysis.
M-signal

Lingrid | NZDUSD Potential Market Correction From ResistanceFX:NZDUSD has approached a key resistance zone at 0.6040 after completing an A-B-C upward move and forming a potential lower high. Price is testing both horizontal and trendline resistance, suggesting exhaustion within the broader upward move. A failure to hold above the 0.6040 area may trigger a reversal toward the 0.5991 support zone. The structure favors a bearish pullback if the breakout is rejected.
📉 Key Levels
Sell trigger: Rejection from 0.6045
Sell zone: 0.6035–0.6045
Target: 0.5991
Invalidation: Close above 0.6055
💡 Risks
Clean breakout above resistance zone
Strengthening NZD from risk sentiment shift
Holding above upward trendline support
If this idea resonates with you or you have your own opinion, traders, hit the comments. I’m excited to read your thoughts!

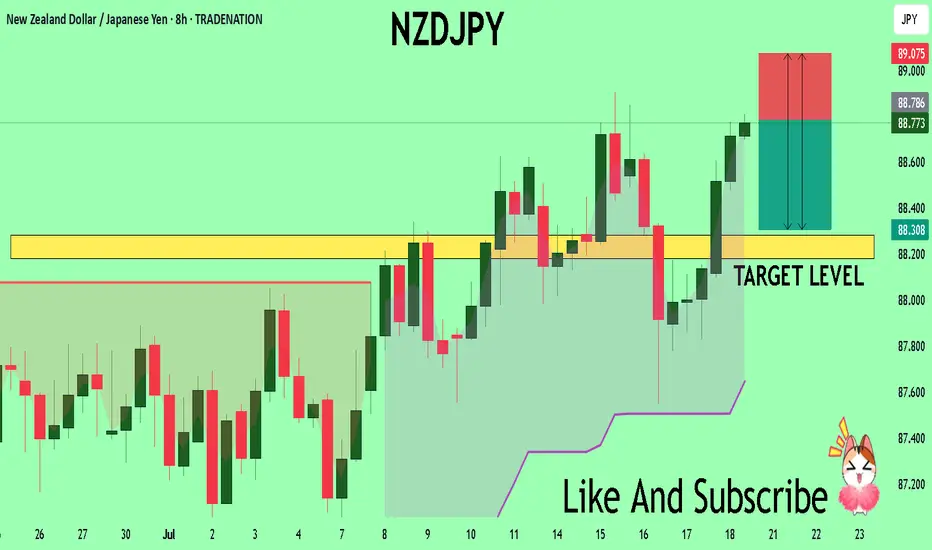
NZDJPY Set To Fall! SELL!
My dear subscribers,
My technical analysis for NZDJPY is below:
The price is coiling around a solid key level - 88.786
Bias - Bearish
Technical Indicators: Pivot Points Low anticipates a potential price reversal.
Super trend shows a clear sell, giving a perfect indicators' convergence.
Goal - 88.284
My Stop Loss - 89.075
About Used Indicators:
By the very nature of the supertrend indicator, it offers firm support and resistance levels for traders to enter and exit trades. Additionally, it also provides signals for setting stop losses
Disclosure: I am part of Trade Nation's Influencer program and receive a monthly fee for using their TradingView charts in my analysis.
———————————
WISH YOU ALL LUCK
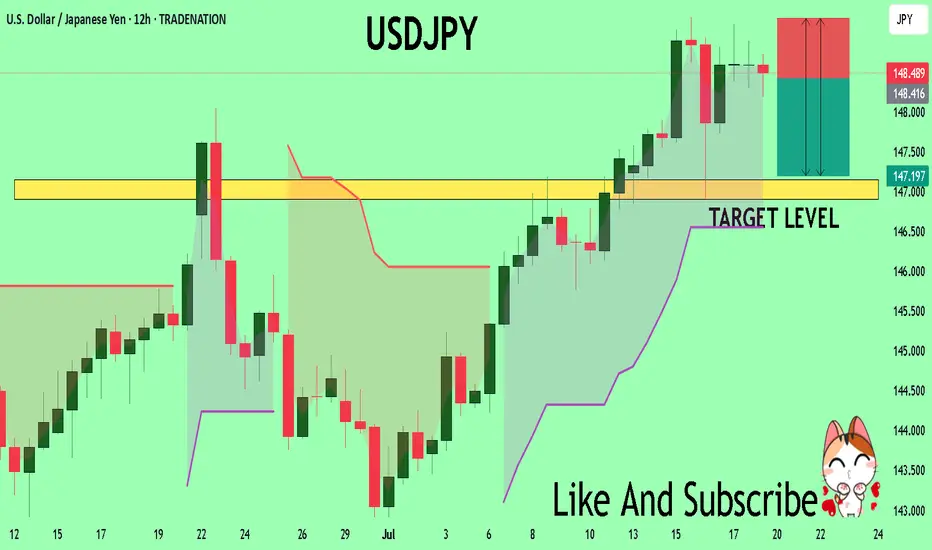
USDJPY Under Pressure! SELL!
My dear friends,
Please, find my technical outlook for USDJPY below:
The instrument tests an important psychological level 148.46
Bias - Bearish
Technical Indicators: Supper Trend gives a precise Bearish signal, while Pivot Point HL predicts price changes and potential reversals in the market.
Target - 147.15
Recommended Stop Loss - 149.17
About Used Indicators:
Super-trend indicator is more useful in trending markets where there are clear uptrends and downtrends in price.
Disclosure: I am part of Trade Nation's Influencer program and receive a monthly fee for using their TradingView charts in my analysis.
———————————
WISH YOU ALL LUCK
NZDJPY: Long Trade Explained
NZDJPY
- Classic bullish setup
- Our team expects bullish continuation
SUGGESTED TRADE:
Swing Trade
Long NZDJPY
Entry Point - 87.616
Stop Loss - 87.361
Take Profit - 88.064
Our Risk - 1%
Start protection of your profits from lower levels
Disclosure: I am part of Trade Nation's Influencer program and receive a monthly fee for using their TradingView charts in my analysis.
❤️ Please, support our work with like & comment! ❤️

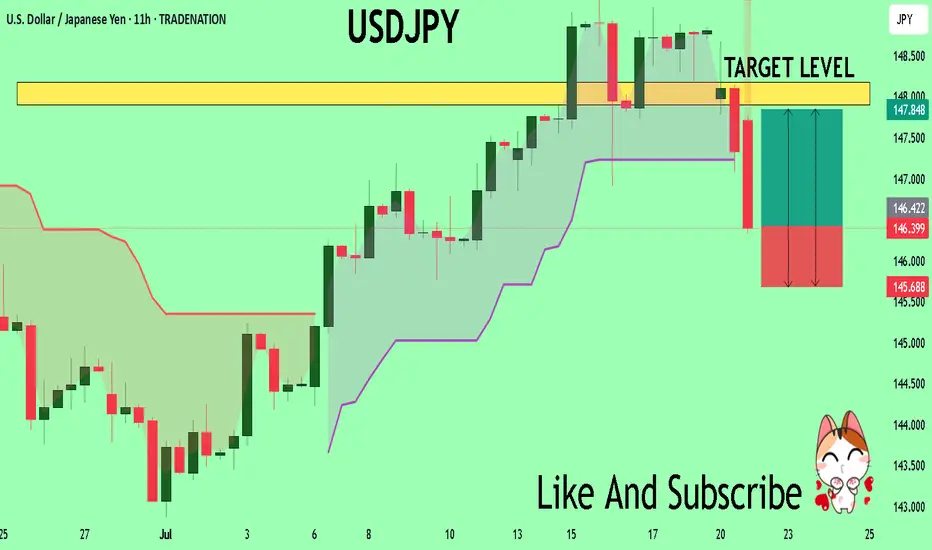
USDJPY Sellers In Panic! BUY!
My dear subscribers,
My technical analysis for USDJPY is below:
The price is coiling around a solid key level - 146.36
Bias - Bullish
Technical Indicators: Pivot Points Low anticipates a potential price reversal.
Super trend shows a clear buy, giving a perfect indicators' convergence.
Goal - 147.90
My Stop Loss - 145.68
About Used Indicators:
By the very nature of the supertrend indicator, it offers firm support and resistance levels for traders to enter and exit trades. Additionally, it also provides signals for setting stop losses
Disclosure: I am part of Trade Nation's Influencer program and receive a monthly fee for using their TradingView charts in my analysis.
———————————
WISH YOU ALL LUCK
GOLD: Bearish Continuation & Short Trade
GOLD
- Classic bearish formation
- Our team expects fall
SUGGESTED TRADE:
Swing Trade
Sell GOLD
Entry Level -3422.5
Sl - 3428.1
Tp - 3408.4
Our Risk - 1%
Start protection of your profits from lower levels
Disclosure: I am part of Trade Nation's Influencer program and receive a monthly fee for using their TradingView charts in my analysis.
❤️ Please, support our work with like & comment! ❤️

EURUSD Will Collapse! SELL!
My dear subscribers,
This is my opinion on the EURUSD next move:
The instrument tests an important psychological level 1.1696
Bias - Bearish
Technical Indicators: Supper Trend gives a precise Bearish signal, while Pivot Point HL predicts price changes and potential reversals in the market.
Target - 1.1651
About Used Indicators:
On the subsequent day, trading above the pivot point is thought to indicate ongoing bullish sentiment, while trading below the pivot point indicates bearish sentiment.
Disclosure: I am part of Trade Nation's Influencer program and receive a monthly fee for using their TradingView charts in my analysis.
———————————
WISH YOU ALL LUCK

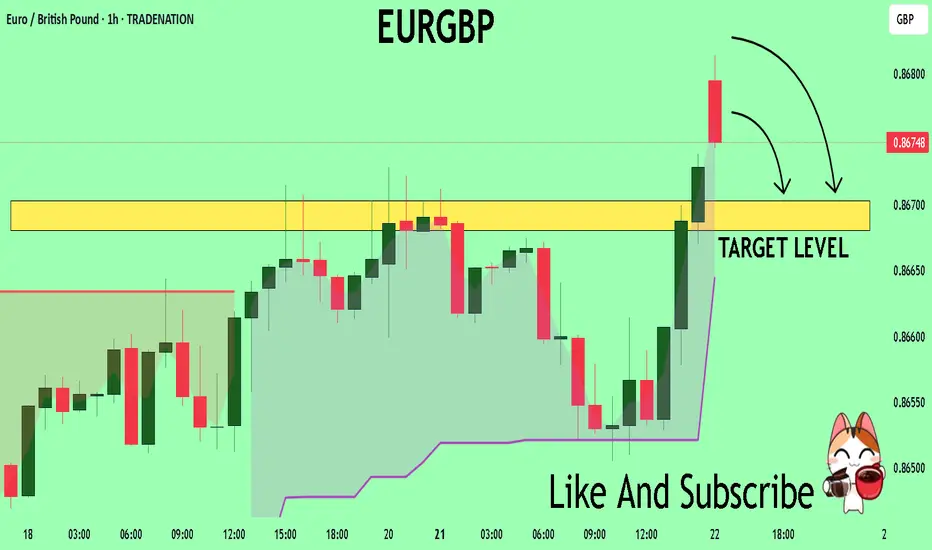
EURGBP The Target Is DOWN! SELL!
My dear friends,
Please, find my technical outlook for EURGBP below:
The price is coiling around a solid key level - 0.8676
Bias - Bearish
Technical Indicators: Pivot Points High anticipates a potential price reversal.
Super trend shows a clear sell, giving a perfect indicators' convergence.
Goal - 0.8670
About Used Indicators:
The pivot point itself is simply the average of the high, low and closing prices from the previous trading day.
Disclosure: I am part of Trade Nation's Influencer program and receive a monthly fee for using their TradingView charts in my analysis.
———————————
WISH YOU ALL LUCK
Lingrid | GOLD Price Correction or Continuation ?The price perfectly fulfilled my last idea . OANDA:XAUUSD has completed an A-B-C bullish movement within the rising structure and is now testing a key resistance zone near 3,387. With momentum fading near the upper boundary, a potential correction toward the 3,367 area is likely before any further advance. A bounce from the SWAP zone may trigger renewed upside toward the 3,430 resistance. Price action remains bullish above the higher low and broken triangle pattern.
📉 Key Levels
Buy trigger: Rebound from 3,367
Buy zone: 3,355–3,370
Target: 3,430
Invalidation: Break below 3,342
💡 Risks
Deep correction below key structure
Failure to reclaim resistance after retest
Sudden shift in macroeconomic sentiment
If this idea resonates with you or you have your own opinion, traders, hit the comments. I’m excited to read your thoughts!

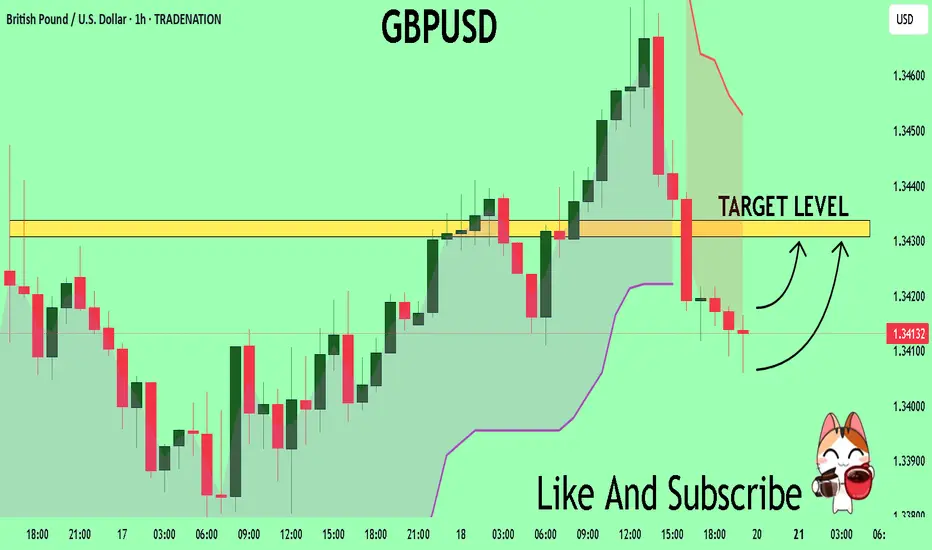
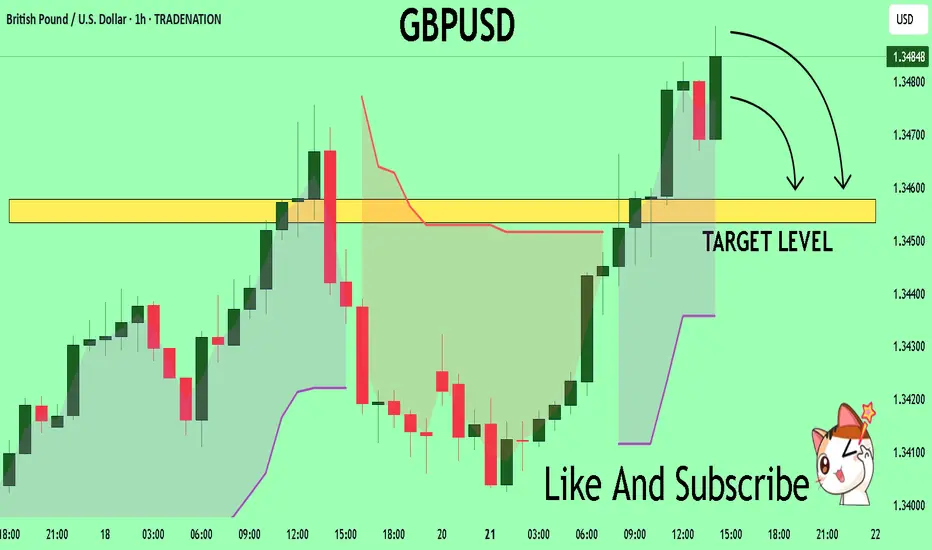
GBPUSD Expected Growth! BUY!
My dear followers,
I analysed this chart on GBPUSD and concluded the following:
The market is trading on 1.3413 pivot level.
Bias - Bullish
Technical Indicators: Both Super Trend & Pivot HL indicate a highly probable Bullish continuation.
Target - 1.3430
About Used Indicators:
A super-trend indicator is plotted on either above or below the closing price to signal a buy or sell. The indicator changes color, based on whether or not you should be buying. If the super-trend indicator moves below the closing price, the indicator turns green, and it signals an entry point or points to buy.
Disclosure: I am part of Trade Nation's Influencer program and receive a monthly fee for using their TradingView charts in my analysis.
———————————
WISH YOU ALL LUCK
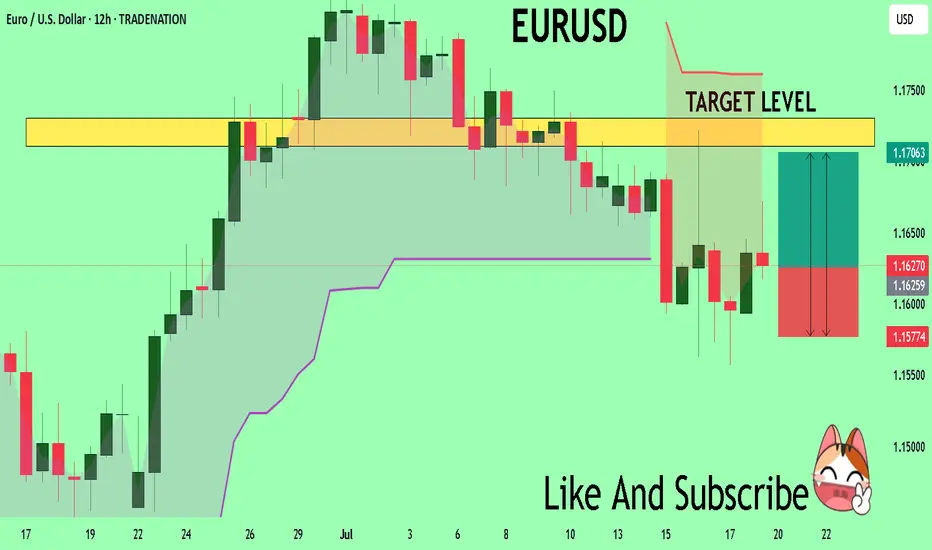
EURUSD Massive Long! BUY!
My dear friends,
Please, find my technical outlook for EURUSD below:
The price is coiling around a solid key level - 1.1627
Bias - Bullish
Technical Indicators: Pivot Points Low anticipates a potential price reversal.
Super trend shows a clear buy, giving a perfect indicators' convergence.
Goal - 1.1710
Safe Stop Loss - 1.1577
About Used Indicators:
The pivot point itself is simply the average of the high, low and closing prices from the previous trading day.
Disclosure: I am part of Trade Nation's Influencer program and receive a monthly fee for using their TradingView charts in my analysis.
———————————
WISH YOU ALL LUCK
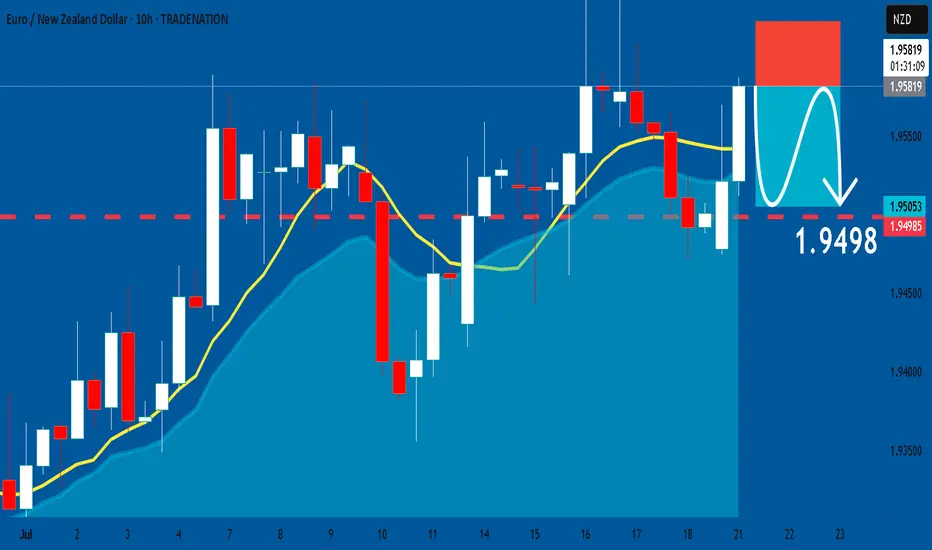
EURNZD: Short Signal with Entry/SL/TP
EURNZD
- Classic bearish formation
- Our team expects pullback
SUGGESTED TRADE:
Swing Trade
Short EURNZD
Entry - 1.9581
Sl - 1.9622
Tp - 1.9498
Our Risk - 1%
Start protection of your profits from lower levels
Disclosure: I am part of Trade Nation's Influencer program and receive a monthly fee for using their TradingView charts in my analysis.
❤️ Please, support our work with like & comment! ❤️
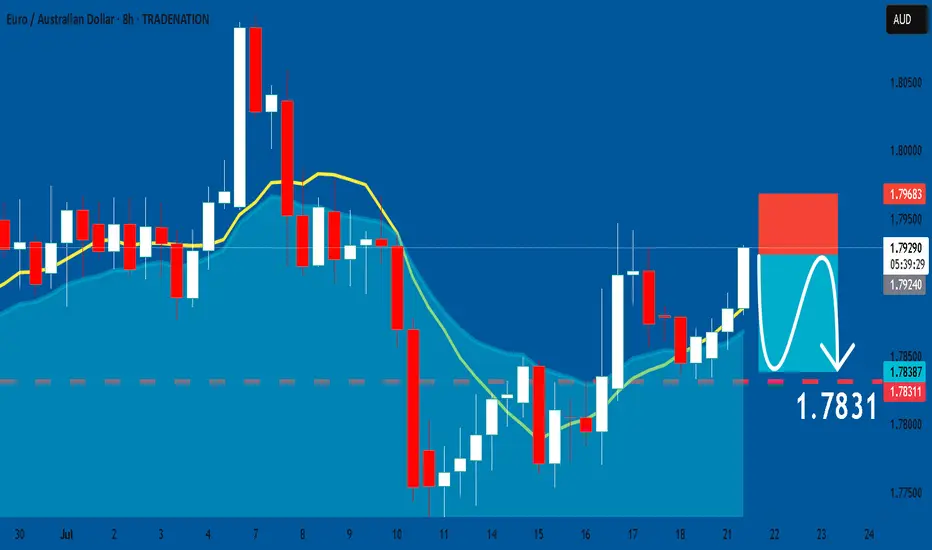
EURAUD: Short Signal Explained
EURAUD
- Classic bearish pattern
- Our team expects retracement
SUGGESTED TRADE:
Swing Trade
Sell EURAUD
Entry - 1.7924
Stop - 1.7968
Take - 1.7831
Our Risk - 1%
Start protection of your profits from lower levels
Disclosure: I am part of Trade Nation's Influencer program and receive a monthly fee for using their TradingView charts in my analysis.
❤️ Please, support our work with like & comment! ❤️
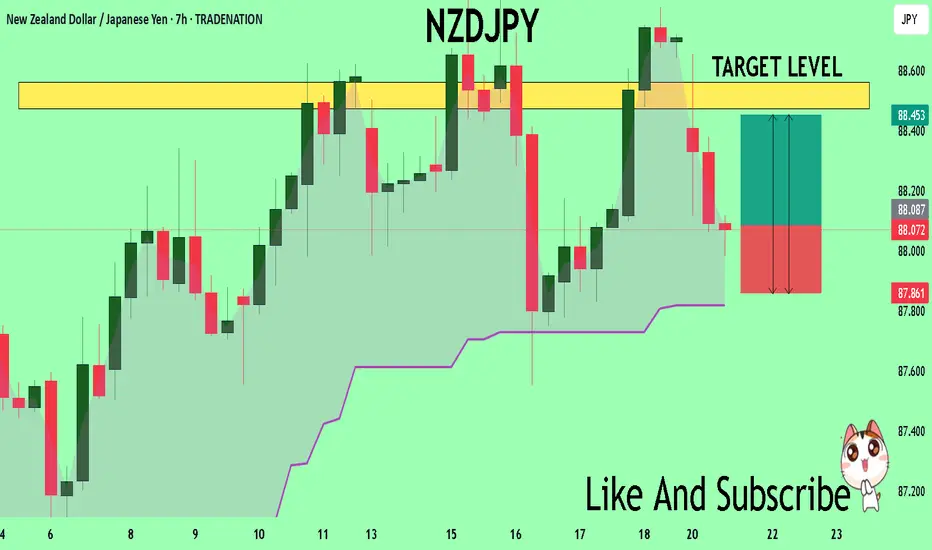
NZDJPY Set To Grow! BUY!
My dear friends,
My technical analysis for NZDJPY is below:
The market is trading on 88.079 pivot level.
Bias - Bullish
Technical Indicators: Both Super Trend & Pivot HL indicate a highly probable Bullish continuation.
Target - 88.472
Recommended Stop Loss - 87.861
About Used Indicators:
A pivot point is a technical analysis indicator, or calculations, used to determine the overall trend of the market over different time frames.
Disclosure: I am part of Trade Nation's Influencer program and receive a monthly fee for using their TradingView charts in my analysis.
———————————
WISH YOU ALL LUCK
EURUSD Bullish ProjectionIt’s been a while since my last update here.
Here’s my projection and actual entry/entries on EURUSD, based on a sweep of the previous 1H swing low and mitigation of a Daily imbalance (Fair Value Gap).
We're anticipating a full Change of Character to mark the end of the ongoing Daily pullback.

GBPUSD Under Pressure! SELL!
My dear subscribers,
GBPUSD looks like it will make a good move, and here are the details:
The market is trading on 1.3483 pivot level.
Bias - Bearish
Technical Indicators: Both Super Trend & Pivot HL indicate a highly probable Bearish continuation.
Target - 1.3457
About Used Indicators:
The average true range (ATR) plays an important role in 'Supertrend' as the indicator uses ATR to calculate its value. The ATR indicator signals the degree of price volatility.
Disclosure: I am part of Trade Nation's Influencer program and receive a monthly fee for using their TradingView charts in my analysis.
———————————
WISH YOU ALL LUCK
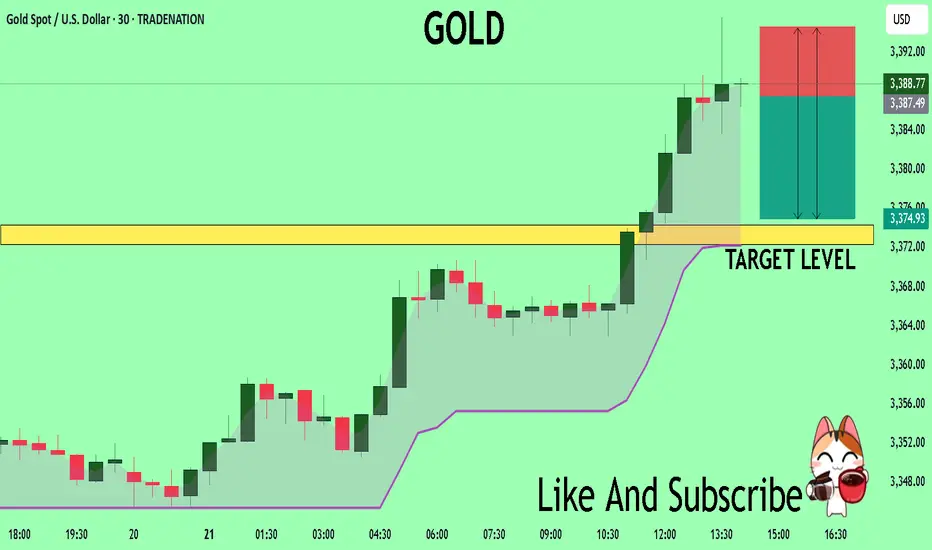
GOLD Technical Analysis! SELL!
My dear subscribers,
This is my opinion on the GOLD next move:
The instrument tests an important psychological level 3387.7
Bias - Bearish
Technical Indicators: Supper Trend gives a precise Bearish signal, while Pivot Point HL predicts price changes and potential reversals in the market.
Target - 3374.3
My Stop Loss - 3394.5
About Used Indicators:
On the subsequent day, trading above the pivot point is thought to indicate ongoing bullish sentiment, while trading below the pivot point indicates bearish sentiment.
Disclosure: I am part of Trade Nation's Influencer program and receive a monthly fee for using their TradingView charts in my analysis.
———————————
WISH YOU ALL LUCK
euraud long tradein my opinion this is a good trade with a good r/r
hope hit the tp
consider this is my trade not your trade and i just like to share my trades with world

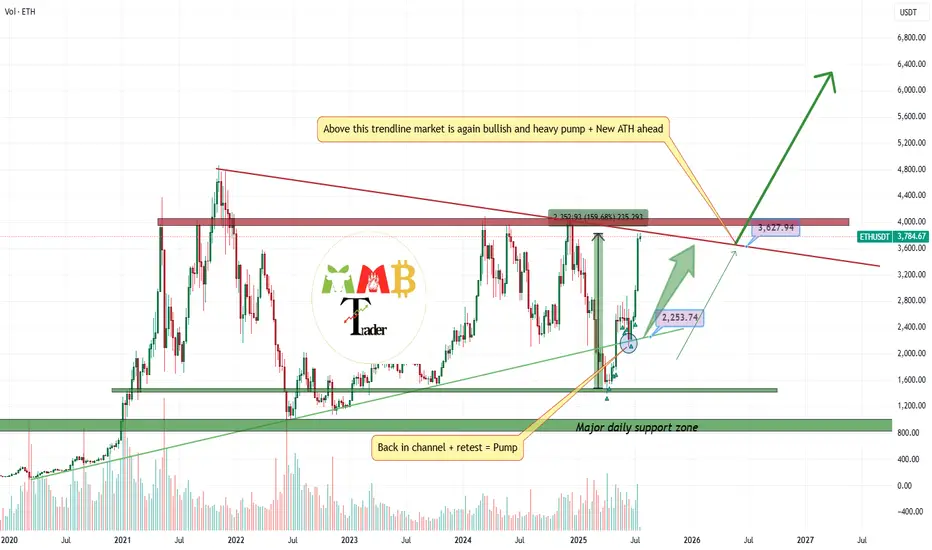
The best Buy call doesn't exists?(+160% profit on ETH)After i open long at weekly low and it almost play well until now:
\https://www.tradingview.com/chart/ETHUSDT/BrdJLvgY-ETHUSDT-near-two-major-weekly-support-and-soon-2200/
Now i am looking for range here or without that range ASAP red trendline will break to the upside and more pump and gain also is expected and this is just the beginning.
DISCLAIMER: ((trade based on your own decision))
<<press like👍 if you enjoy💚
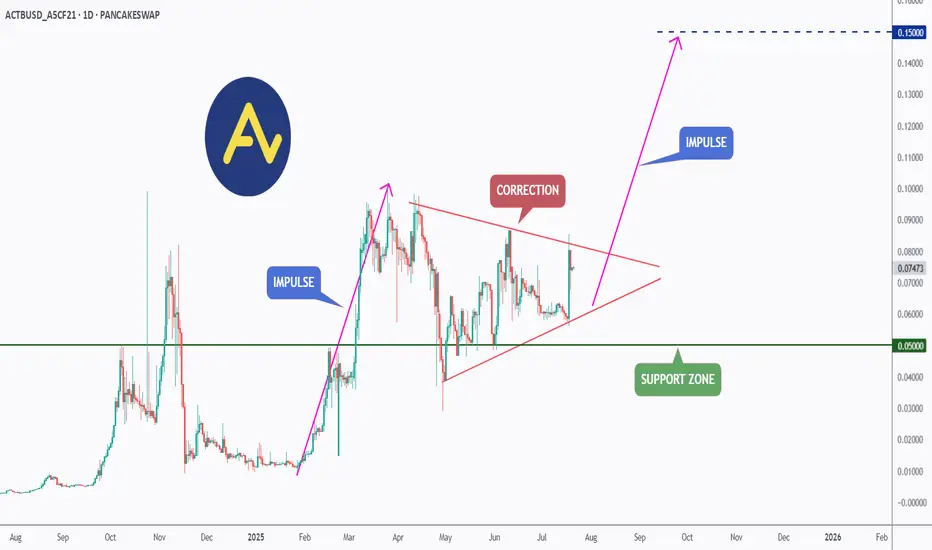
ACT (Acet) - Eyeing the Next Impulse Move?ACT has been forming a textbook bullish continuation pattern.↗️
After a strong impulse leg earlier this year, price has been consolidating within a symmetrical triangle, signaling a healthy correction phase.
🏹Today, ACT broke out of the triangle to the upside , indicating that bulls may be taking control once again.
📍If momentum continues, the next impulse move could push price toward the $0.15 resistance as a first target — a major psychological and technical level.
As long as the $0.050 support holds, ACT remains in bullish territory with upside potential in sight.
📚 Always follow your trading plan regarding entry, risk management, and trade management.
Good luck!
All Strategies Are Good; If Managed Properly!
~Richard Nasr
GBPJPY - Trading The Range!Hello TradingView Family / Fellow Traders. This is Richard, also known as theSignalyst.
📈GBPJPY has been hovering within a big range.
This week, GBPJPY is retesting the upper bound of the range and $200 round number.
As long as the resistance holds, we will be looking for shorts on lower timeframes, targeting the lower bound of the range.
📚 Always follow your trading plan regarding entry, risk management, and trade management.
Good luck!
All Strategies Are Good; If Managed Properly!
~Rich
Disclosure: I am part of Trade Nation's Influencer program and receive a monthly fee for using their TradingView charts in my analysis.

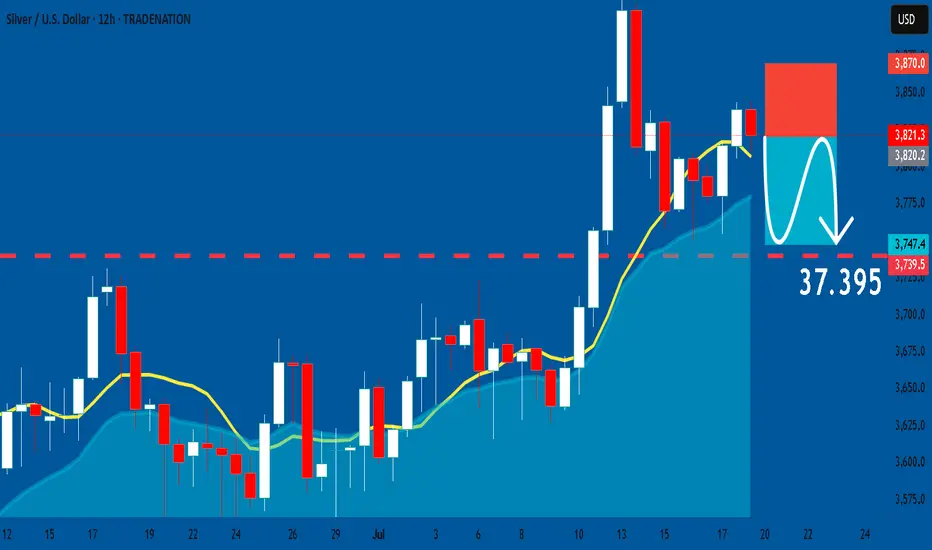
SILVER: Short Trade with Entry/SL/TP
SILVER
- Classic bearish setup
- Our team expects bearish continuation
SUGGESTED TRADE:
Swing Trade
Short SILVER
Entry Point - 38.213
Stop Loss - 38.700
Take Profit - 37.395
Our Risk - 1%
Start protection of your profits from lower levels
Disclosure: I am part of Trade Nation's Influencer program and receive a monthly fee for using their TradingView charts in my analysis.
❤️ Please, support our work with like & comment! ❤️