GBPJPY What Next? SELL!
My dear subscribers,
This is my opinion on the GBPJPY next move:
The instrument tests an important psychological level 203.99
Bias - Bearish
Technical Indicators: Supper Trend gives a precise Bearish signal, while Pivot Point HL predicts price changes and potential reversals in the market.
Target - 203.66
My Stop Loss - 204.17
About Used Indicators:
On the subsequent day, trading above the pivot point is thought to indicate ongoing bullish sentiment, while trading below the pivot point indicates bearish sentiment.
Disclosure: I am part of Trade Nation's Influencer program and receive a monthly fee for using their TradingView charts in my analysis.
———————————
WISH YOU ALL LUCK
M-signal

$SOL - LONG - ABOUT TO POP?Analysis:
Following up on my Oct 14th BTC note — “Wait for arbitrage to balance spot markets” — we’re now nearing that blue box. As BTC approaches equilibrium, I’m eyeing CRYPTOCAP:SOL for a clean long setup.
Here’s why 👇
AVWAP Confluence Zone:
We’ve got the lower band of a HTF auction colliding with the VWAP line from another HTF auction — strong mean reversion and liquidity overlap. (Didn’t draw them out to keep the chart clean.)
Fibonacci Confluence:
A completed AB=CD right at 175.0, perfectly inside the HTF golden pocket (0.618). That’s a key structural retrace aligning with measured move completion.
Bullish Harmonic (4H):
A textbook bull harmonic forming — early signs of reversal pressure building.
No position yet. Waiting for SOL (CME) to close the gap at ~174.7 — that’s my trigger to go long.
🎯 Target: 223 — with a possible sweep of the 229–230 zone where shorts are stacked. Expecting a short squeeze flush through that region.
Seeing solid order flow confluence across the board.
Will update this post as things unfold.

BITCOIN - PUMP BEFORE THE DUMP?Traders,
Last time I talked about arbitrage inefficiencies between spot and perps. I expected a dip first, then a corrective move up. That view still stands — but I also expected a sweep up before the bigger move down.
In my earlier notes I called for a sweep to clean the Sunday low, followed by a move back toward 120–122k with a short squeeze.
That scenario is now in play.
I planned to long near 109.350, after the sweep, and only if the data aligned with my thesis.
What I projected vs what happened
Sweep the Sunday lows, then squeeze up.
Wait for the sweep and only enter if the data confirms around 109.550. Entered 109.550 once multiple signals lined up.
Why I entered at 109.550
Stablecoin-margined CVD
First pass: Stablecoin Margined CVD made a lower low while price made a higher low → hidden bullish divergence. Aggressive sellers were getting absorbed by resting bids.
Second pass: Stablecoin Margined CVD made a higher low while price made a lower low → selling pressure fading, buyers absorbing again.
Coin-margined CVD
Coin Margined CVD kept making lower lows while price refused to follow → another hidden bull div. Shorts were leaning in, but passive buying held firm.
Spot CVD
Lower lows on CVD while price held flat or slightly higher → trapped aggressive sellers, absorbed by steady passive spot buyers.
On Binance Perp Order Flow we could also see a regular bullish divergence into a smaller hidden bull div at the sweep — a clean reversal setup.
Open Interest read
Here’s where many traders miss the nuance. There are two main perp types on Binance and most major exchanges:
Coin-margined contracts: collateralized with the underlying asset (e.g., BTC). Profits and losses are settled in BTC. Stablecoin-margined contracts: collateralized with a stable asset (e.g., USDT or USDC). Profits and losses are settled in dollars.
This matters because the behavior and risk exposure of traders differ between the two:
When coin-margined OI goes down, it usually means BTC-collateral traders are closing positions or getting liquidated. They’re forced to sell BTC to cover margin, which can create short-term downside pressure.
When stablecoin-margined OI goes up at the same time, it often means new traders are entering positions with USDT collateral. That capital rotation usually signals fresh directional bets, often late shorts piling in after a move down.
So when price stops making new lows while stablecoin OI keeps climbing, it’s a clear sign the market is loading up on shorts, but without continuation. That mismatch is short-squeeze fuel. Combine that with the CVD divergences above and it paints a strong case for a move back into overhead liquidity.
Supplementary edge
1H RSI bullish divergence: RSI makes higher lows while price makes lower lows → loss of downside momentum, suggesting sellers are tiring.
USDC.D and USDT.D bearish divergences: Stablecoin dominance charts make higher highs while RSI trends lower → stablecoin demand weakening. When that happens, capital tends to rotate back into BTC and risk assets, reinforcing the long bias.
Broke above daily VWAP
Together, these add extra confluence to the squeeze setup.
Plan, target, invalidation
Target: 122 area (blue box).
At target: watching for rising price with fading delta, sell imbalances near highs, and absorption signals — that’s where I’ll start hunting shorts and let the market cool off. Invalidation: acceptance back below the Sunday sweep low with expanding negative delta and rising OI on the breakdown. That would kill the squeeze thesis.
Summary:
A clean sweep → multi-CVD bullish divergences → absorption → rising OI imbalance → RSI & VWAP confluence. All aligning for a controlled short squeeze toward 122k, before the market potentially resumes its broader corrective path.
Does this mean we 100% go up? No. Markets don’t promise: they whisper. You listen, you align, and you risk what you can afford to be wrong about.

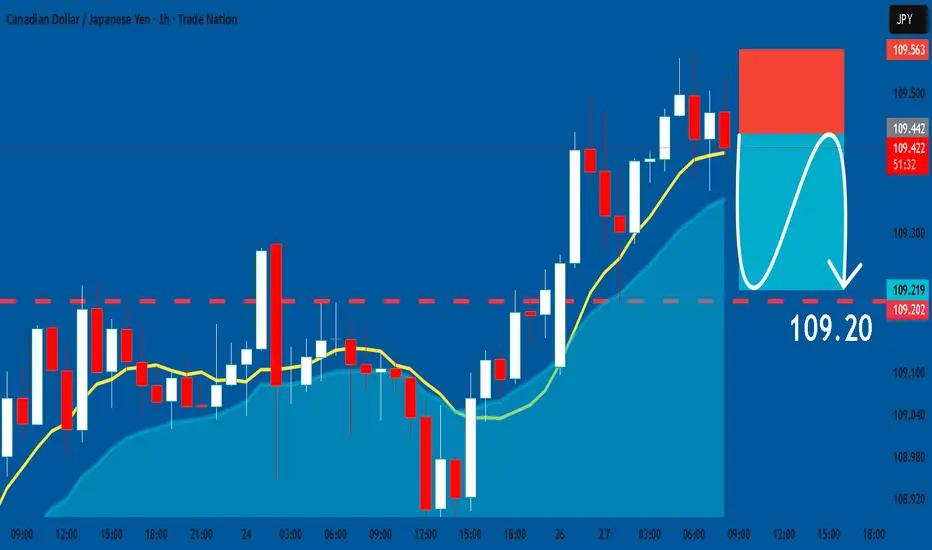
CADJPY: Bearish Continuation & Short Signal
CADJPY
- Classic bearish pattern
- Our team expects retracement
SUGGESTED TRADE:
Swing Trade
Sell CADJPY
Entry - 109.44
Stop - 109.56
Take - 109.20
Our Risk - 1%
Start protection of your profits from lower levels
Disclosure: I am part of Trade Nation's Influencer program and receive a monthly fee for using their TradingView charts in my analysis.
❤️ Please, support our work with like & comment! ❤️
AUDUSD My Opinion! SELL!
My dear followers,
This is my opinion on the AUDUSD next move:
The asset is approaching an important pivot point 0.6538
Bias - Bearish
Technical Indicators: Supper Trend generates a clear short signal while Pivot Point HL is currently determining the overall Bearish trend of the market.
Goal - 0.6510
About Used Indicators:
For more efficient signals, super-trend is used in combination with other indicators like Pivot Points.
Disclosure: I am part of Trade Nation's Influencer program and receive a monthly fee for using their TradingView charts in my analysis.
———————————
WISH YOU ALL LUCK

GOLD Massive Long! BUY!
My dear friends,
Please, find my technical outlook for GOLD below:
The price is coiling around a solid key level - 4068.0
Bias - Bullish
Technical Indicators: Pivot Points Low anticipates a potential price reversal.
Super trend shows a clear buy, giving a perfect indicators' convergence.
Goal - 4087.0
Safe Stop Loss - 4058.5
About Used Indicators:
The pivot point itself is simply the average of the high, low and closing prices from the previous trading day.
Disclosure: I am part of Trade Nation's Influencer program and receive a monthly fee for using their TradingView charts in my analysis.
———————————
WISH YOU ALL LUCK

EURNZD Under Pressure! SELL!
My dear subscribers,
My technical analysis for EURNZD is below:
The price is coiling around a solid key level - 2.0233
Bias - Bearish
Technical Indicators: Pivot Points High anticipates a potential price reversal.
Super trend shows a clear sell, giving a perfect indicators' convergence.
Goal - 2.0208
My Stop Loss - 2.0248
About Used Indicators:
By the very nature of the supertrend indicator, it offers firm support and resistance levels for traders to enter and exit trades. Additionally, it also provides signals for setting stop losses
Disclosure: I am part of Trade Nation's Influencer program and receive a monthly fee for using their TradingView charts in my analysis.
———————————
WISH YOU ALL LUCK

USDCAD Expected Growth! BUY!
My dear subscribers,
USDCAD looks like it will make a good move, and here are the details:
The market is trading on 1.3993 pivot level.
Bias - Bullish
My Stop Loss - 1.3986
Technical Indicators: Both Super Trend & Pivot HL indicate a highly probable Bullish continuation.
Target - 1.4007
About Used Indicators:
The average true range (ATR) plays an important role in 'Supertrend' as the indicator uses ATR to calculate its value. The ATR indicator signals the degree of price volatility.
Disclosure: I am part of Trade Nation's Influencer program and receive a monthly fee for using their TradingView charts in my analysis.
———————————
WISH YOU ALL LUCK

GBPCAD Technical Analysis! BUY!
My dear friends,
My technical analysis for GBPCAD is below:
The market is trading on 1.8627 pivot level.
Bias - Bullish
Technical Indicators: Both Super Trend & Pivot HL indicate a highly probable Bullish continuation.
Target - 1.8651
Recommended Stop Loss - 1.8615
About Used Indicators:
A pivot point is a technical analysis indicator, or calculations, used to determine the overall trend of the market over different time frames.
Disclosure: I am part of Trade Nation's Influencer program and receive a monthly fee for using their TradingView charts in my analysis.
———————————
WISH YOU ALL LUCK

EURUSD Set To Fall! SELL!
My dear friends,
Please, find my technical outlook for EURUSD below:
The instrument tests an important psychological level 1.1627
Bias - Bearish
Technical Indicators: Supper Trend gives a precise Bearish signal, while Pivot Point HL predicts price changes and potential reversals in the market.
Target - 1.1589
About Used Indicators:
Super-trend indicator is more useful in trending markets where there are clear uptrends and downtrends in price.
Disclosure: I am part of Trade Nation's Influencer program and receive a monthly fee for using their TradingView charts in my analysis.
———————————
WISH YOU ALL LUCK

US30: Bearish Continuation & Short Signal
US30
- Classic bearish setup
- Our team expects bearish continuation
SUGGESTED TRADE:
Swing Trade
Short US30
Entry Point - 47206
Stop Loss - 47308
Take Profit - 46961
Our Risk - 1%
Start protection of your profits from lower levels
Disclosure: I am part of Trade Nation's Influencer program and receive a monthly fee for using their TradingView charts in my analysis.
❤️ Please, support our work with like & comment! ❤️

GBPCHF: Long Trading Opportunity
GBPCHF
- Classic bullish formation
- Our team expects growth
SUGGESTED TRADE:
Swing Trade
Buy GBPCHF
Entry Level - 1.0593
Sl - 1.0581
Tp - 1.0612
Our Risk - 1%
Start protection of your profits from lower levels
Disclosure: I am part of Trade Nation's Influencer program and receive a monthly fee for using their TradingView charts in my analysis.
❤️ Please, support our work with like & comment! ❤️

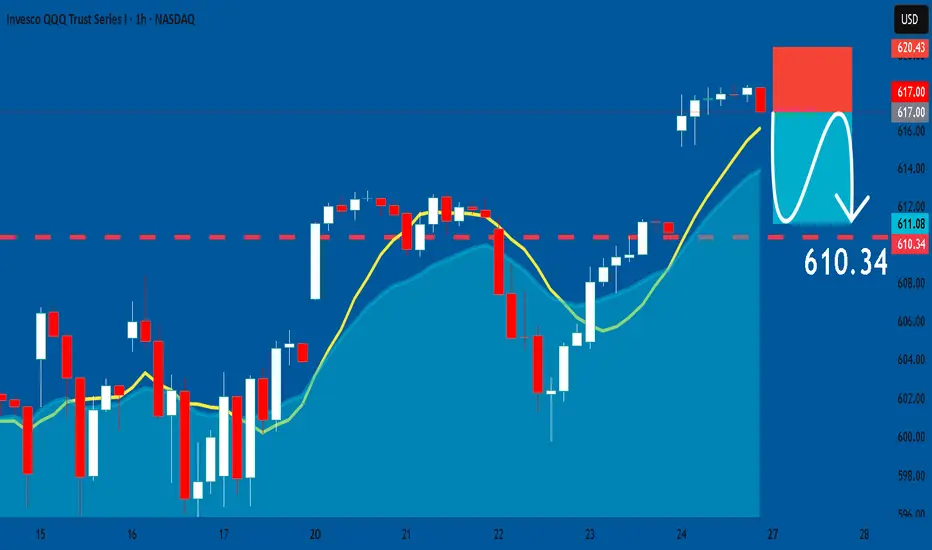
QQQ Will Collapse! SELL!
My dear followers,
I analysed this chart on QQQ and concluded the following:
The market is trading on 617.00 pivot level.
Bias - Bearish
Technical Indicators: Both Super Trend & Pivot HL indicate a highly probable Bearish continuation.
Target - 605.94
About Used Indicators:
A super-trend indicator is plotted on either above or below the closing price to signal a buy or sell. The indicator changes color, based on whether or not you should be buying. If the super-trend indicator moves below the closing price, the indicator turns green, and it signals an entry point or points to buy.
Disclosure: I am part of Trade Nation's Influencer program and receive a monthly fee for using their TradingView charts in my analysis.
———————————
WISH YOU ALL LUCK
TRUMPUSDT.P - October 24, 2025Based on the chart's current upward trendline and consolidation near $5.911, a long entry targeting the $6.111 resistance is suggested. This setup carries significant risk, plan your trades accordingly.

SOLUSDT.P - October 26, 2025Based on the 4-hour chart, the price appears to be consolidating within a triangle after a sharp decline. A long bias is supported by the potential for a breakout above the upper trendline.

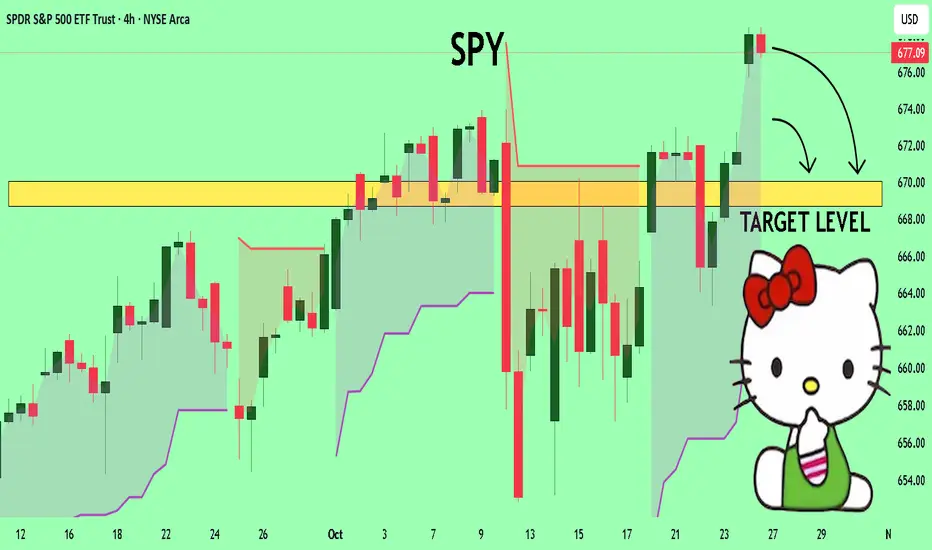
SPY The Target Is DOWN! SELL!
My dear friends,
SPY looks like it will make a good move, and here are the details:
The market is trading on 677.09 pivot level.
Bias - Bearish
Technical Indicators: Supper Trend generates a clear short signal while Pivot Point HL is currently determining the overall Bearish trend of the market.
Goal - 670.03
About Used Indicators:
Pivot points are a great way to identify areas of support and resistance, but they work best when combined with other kinds of technical analysis
Disclosure: I am part of Trade Nation's Influencer program and receive a monthly fee for using their TradingView charts in my analysis.
———————————
WISH YOU ALL LUCK
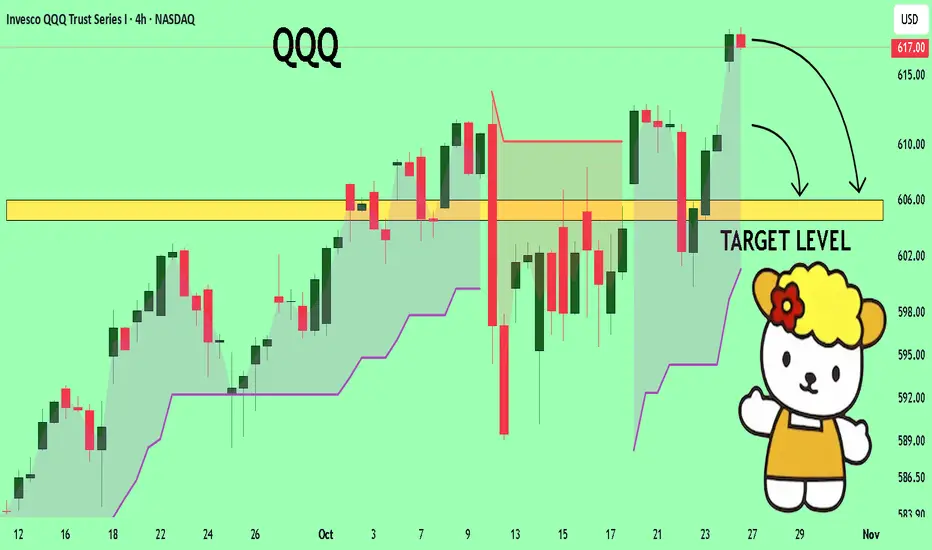
QQQ: Short Trading Opportunity
QQQ
- Classic bearish formation
- Our team expects fall
SUGGESTED TRADE:
Swing Trade
Sell QQQ
Entry Level - 617.00
Sl -620.43
Tp - 610.34
Our Risk - 1%
Start protection of your profits from lower levels
Disclosure: I am part of Trade Nation's Influencer program and receive a monthly fee for using their TradingView charts in my analysis.
❤️ Please, support our work with like & comment! ❤️
GODSUSDT.P - October 25, 2025GODSUSDT.P is displaying early bullish momentum with potential upside toward the 0.1221 resistance, indicating a long bias. However, this is a high-risk setup as the token shows very volatile movement—it’s advisable to take partial profit and move the stop level to breakeven once price reaches the 0.11070 area.

NATGAS: Short Trade Explained
NATGAS
- Classic bearish formation
- Our team expects pullback
SUGGESTED TRADE:
Swing Trade
Short NATGAS
Entry - 3.337
Sl - 3.372
Tp - 3.272
Our Risk - 1%
Start protection of your profits from lower levels
Disclosure: I am part of Trade Nation's Influencer program and receive a monthly fee for using their TradingView charts in my analysis.
❤️ Please, support our work with like & comment! ❤️

XRPUSDT.P - October 25, 2025XRPUSDT is showing bullish momentum with a potential continuation toward the 3.1327 resistance zone, making this a medium-risk long setup. Move the stop level to 2.7152, and while it’s recommended to take full profit at 3.1327 for a better RRR, traders may choose to take partial profit and move the stop to breakeven or simply adjust the stop to breakeven within that range.

TESLA On The Rise! BUY!
My dear followers,
This is my opinion on the TESLA next move:
The asset is approaching an important pivot point 433.50
Bias - Bullish
Safe Stop Loss - 429.07
Technical Indicators: Supper Trend generates a clear long signal while Pivot Point HL is currently determining the overall Bullish trend of the market.
Goal -440.74
About Used Indicators:
For more efficient signals, super-trend is used in combination with other indicators like Pivot Points.
Disclosure: I am part of Trade Nation's Influencer program and receive a monthly fee for using their TradingView charts in my analysis.
———————————
WISH YOU ALL LUCK

USOIL Buyers In Panic! SELL!
My dear subscribers,
This is my opinion on the USOIL next move:
The instrument tests an important psychological level 61.43
Bias - Bearish
Technical Indicators: Supper Trend gives a precise Bearish signal, while Pivot Point HL predicts price changes and potential reversals in the market.
Target - 59.88
About Used Indicators:
On the subsequent day, trading above the pivot point is thought to indicate ongoing bullish sentiment, while trading below the pivot point indicates bearish sentiment.
Disclosure: I am part of Trade Nation's Influencer program and receive a monthly fee for using their TradingView charts in my analysis.
———————————
WISH YOU ALL LUCK

US30 Massive Short! SELL!
My dear friends,
Please, find my technical outlook for US30 below:
The instrument tests an important psychological level 47206
Bias - Bearish
Technical Indicators: Supper Trend gives a precise Bearish signal, while Pivot Point HL predicts price changes and potential reversals in the market.
Target - 46982
Recommended Stop Loss - 47329
About Used Indicators:
Super-trend indicator is more useful in trending markets where there are clear uptrends and downtrends in price.
Disclosure: I am part of Trade Nation's Influencer program and receive a monthly fee for using their TradingView charts in my analysis.
———————————
WISH YOU ALL LUCK
