APPLE The Target Is DOWN! SELL!
My dear subscribers,
This is my opinion on the APPLE next move:
The instrument tests an important psychological level 278.82
Bias - Bearish
Technical Indicators: Supper Trend gives a precise Bearish signal, while Pivot Point HL predicts price changes and potential reversals in the market.
Target - 274.28
About Used Indicators:
On the subsequent day, trading above the pivot point is thought to indicate ongoing bullish sentiment, while trading below the pivot point indicates bearish sentiment.
Disclosure: I am part of Trade Nation's Influencer program and receive a monthly fee for using their TradingView charts in my analysis.
———————————
WISH YOU ALL LUCK
M-signal

SPY Buyers In Panic! SELL!
My dear followers,
This is my opinion on the SPY next move:
The asset is approaching an important pivot point 683.34
Bias - Bearish
Safe Stop Loss - 688.64
Technical Indicators: Supper Trend generates a clear short signal while Pivot Point HL is currently determining the overall Bearish trend of the market.
Goal - 674.67
About Used Indicators:
For more efficient signals, super-trend is used in combination with other indicators like Pivot Points.
Disclosure: I am part of Trade Nation's Influencer program and receive a monthly fee for using their TradingView charts in my analysis.
———————————
WISH YOU ALL LUCK

SILVER Massive Short! SELL!
My dear friends,
Please, find my technical outlook for SILVER below:
The price is coiling around a solid key level - 56.402
Bias - Bearish
Technical Indicators: Pivot Points High anticipates a potential price reversal.
Super trend shows a clear sell, giving a perfect indicators' convergence.
Goal - 54.067
About Used Indicators:
The pivot point itself is simply the average of the high, low and closing prices from the previous trading day.
Disclosure: I am part of Trade Nation's Influencer program and receive a monthly fee for using their TradingView charts in my analysis.
———————————
WISH YOU ALL LUCK

ASTERUSDT // 30NOVBased on my six years of experience in the crypto market, I’ve observed that a project’s marketing efforts often play a crucial role in its growth. In this case, C.Z has managed the marketing strategy effectively, which helped the project remain resilient during broader market weakness and even establish new highs despite overall market stagnation.
At the moment, around the $1 zone, there is potential for another 30% corrective or speculative move, and a bullish scenario from the current area cannot be ruled out. However, considering the overall market uncertainty and the limited inflow of fresh capital, if price reaches the $1 target, it may be prudent to manage risk appropriately and secure the position to avoid unnecessary exposure.
This outlook remains conditional on market conditions and momentum, as broader liquidity still appears limited.

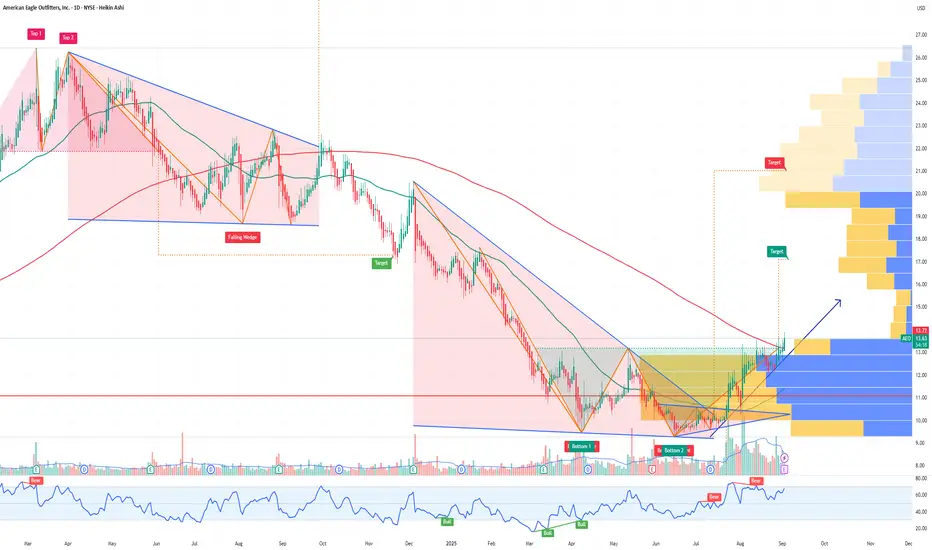
AEO American Eagle Outfitters Options Ahead of EarningsAnalyzing the options chain and the chart patterns of AEO American Eagle Outfitters prior to the earnings report this week,
I would consider purchasing the 15usd strike price Calls with
an expiration date of 2027-1-15,
for a premium of approximately $3.25.
If these options prove to be profitable prior to the earnings release, I would sell at least half of them.
ZS Zscaler Options Ahead of EarningsIf you haven`t bought ZS before the rally:
Now analyzing the options chain and the chart patterns of ZS Zscaler prior to the earnings report this week,
I would consider purchasing the 260usd strike price Puts with
an expiration date of 2026-1-16,
for a premium of approximately $11.75.
If these options prove to be profitable prior to the earnings release, I would sell at least half of them.

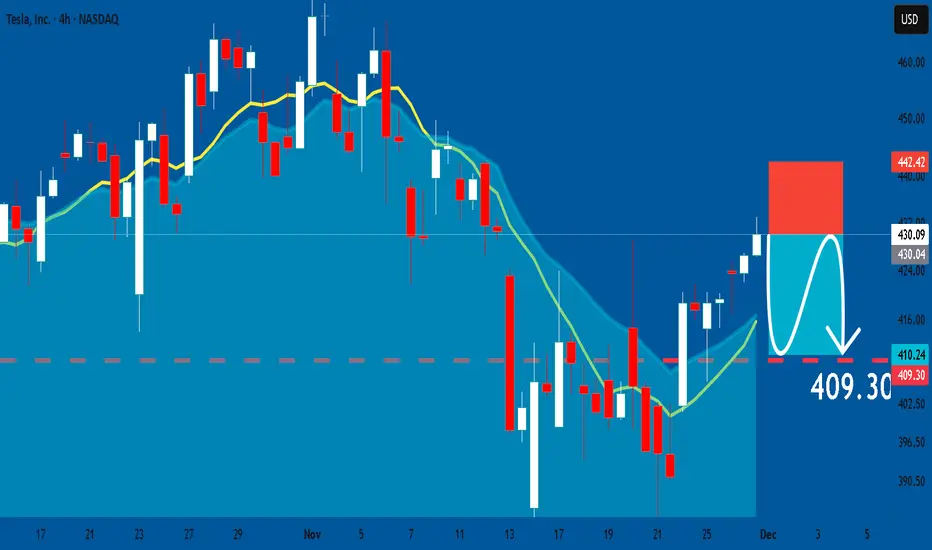
TESLA: Short Signal with Entry/SL/TP
TESLA
- Classic bearish setup
- Our team expects bearish continuation
SUGGESTED TRADE:
Swing Trade
Short TESLA
Entry Point - 430.09
Stop Loss - 442.42
Take Profit - 409.30
Our Risk - 1%
Start protection of your profits from lower levels
Disclosure: I am part of Trade Nation's Influencer program and receive a monthly fee for using their TradingView charts in my analysis.
❤️ Please, support our work with like & comment! ❤️
BTCUSDT.P - November 30, 2025The chart shows Bitcoin in a short‑term downtrend on the 15‑minute timeframe, with price consolidating in a tight range after a strong impulsive selloff, indicating corrective structure rather than a confirmed reversal yet. Resistance is clearly defined around 92,600–92,800 where prior selling pressure emerged, while immediate intraday support is clustered near 90,500–90,600, with a deeper support zone just below 90,000 acting as the invalidation area for the projected long setup. A break and 15‑minute close above the mid‑range resistance band around 91,200–91,300 would confirm bullish momentum and open the path for a trend‑continuation push toward the marked profit zone, whereas a failure there followed by a move back under 90,600 would favor another leg lower into the support block before any meaningful bounce.

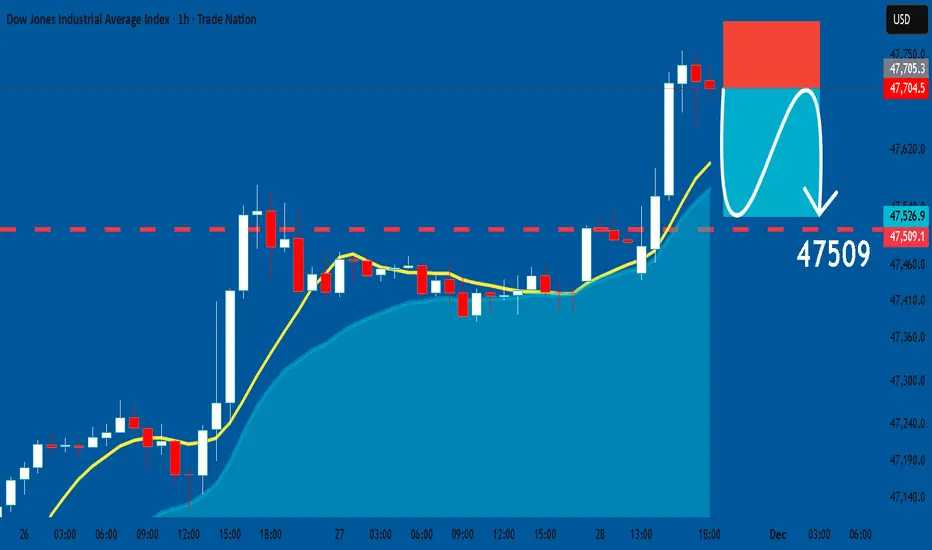
US30: Short Trade with Entry/SL/TP
US30
- Classic bearish formation
- Our team expects fall
SUGGESTED TRADE:
Swing Trade
Sell US30
Entry Level - 47705
Sl - 47798
Tp - 47509
Our Risk - 1%
Start protection of your profits from lower levels
Disclosure: I am part of Trade Nation's Influencer program and receive a monthly fee for using their TradingView charts in my analysis.
❤️ Please, support our work with like & comment! ❤️
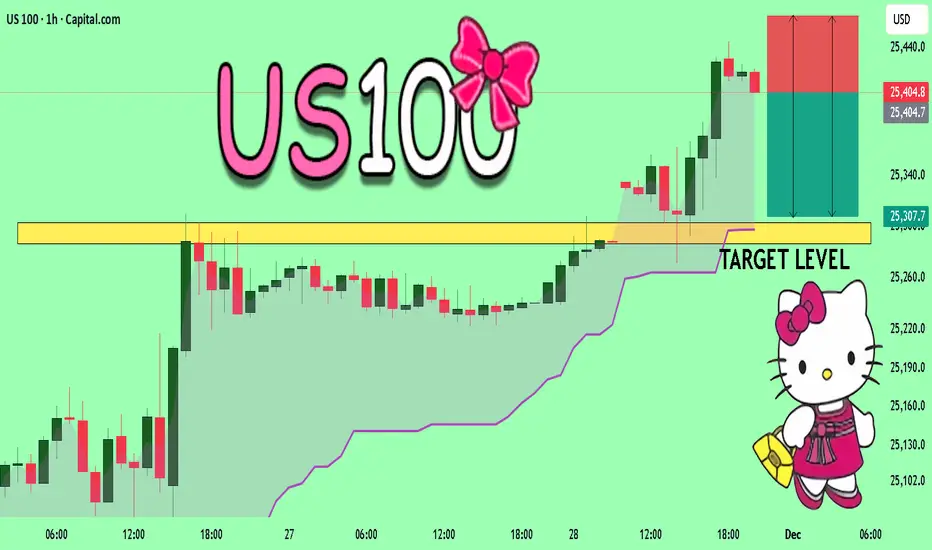
US100 Technical Analysis! SELL!
My dear followers,
I analysed this chart on US100 and concluded the following:
The market is trading on 25404 pivot level.
Bias - Bearish
Technical Indicators: Both Super Trend & Pivot HL indicate a highly probable Bearish continuation.
Target - 25303
Safe Stop Loss - 25465
About Used Indicators:
A super-trend indicator is plotted on either above or below the closing price to signal a buy or sell. The indicator changes color, based on whether or not you should be buying. If the super-trend indicator moves below the closing price, the indicator turns green, and it signals an entry point or points to buy.
Disclosure: I am part of Trade Nation's Influencer program and receive a monthly fee for using their TradingView charts in my analysis.
———————————
WISH YOU ALL LUCK
EURUSD A Fall Expected! SELL!
My dear subscribers,
EURUSD looks like it will make a good move, and here are the details:
The market is trading on 1.1596 pivot level.
Bias - Bearish
Technical Indicators: Both Super Trend & Pivot HL indicate a highly probable Bearish continuation.
Target - 1.1559
About Used Indicators:
The average true range (ATR) plays an important role in 'Supertrend' as the indicator uses ATR to calculate its value. The ATR indicator signals the degree of price volatility.
Disclosure: I am part of Trade Nation's Influencer program and receive a monthly fee for using their TradingView charts in my analysis.
———————————
WISH YOU ALL LUCK

QQQ Trading Opportunity! SELL!
My dear friends,
QQQlooks like it will make a good move, and here are the details:
The market is trading on 619.15 pivot level.
Bias - Bearish
Technical Indicators: Supper Trend generates a clear short signal while Pivot Point HL is currently determining the overall Bearish trend of the market.
Goal - 609.75
Recommended Stop Loss - 623.82
About Used Indicators:
Pivot points are a great way to identify areas of support and resistance, but they work best when combined with other kinds of technical analysis
Disclosure: I am part of Trade Nation's Influencer program and receive a monthly fee for using their TradingView charts in my analysis.
———————————
WISH YOU ALL LUCK

BTCUSDT.P - November 29, 2025Bitcoin is trading in a sideways range after a sharp rejection from the 92,900 resistance area, with intraday structure showing lower highs capping price under the 91,200–91,300 band.
A key support shelf sits around 90,200–90,400; holding above this zone could fuel a range breakout back toward 92,900, while a decisive close below it would confirm a bearish rotation and expose the lower support region near 89,000.

NZDCAD: Long Trading Opportunity
NZDCAD
- Classic bullish pattern
- Our team expects retracement
SUGGESTED TRADE:
Swing Trade
Buy NZDCAD
Entry - 0.8008
Stop - 0.8000
Take - 0.8021
Our Risk - 1%
Start protection of your profits from lower levels
Disclosure: I am part of Trade Nation's Influencer program and receive a monthly fee for using their TradingView charts in my analysis.
❤️ Please, support our work with like & comment! ❤️

GBPCAD Will Explode! BUY!
My dear followers,
This is my opinion on the GBPCAD next move:
The asset is approaching an important pivot point 1.8488
Bias - Bullish
Technical Indicators: Supper Trend generates a clear long signal while Pivot Point HL is currently determining the overall Bullish trend of the market.
Goal - 1.8551
About Used Indicators:
For more efficient signals, super-trend is used in combination with other indicators like Pivot Points.
Disclosure: I am part of Trade Nation's Influencer program and receive a monthly fee for using their TradingView charts in my analysis.
———————————
WISH YOU ALL LUCK

EURUSD: Long Trade Explained
EURUSD
- Classic bullish setup
- Our team expects bullish continuation
SUGGESTED TRADE:
Swing Trade
Long EURUSD
Entry Point - 1.1557
Stop Loss - 1.1547
Take Profit - 1.1577
Our Risk - 1%
Start protection of your profits from lower levels
Disclosure: I am part of Trade Nation's Influencer program and receive a monthly fee for using their TradingView charts in my analysis.
❤️ Please, support our work with like & comment! ❤️

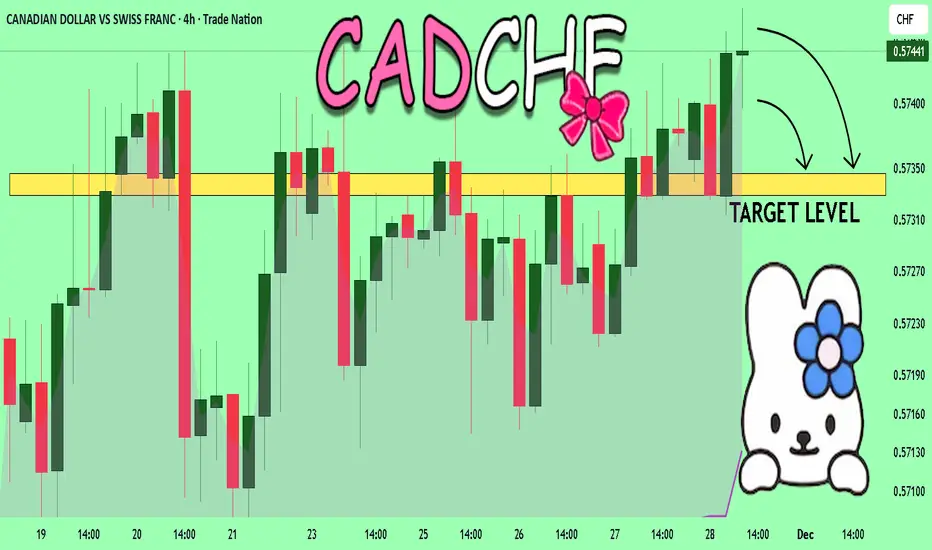
CADCHF What Next? SELL!
My dear friends,
Please, find my technical outlook for CADCHF below:
The instrument tests an important psychological level 0.5744
Bias - Bearish
Technical Indicators: Supper Trend gives a precise Bearish signal, while Pivot Point HL predicts price changes and potential reversals in the market.
Target - 0.5734
About Used Indicators:
Super-trend indicator is more useful in trending markets where there are clear uptrends and downtrends in price.
Disclosure: I am part of Trade Nation's Influencer program and receive a monthly fee for using their TradingView charts in my analysis.
———————————
WISH YOU ALL LUCK
GOLD Sellers In Panic! BUY!
My dear friends,
Please, find my technical outlook for GOLD below:
The price is coiling around a solid key level - 4164.3
Bias - Bullish
Technical Indicators: Pivot Points Low anticipates a potential price reversal.
Super trend shows a clear buy, giving a perfect indicators' convergence.
Goal - 4176.6
Safe Stop Loss - 4157.5
About Used Indicators:
The pivot point itself is simply the average of the high, low and closing prices from the previous trading day.
Disclosure: I am part of Trade Nation's Influencer program and receive a monthly fee for using their TradingView charts in my analysis.
———————————
WISH YOU ALL LUCK

GOLG SMC BUY IDEA 4160 DEMAND ZONE📌 SMC Buy-Side Idea (XAUUSD) — Entry 4160
Bias: Bullish
Timeframe: 15m
🔍 Market Structure
Market has broken previous structure with a clean BOS, confirming bullish order flow.
Price retraced back into the 15m Demand Zone (IDM).
4160 is sitting inside discount pricing, aligned with HL formation.
🟦 Entry Plan
Buy Limit: 4160 zone (inside 15m Demand)
Stop Loss: Below HL / Below the demand rejection
Take Profit: Three partial exits
🎯 Targets (3-Stage TP Distribution)
TP1: 4175
TP2: 4185
TP3 (Final): 4200
💡 Why Buy at 4160?
4160 = Perfect discount level
Confluence with 15m demand + IDM
Bullish BOS already printed
Liquidity above HH targeting 4200
📈 Expectation
If bulls defend 4160 demand, price should move toward 4175 → 4185 → 4200, sweeping all buy-side liquidity.

BTCUSDT.P - November 28, 2025Bitcoin is in a short‑term uptrend, riding a rising trendline after breaking out from prior consolidation and now pressing into a well‑defined resistance band around 92,100–92,600.
The chart outlines a tactical long setup with support around 90,100–90,200 as the key pivot; holding above this zone favors continuation toward the higher resistance/target region near 94,500–95,000, while a clean break back below the trendline would invalidate the bullish structure and open room for a deeper pullback.

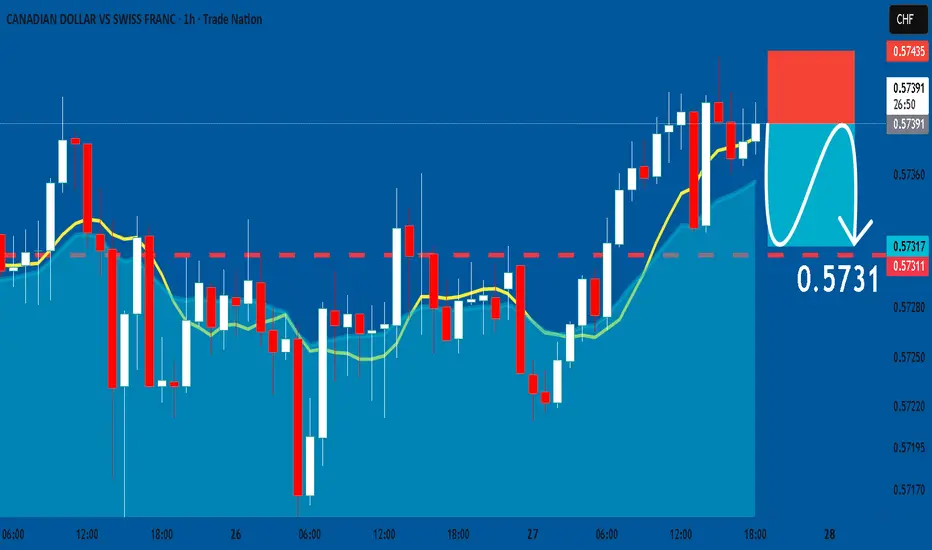
CADCHF: Bearish Continuation & Short Signal
CADCHF
- Classic bearish formation
- Our team expects pullback
SUGGESTED TRADE:
Swing Trade
Short CADCHF
Entry - 0.5739
Sl - 0.5743
Tp - 0.5731
Our Risk - 1%
Start protection of your profits from lower levels
Disclosure: I am part of Trade Nation's Influencer program and receive a monthly fee for using their TradingView charts in my analysis.
❤️ Please, support our work with like & comment! ❤️
AUDJPY Trading Opportunity! BUY!
My dear followers,
I analysed this chart on AUDJPY and concluded the following:
The market is trading on 100.92 pivot level.
Bias - Bullish
Technical Indicators: Both Super Trend & Pivot HL indicate a highly probable Bullish continuation.
Target - 101.16
Safe Stop Loss - 100.81
About Used Indicators:
A super-trend indicator is plotted on either above or below the closing price to signal a buy or sell. The indicator changes color, based on whether or not you should be buying. If the super-trend indicator moves below the closing price, the indicator turns green, and it signals an entry point or points to buy.
Disclosure: I am part of Trade Nation's Influencer program and receive a monthly fee for using their TradingView charts in my analysis.
———————————
WISH YOU ALL LUCK

CADJPY Will Collapse! SELL!
My dear followers,
This is my opinion on the CADJPY next move:
The asset is approaching an important pivot point 111.45
Bias - Bearish
Safe Stop Loss - 111.62
Technical Indicators: Supper Trend generates a clear short signal while Pivot Point HL is currently determining the overall Bearish trend of the market.
Goal - 111.13
About Used Indicators:
For more efficient signals, super-trend is used in combination with other indicators like Pivot Points.
Disclosure: I am part of Trade Nation's Influencer program and receive a monthly fee for using their TradingView charts in my analysis.
———————————
WISH YOU ALL LUCK
