$CRON - Short Term BullishShort term bullish if technical break of long term apex with high vol
MACD curling
Entry @ $8.00
Stop loss @ $7.50
Exist @ 9.20
Macdcross

BTCUSD 4H MACD TREND FOLLOWING STRATEGYStep #1: Wait for the MACD lines to develop a higher high
followed by a lower high swing point.
The first rule of thumb to recognize a swing high on the MACD indicator is to look at the price chart if the respective currency pair is doing a swing high the same as the MACD indicator does.
A higher high is the highest swing price point on a chart and must be higher than all previous swing high points. While a lower high happens when the swing point is lower than the previous swing high point.
Step #2: Connect the MACD line swing points that you have identified in
Step #1 with a trendline
At this point, we really ignored the histogram because much of the information contained by the histogram is already showing up by the moving averages.
Look at the price action now and compare it to our MACD trendline we drew early. We can clearly notice that the MACD contains the price action much better and reflects the trend much clear.
Step #3: Wait for the MACD line to break above the trendline. (Entry at the
market price as soon as the MACD line breaks above)
When the MACD line (the blue line) crosses the signal line (the orange line) it’s an early signal that a bullish trend might start. However, if trading would be that easy we would all be millionaires, right? And that’s the reason why our MACD Trend Following Strategy is so unique.
We’re not only waiting for the MACD moving averages to cross over but we also have our other criteria for the price action to break aka the trend line we drew early.
This is a clever way to filter out the false signals, but you have to be equipped with the right mindset and have patience until all the piece of the puzzle come together. If you were to trade just based on the MACD crossover over time you’ll lose money because that’s not a reliable strategy. But if you use the MACD indicator along with other criterias such what this strategy tells you to do, you will find great trade entries on a consistent basis.
Step #4: Use Protective Stop Loss Order. (Place the SL below the most
recent swing low)
Now, that you already know how to enter a trade at this point you have to learn how to manage risk and where to place the SL. After all, a trader is basically a risk manager.
You want to place your stop loss below the most recent low.
A good entry price means a smaller stop loss and ultimately it means you’ll lose a lot less comparing it with the profit potential, so a positive risk to reward ratio.
Step #5: Take Profit when the MACD crossover happens in the opposite
direction of our entry
Knowing when to take profit is as important as knowing when to enter a trade. However, we want to make sure we don’t use the same trading technique as for our entry order. When the MACD line (the blue line) crosses the signal line (the orange line) we want to close the position and take full profits.
Before taking profits, it’s important to wait for the candle close – either the 4h or the daily candle – depending on the time frame you trade so you make sure the MACD crossover actually happens.
Note** The above was an example of a buy trade using the MACD Trend Following Strategy.
Use the exact same rules – but in reverse – for a sell trade.

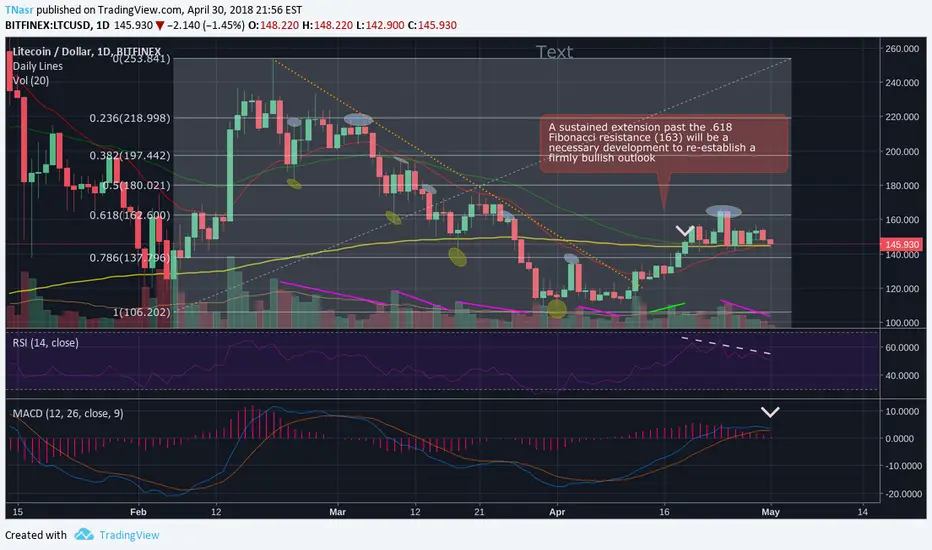
Litecoin... running on fumesThe importance of Fibonacci support and resistance levels cannot be overstated. Look Carefully and you will find 13 instance from Mar. 22 until present in which they have served as support and resistance levels for LTC within a few dollars in most instances and near perfectly in others. Right now I am worried about LTC in the short term for a few simple reasons. The coin has been oscillating between the 0.786 and 0.618 bands with the 0.618 serving as string resistance. Short term I am bearish for three simple reason:
1) Within this Fibonacci band we can see what I believe to be mild negative divergence on the RSI marked with a dashed white line
2) There is a bearish volume pattern denoted by the leftmost downward sloping magenta line on the graph, preceded by and upward sloping green one, which is preceded by several downward sloping magenta lines which show a pattern.
3) Though the 'death cross' where the 50 day moving average crosses the 200 day never happened (I believe some analysts say it did and the graph does not support that) we are witnessing an imminent crossover as far as MACD is concerned denoted by a downward facing white arrow at the bottom of the shot. Look carefully at the last time this happened and you can see why I am very concerned short term.
If you found this info useful please give a thumbs up. If you disagree your comments are welcome so long as you provide evidence to support your position and you are constructive. Thanks for reading!
#MU Buy Signal with over 50 % fast upside potential- macd daily buy Signal
- over 50 % upside potential
- fast Price movemend expected bexcause
max pain of short sellers

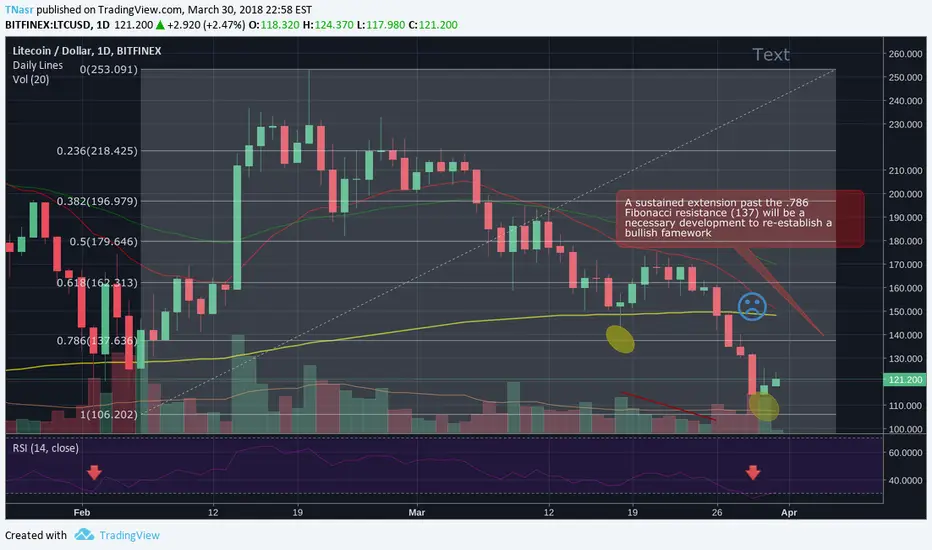
LTC... not out of the woods yetDear all! In my last post (LTC... still teetering April 8) I noted that LTC has shown no clear direction up or down but that a recent pattern of price movement does not bode well. I think according to technical indicators this may have changed though direction is still not clear. We have recently seen some bullish indicators manifest. Specifically there has been a bullish MACD crossover (denoted with a downward pointing arrow) and a notable bullish divergence as far as RSI is concerned (denoted with a dashed white line, above MACD and below the chart) but LTC is NOT out of the woods yet from a Technical Analysis perspective.
For context please note that you are looking at candlesticks, each representing one day in a chart whose scope is just over 2 months. From the chart we can see 4 (highlighted by yellow ellipticals) instances where Fibonacci levels served as support; but were subsequently broken to the downside, and 6 (in light blue) which have served as resistance. I will not focus on the Fibonacci tool in this write up as we are too far away from the most meaningful levels. Instead I want to focus on volume.
LTCs price behavior, like may coins, may depend on that of Bitcoin but in the most recent leg up LTC has been lagging; your guess is as good as mine as to why and this could easily change in the future, look at the run up from Feb. 6 to the 20th for example. Following from the first paragraph above we are not out of the woods yet. This is for several reasons. In the most current run up we broke a downward sloping resistance line but this is the first of four hurdles to clear with the 50 and 20-day moving averages and the .786 Fibonacci still overhead. If and when we break them volume on any such move will also be important because per 4 downward sloping magenta lines at the bottom of the chart we have seen decreases in volume (after an initial upward pop) leading to decreases in price and I'm concerned this pattern may repeat itself. Please look carefully at two white downward facing arrows within the chart (similar to the arrow in the MACD box). VOLUME validates the strength and authenticity of price moves in any direction and we have already seen higher than recent volume on an upward move on Mar. 9 which did not lead to a trend reversal so I am concerned that the volume in the most recent pop (second white arrow/ April 12) is not sufficient enough for a trend reversal as well.
Within the current levels as long as we don't dip below 106 (the start of Fibonacci levels) an argument can be made for being neutral. Also note the 50 day MA is slowly converging towards the 200 at the point of the sad face but I don't think they will necessarily inevitably meet plus remember that MACD has shown a bullish crossover if only with respect to shorter time frames. In my last post I wrote "Long term, and potentially in as little as under a month this bear market could be over and we will be headed up but the technicals have to show us evidence of that." and technicals are beginning to show just that but VOLUME is a concern. If you find this info useful please give this post a thumbs up. Lastly I want to emphasize the importance of studying contrarian views to your own. If you are long any given coin study short opinions and vice-versa, also be flexible and willing to change your mind, be like water.

Litecoin And Classical Charting - No Elliott Waves. Promise!Hello Dear Friends! :)
Today we are gonna look at only classical charting, and try to identify the different patterns. This is an educational chart - I hope you will enjoy it!
Let's start from the left:
1. Bear Flag (Steep downtrend, followed by a small consolidation to the upside, and then another steep downtrend)
2. Broadening Ascending wedge (bearish pattern)
3. Down Channel
4. Ascending Triangle (bullish pattern)
5. Symmetrical Triangle (neutral)
6. Another Bear Flag
7. Ascending wedge (bearish pattern)
8. Bullish MACD-Cross (When the blue line crosses the orange, which means that the bulls are gaining momentum)
9. RSI - Regular Bullish Divergence (The price is making lower lows, but the RSI is making higher lows, which means, that we are about to end our downtrend and will go into a reversal)
Can you find other patterns?
D4 Loves You <3
Please leave a LIKE for this alternative educational post :)

BTC approaching the end of the descending triangleAfter exiting a 40 days long falling wedge on April 8th we had a 4 day sideways trading before today's breakout. Even though we've seen a spike today all the way from 6940 to 8100 in less than 45 minutes, we have to keep in mind that we're still in the long term downtrend that is pointing towards support zone around 6500. Stochastic RSI also alerts us to be cautious as it's in overbought zone.
MACD has crossed and it's pointing upwards which is indeed a bullish sign especially after BTC touched the bottom for the second time. For those of you who might be fresh in the world of trading, double bottom is a bullish pattern that is a strong signal of the coming uptrend.
Market is very unpredictive nowadays and it's hard to say anything, but it's clear that we're in a pretty big descending triangle which is a bearish pattern. The triangle will culminate on April 27th. I have to point out though that we might exit the triangle at any point before this date. In order to go up we will need a huge volume followed by some extremely bullish news so there is not much we can do but stay alert and keep trading within the descending triangle.
Make sure to visit WhyCrypto.co.uk for more info and the most advanced ICO analyses on the market.

ROAD TO THE GOLDEN LITECOINHi guys,
I needed to do that analysis to share with you a great opportunity.
The ABC correction is about to end soon. As you can see on the chart, we have a double-bottom forming. While LTCUSD is stagnating, RSI indicates a nice bullish divergence coming. MACD also confirms that move as the green line crossed the red.
In a short-term we should retest the falling wedge support to go to $137 significant support. If the bullish move is strong, we could recover $160 where we could find our Fibonacci middle support.
That was a short and brief analysis, hope you enjoyed, whatever you think you can agree, comment or follow to see my next analysis.
Have a nice Sunday ! ;)

(PIVX) - PIVX - Stable Upward Trend - 270 % Possible EarningsHi our dear family!
Almost every coin goes down but we have a exception for you.
Stable upward trend since middle of the March 2018. WOW!
Another coin (after Zencash) which is growing slowly but surely. Coincidence? Don't think so.
PIVX stands for Private Instant Verified Transaction. PIVX is an anonymity-based cryptocurrency created out of a fork of DASH. However, instead of using Proof-of-Work (PoW), it uses a custom Proof-of-Stake (PoS) system. This means that PIVX cannot be mined but you may earn a reward by staking it in your online wallet.
PIVX inherited all the technical features of DASH such as masternodes, instant send and private transfer. It has a block time of 60 seconds and has a fixed reward size per block that uses a custom Seesaw Algorithm that dynamically alters the reward split between masternode and staking nodes.
They base on the community developers and have decent market cap which is right now around 200 mln $. Nice.... Isn't it?
They have strong development team on coingecko (rating 79%) which is close to Quantum, Digibyte and Ethereum Classic.
Quite big number of followers on Twitter (over 60k) and still growing.
We think this might be one of the few coins which will grow in stable way for next couple of weeks.
Here are some technical analisys details:
Postivie MACD convergence
Growing volume = growing interest
SMA6 crossed SMA20 = bull's cross
ABC Elliot Waves pattern finished - 1,2,3,4,5 Elliot Waves paterrn started heading to 3
According to Trend Based Fib. Extension we are very low heading to first target at 66 000 st
Fibonacci Levels:
1. 0.00066000
2. 0.00083183
3. 0.00097500
4. 0.00111170
5. 0.00130000
6. 0.00156500
Stop-loss 0.00040000
Let's keep an eye on this coin as we may earn some good money in such unstable moment.
Stay in touch!
HUGE thanks for your support, likes and comments!
Don't forget to look at the rest of our analysis sharing your ideas and remarks.
Remeber you are A W E S O M E.
HUGS!
Your WBM_Team

What is the 'Moving Average Convergence Divergence - MACD'Introduction
Developed by Gerald Appel in the late seventies, the Moving Average Convergence/Divergence oscillator (MACD) is one of the simplest and most effective momentum indicators available. The MACD turns two trend-following indicators, moving averages, into a momentum oscillator by subtracting the longer moving average from the shorter moving average. As a result, the MACD offers the best of both worlds: trend following and momentum. The MACD fluctuates above and below the zero line as the moving averages converge, cross and diverge. Traders can look for signal line crossovers, centerline crossovers and divergences to generate signals. Because the MACD is unbounded, it is not particularly useful for identifying overbought and oversold levels.
Note: MACD can be pronounced as either “Mac-Dee” or “M-A-C-D.”
Moving average convergence divergence (MACD) is a trend-following momentum indicator that shows the relationship between two moving averages of prices. The MACD is calculated by subtracting the 26-day exponential moving average (EMA) from the 12-day EMA. A nine-day EMA of the MACD, called the "signal line", is then plotted on top of the MACD, functioning as a trigger for buy and sell signals.
BREAKING DOWN 'Moving Average Convergence Divergence - MACD'
Moving average convergence divergence (MACD) indicators can be interpreted using three different methods:
1. Crossovers - As shown in the chart above, when the MACD falls below the signal line, it is a bearish signal, which indicates that it may be time to sell. Conversely, when the MACD rises above the signal line, the indicator gives a bullish signal, which suggests that the price of the asset is likely to experience upward momentum. Many traders wait for a confirmed cross above the signal line before entering into a position to avoid getting getting "faked out" or entering into a position too early, as shown by the first arrow.
2. Divergence - When the security price diverges from the MACD, it signals the end of the current trend. For example, a stock price that is rising and a MACD indicator that is falling could mean that the rally is about to end. Conversely, if a stock price is falling and the MACD is rising, it could mean that a bullish reversal could occur in the near-term. Traders often use divergence in conjunction with other technical indicators to find opportunities.
3. Dramatic Rise - When the MACD rises dramatically - that is, the shorter moving average pulls away from the longer-term moving average - it is a signal that the security is overbought and will soon return to normal levels. Traders will often combine this analysis with the Relative Strength Index (RSI) or other technical indicators to verify overbought or oversold conditions.
Traders also watch for a move above or below the zero line because this signals the position of the short-term average relative to the long-term average. When the MACD is above zero, the short-term average is above the long-term average, which signals upward momentum. The opposite is true when the MACD is below zero. As you can see from the chart above, the zero line often acts as an area of support and resistance for the indicator.

Litecoin is at an inflection point!Dear all, Litecoin seems to be at an inflection point for multiple reasons. I'll explain. First for context please note you are looking at daily candlesticks in a chart whose scope is a little bit more than 2 months. The Fibonacci levels are determined from the run that started on Feb. 6 and ended on Feb .20. On Mar. 18 we saw LTC retrace to the .786 (in the first yellow elliptical) which served as perfect support and we subsequently witnessed a bounce. However in this bear market LTC fell further as we saw volume consistently decrease (denoted by a red downward sloping line).
Very recently we saw LTC retrace to within 3 dollars of the Feb.6 start of the run (denoted by the second yellow elliptical); if we break 106 we are probably headed down more. One moderately bullish development is that RSI is showing that LTC is oversold (denoted by a red arrow) which may provide some upward momentum. The last time RSI was at this level (first red arrow) we saw a sustained break to the upside. One bearish development that almost seems imminent is the 'death-cross' of the 50 day moving average nearly breaking below the 200 day, denoted by a sad face.
I entered LTC recently in the teens and am looking to sell in the low to mid 130's with a view to the .786 serving as resistance. If however LTC increases with volume I may hold longer. I want to emphasize the importance of studying contrarian views to your own. If you are long any given coin study short opinions and vice-versa, also be flexible and willing to change your mind, be like water.
Basic EW count : A retest of Fibonacci 0.618 ? Only a quick update of my precedent chart.
I think every informations are in the chart. If bulls can't maintain BTC above 10k we will probably retest our precedent Fibonacci support with possible extended wave. The green zone is a buyback opportunity, i expect a rise to a minimum of13000$ area after this where traders will probably take some huge profit.
You can see on the 4H MACD both positive and negative divergence (lower highs and higher lows) which shows that the correction could soon be over if the triangle is not breakdown), 4H RSI shows the possibility of the continuation of lower highs but doesn't confirm the bullish divergence of MACD.
MACD is ready to cross and the volume of the wave 5 is exponential.
As always i'm not a financial advisor, i do chart for my personal entertainment and trading. Do your own research, good luck everyone !

yum Looking quite bearishI'm pretty bearish on yum displaying many bearish signs. first target for me will be around 77.70 with max low targets around 74-72

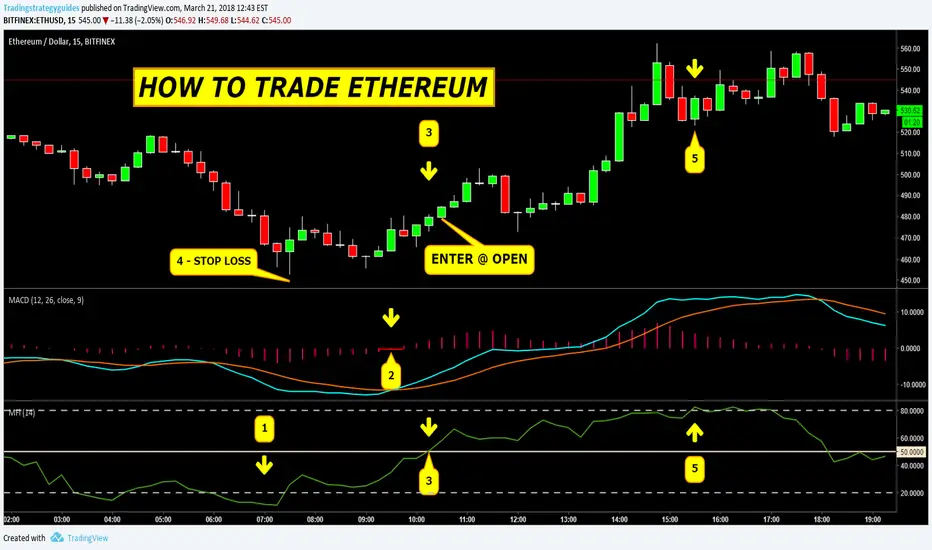
HOW TO TRADE ETHEREUMEthereum Trading Strategy
All we need for this trading strategy is two technical indicators:
The MACD – This is a momentum indicator that can help us spot a trend.
The MFI or the Money Flow Index an overlooked but critical technical indicator that measures the money flow into or out of a cryptocurrency.
The MACD is one of the most common indicators used by traders around the world in a variety of different markets to spot trades before they happen.
The MFI indicator is based on price action and it incorporates Volume in its calculation, which is quite similar to other oscillators. In other words, we can use the MFI indicator to measure buying and selling pressure.
We can use the MFI indicator to trigger entries and to take profits.
The easiest way to interpret the MFI indicator is that a reading above the 50 level represents an inflow of money into the cryptocurrency, while a reading below the 50 level represents an outflow of funds from the cryptocurrency.
The other critical MFI thresholds are 20 and 80. An MFI reading of 20 is considered bullish and oversold while a reading above the 80 level is considered bearish and overbought.
Step #1: Wait until the Money Flow Index drop below the 20 level
The first rule is that you always want to wait for the Money Flow Index to be in oversold territory. In other words, we need to have an MFI reading below the 20 level.
An extreme MFI reading below 20 suggests that there is very heavy money outflow from Ethereum. As history has repeatedly shown, this information can be used as a contrarian indicator.
The MFI indicator is not a standalone indicator. There are plenty of good cryptocurrencies that have high MFI reading, and most bad ones have low MFI reading.
So, in order to use the MFI indicator, we need to check it against other technical indicators which are the reason why we also use the MACD indicator.
Step #2: Wait for MACD histogram to break above the zero level
The second rule is to wait for the MACD histogram to turn positive. This is a confirmation that the bullish momentum is starting to build up. Now, we have two rules in place, but these are still not enough to trigger an entry.
Indicator-based strategies are very unpredictable which is the reason why we’ve added another confirmation signal before to enter and buy Ethereum.
Now, we’re going to lay down a straightforward entry technique for Ethereum trading system.
Step #3: After MACD turned positive, Buy after MFI also breaks above the 50 level.
As an extra measure of caution, we also like to wait for the MFI indicator to break above the 50 level before to buy Ethereum.
A reading above the 50 level represents an inflow of money into Ethereum which is the moment when smart money is stepping into the market. We want to trade alongside smart money to really make a profit trading the cryptocurrency market.
Step #4: Place Protective Stop Loss below the Previous Swing low
In order to minimize our potential loss we want to place our protective stop loss very close to the market price but at the same time at a price where it should really invalidate our trade signal.
For the Ethereum strategy, the ideal place to hide the stop loss is just below previous swing low. You can always add a buffer to protect yourself in case of a false breakout.
Step #5: Take Profits when the MFI enters Overbought territory or above the 80 level
When it comes to our Ethereum take profit trading strategy we want to cash some profits at the first sign that the market is about to turn against us. Otherwise, we risk given back some of our hard earned gains.
The first indication that the market is about to turn is when the Money Flow Index enters into overbought territory. In other words, when the MFI breaks above 80 levels, we take profits.
Use the same rules for a SELL trade – but in reverse.
Ethereum has fundamental advantages that hopefully will help Ethereum price suppress Bitcoin in the coming years.
EURUSD 15M long | morning Star Patterntrade entry triggered
Candle Pattern: morning Star
Trend: up
Trend Entry: with
TP/SL Ratio Target: 2 to 1
Target TP PIPs: 40
SL PIPS: 20
Fib Entry: .764
Fib TP: .50
Stochastic: over-sold
MACD Histogram: contracting up
200SMA: below
BB: n/a
Pivot Point: S1
Elliot Wave:
currently at point B in the elliot wave correction after a downside elliot wave move.
Looking for the completion of point C around point A
Notes:
moening star formed around the .764 level and and S1 pivot point
stochastic showing oversold
macd histogram showing momentum slowing to the downside. Crossover just happened
TP Goal around 40 pips but will let it ride as far as possible to point A
What can go wrong:
since price is below 200SMA, price could continue to the downside making the elliot wave correction invalid. Would have to re-evaluate the elliot wave for a new recount.

Possible BTC recovery signs??BTCUSD : DAILY
Are we seeing a the clouds clear up??
If we fill out all of these scenarios we may see some serious recovery happen over the next month as we approach the tip of this wedge.
I am seeing a Head and Shoulders pattern possibly fill out here pending some ideal conditions:
- Stoch RSI double bounce, cross, and separation due to oversold condition signaling bullish movement upward.
- RSI staying above or bouncing off of 32 level and increasing strength into the bullish zone.
- And most ideally, a MACD crossover as close to, if not on, the Zero line. I see this consistently, MASSIVE bullish movement after a MACD cross ON the zero line.
Oooooofffff course....... it could very well break out below the wedge, but that's not a happy thought. Plus I prefer to make rockets on my charts, not missiles =)
The price might bounce off of the $7510 resistance, but will likely hit the $6950 to $7000 range before it begins recovery, this is kissing the current trend line as well as a strong resistance intersection point.
Assuming these conditions are met and the price doesn't jump off of a cliff, we need to see some consistent closes above previous resistance lines, and hopefully we will see a positive breakout of the wedge come end of March or beginning of April.
However, if it drops below that trend line, the next identified support is at the $6100 to $6200 range. Fingers crossed that I will not have to reevaluate due to those conditions.....
I seriously put a lot of work into my rocket.
-Spreck
Standard disclaimer: This is not financial advice, just ramblings of some dude that likes looking at, and drawing on graphs.

:: Revised :: Possible BTC recovery signsTo attempt to seem not 100% stupid, i'm addressing my Head and Shoulders screw up.
Still new to the game and for whatever reason decided that was a head and shoulders pattern. Identified upon posting that it obviously was not (I swear I know better), so I want to address it and repost before I begin getting the "Hey dummy, what you got the tiniest head on earth" comments...
Are we seeing a the clouds clear up??
If we fill out all of these scenarios we may see some serious recovery happen over the next month as we approach the tip of this wedge .
I am seeing a possible break out pending some ideal conditions:
- Stoch RSI double bounce, cross, and separation due to oversold condition signaling bullish movement upward.
- RSI staying above or bouncing off of 32 level and increasing strength into the bullish zone.
- And most ideally, a MACD crossover as close to, if not on, the Zero line. I see this consistently, MASSIVE bullish movement after a MACD cross ON the zero line.
Oooooofffff course....... it could very well break out below the wedge , but that's not a happy thought. Plus I prefer to make rockets on my charts, not missiles =)
The price might bounce off of the $7510 resistance, but will likely hit the $6950 to $7000 range before it begins recovery, this is kissing the current trend line as well as a strong resistance intersection point.
Assuming these conditions are met and the price doesn't jump off of a cliff, we need to see some consistent closes above previous resistance lines, and hopefully we will see a positive breakout of the wedge come end of March or beginning of April.
However, if it drops below that trend line , the next identified support is at the $6100 to $6200 range. Fingers crossed that I will not have to reevaluate due to those conditions.....
I seriously put a lot of work into my rocket.
-Spreck
Standard disclaimer: This is not financial advice, just ramblings of some dude that likes looking at, and drawing on graphs.

Lockheed Martin - Evening Doji Star IdeaPossible further decline due to the evening doji star setup and the MACD cross. Could be affected by Trump - Lockheed Martin related news.

DGD - Up or Down. What will it be BTC?Soooo. Which direction will it be. Usually the pennant should resume the uptrend. But as always... BTC will probably dictate the impulse. IF we go up, we SHOULD get a MACG crossing upwards on the 4hr chart. And then...Booom. Crossing fingers.

Don't get high on your own supply-Huge news for Tweed getting go ahead on 1.3 M sq ft greenhouses in BC
-Rec. stores in Manitoba
-Speculation of NASDAQ listing
-Increasing bullish volume on the daily chart
-Bullish MACD cross
-Could be a "laggard" to MJN??
-Currently holding WEED overnight and hoping for a significant gap up, causing RSI levels to get to extreme highs on the hourly and shorter timeframe charts. IF this happens, I'll look to sell (likely right at open) and re-buy in (looking for a possible bounce off the $30.00 lvl) using 1/5 min chart RSI indication for an oversold bounce right after exiting. Lets hope this is the start of a very nice break out to, dare I say, all time highs???

UPDATE: Win on Litecoin vs Bitcoin now! Trade OPEN! (LTCBTC)Dear Friends!
- Descending Wedge
- Inverse HS pattern has created and can help us even higher
- Remember to put a stop loss. Under the EMA200 for instance.
- Bullish MACD-cross
We are good to go!
D4!

XRPUSD 1H TREND FOLLOWING STRATEGYThis trade is from our free pdf "MACD TREND FOLLOWING STRATEGY"
PM me if you have any questions, I will be happy to help.

Will BTC retest the yearly 0.618 Fib level?Inverted head and shoulders pattern showing bullish bias and potential retest of 0.618 in next week
Triple waves pattern also confirms a potential retest of 0.618 level in next week according to the angles and lengths of previous waves
RSI levels are showing signs of overselling -> might indicate a reversal in short term as both 4h and weekly charts show this
MACD levels are confirming the bearish trend with likely zero crossover to come
Conclusion:
we might see BTC 3.01% range 7500 - 9500 again in the next 1-2 weeks depending on which pattern dominates
