HSI is on fire? tapping on fire horse? Happy New Year everyone!
May the joy continues spreading from the festive season for this year.
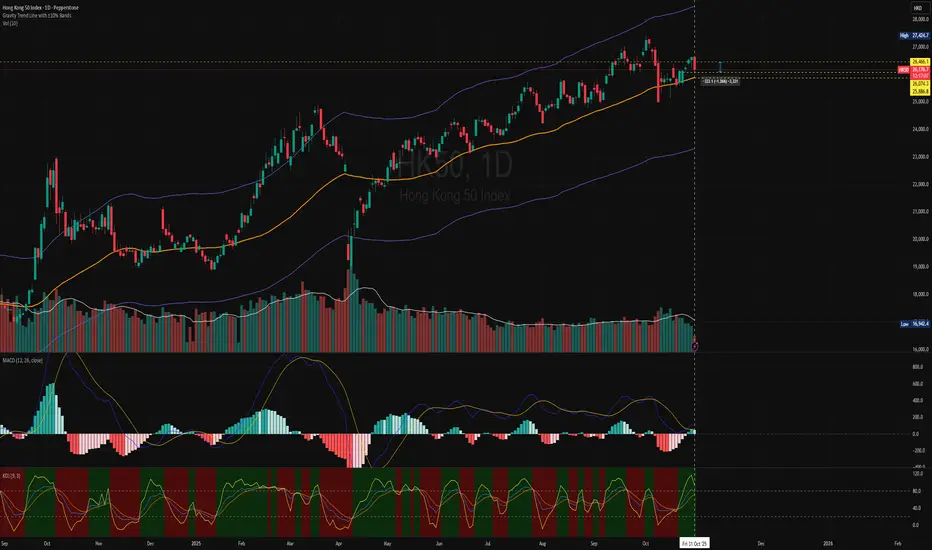
HSI had closed the year with a +27.77% ; ~5500+pts this has outperformed:-
S&P500 (i.e +16.39%; +963.87)
Nasdaq (i.e +20.17%; +4,237.67)
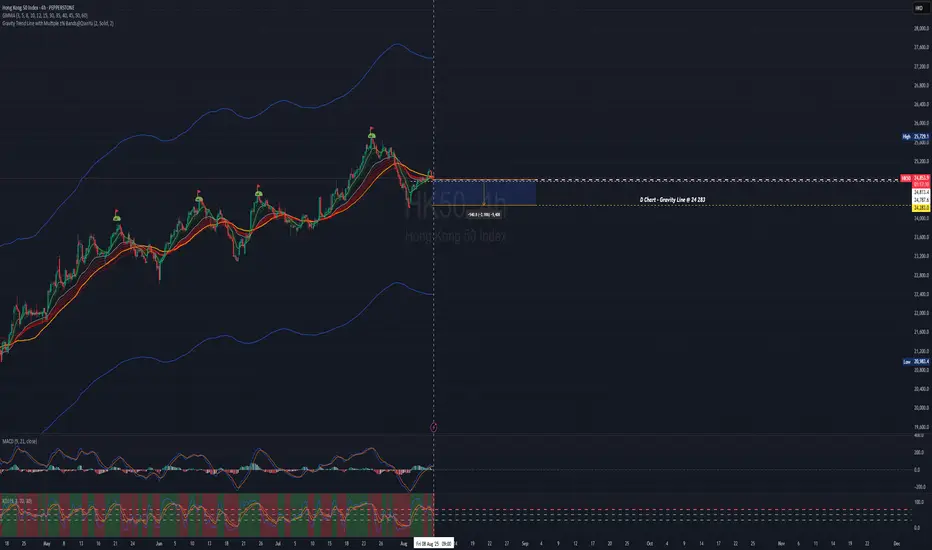
HSI kick-started the year with a rally with +700pts on the first trading day. A positive sign for the year.It will again move above the Gravity Trend Line (GTL) in 2026.
Also breaking out the sideway box and we shall monitor closely if this is consistent.
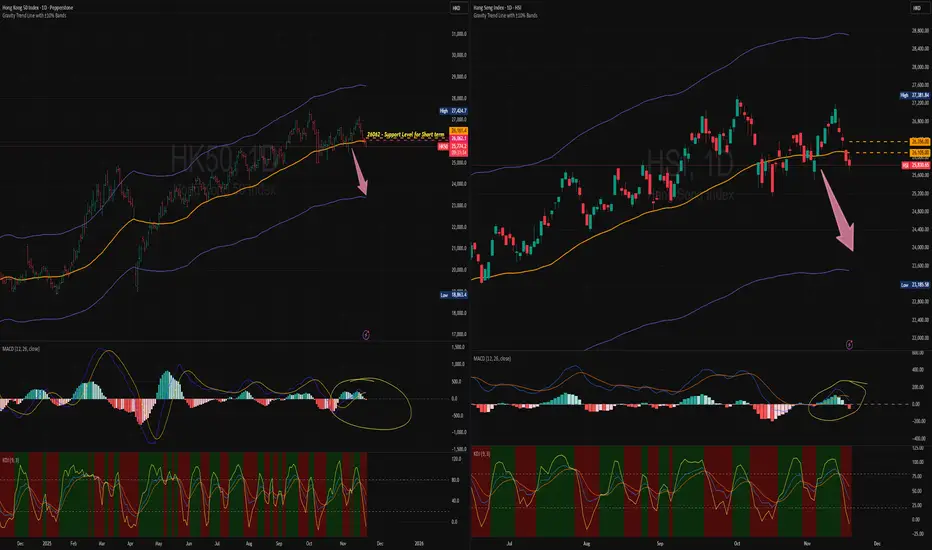
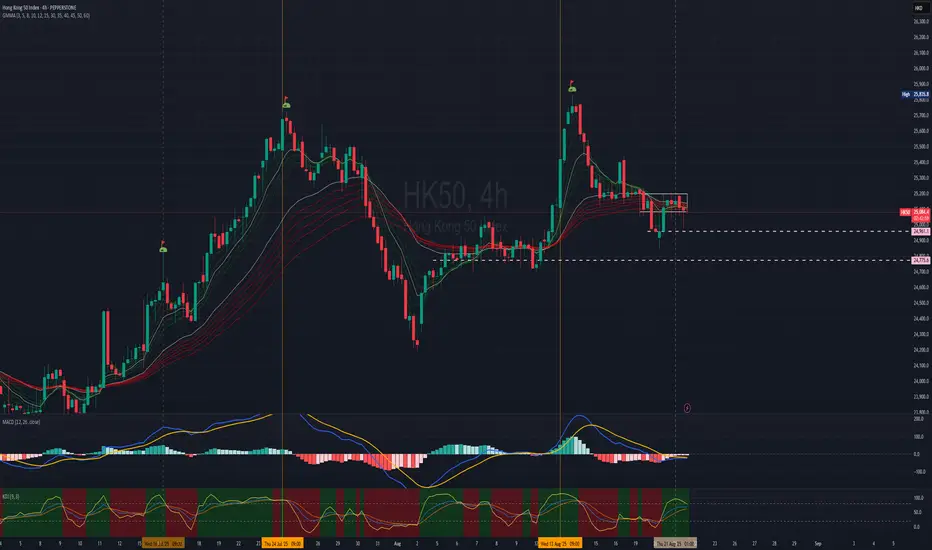
This week the Index likely to try testing the resistance level of 27381. This is supported by the MACD is crossing above ‘0’ level for D chart since late Nov’25.
For short-term - retracement is inevitable ; it should trade between the range of 26050 (D GTL) - 26570. If it breaks above 27381 and it’s likely to break as it has been retested for the 3rd time.
This could charge up to 27500 - 28670. The Index is going to continue to be Bullish.
📌 QUICK DECISION MAP (HSI HSI:HSI /HK50 PEPPERSTONE:HK50 FX:HKG33 )
Price Location Market Meaning Bias Primary Action
Above 27188 Trend acceleration Strong bullish Hold / add on shallow pullbacks
26700 – 27188 Bullish continuation Bullish Buy dips, trail stops
26050 – 26700 Trend under pressure Neutral → Bearish Reduce size, defensive trades
25090 – 26050 Trend failure Bearish Short rallies / stay in cash
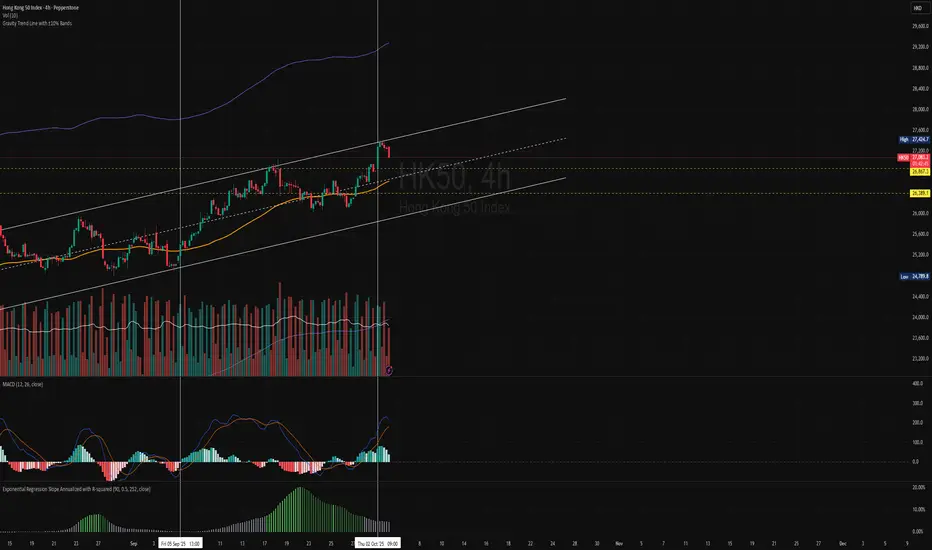
4h Chart PEPPERSTONE:HK50
Cautious with the retracement,
MACD forming deadcross and probably sucking back to GTL level 26450.
Question: Are you going to take position now or wait for bigger risk/reward?
I don't have crystal ball, so look at the chart and see what the story it tells.
W chart show the MACD is curing up with a likely changing color histogram.
It's gonna bullish for HSI this year, at least Q1. Let's see!
27200-27380 Level is crucial to break for Bull to take charge.
However, when it reaches 30050-31070 level, markets & traders are likely to be acrophobic! In fact, am kind of a bit now!
Define your time frame and using the right chart
Long only everytime the price retrace touch/close to Gravity Trend Line (GTL) + Oversold zone - confirming using MACD + KDJ (MACD should be above '0' level if is continues Bullish.
Cross-check with smaller tf chart to confirm.
GTL is moving - monitor and enter accordingly.
Set your SL/TP manage risk.
Feel free to save the Gravity Trend Line (GTL) indicator if that helps you!
Be patient and the reward follow.
Happy Trading!
Macdcrossover

Rallies need breath. Corrections come next! Hello everyone!
It's almost the end of the year.
HSI has been bullish since starting of this year.
2024 - HSI closed with +3012pts; +17.67%
2025 - HSI has added ~+5000+pts; +24%++ at point of ✍️ since start of the year.
From W Chart:- Drawing your attention to year 2023,2024 & 2025.
You may see how the Index moved following its trend and being pulled back to Gravity TrendLine if it’s far off from the GravityTrendLine.
From the movement and pattern of the HSI index and story derived from a chart telling us that for this month likely the index might close with red candle.
The Index has been bullish since 2024. It’s time for correction!
The cycle is repeating....history may not be the same but the pattern seems repeating.
MACD for M chart showing the trend is still in bullish trend but seems weakening with light green histogram.
🔮There is one of the famous Hong Kong metaphysic master kind of forecast and predicted that this year 2025 the index will rise and fall; and the Index has been bullish for 11 months, and nobody will know if last month of the year would close in red?
For 2026, he is forecasting that the Index is going to start low in 2026 and gradually go up.
Well, I don’t think the master knows how to use TA for charting, but it seems the history and pattern of the chart are repeating.
Stick to your plan, manage your risk. The markets will channel profit towards your efforts and energy.
Do not anticipate would think the Index could pull back and close with red by end of this year.
Retracement is inevitable. The uptrend seems broken and the Index might retrace back to 24300 -24700 level.
Well, it’s now holiday season, lots of traders probably lock their profit in and off for the year.
2025 seems to start with rising and even though it could close with a red candle for this very last month of the year it’s still considered a very good year for HSI!
With the recent Fed rate cut, everyone is advised to be cautious as we know the history is repeating.
We are encouraged to look for insights for macro and go out to take a walk and observe what’s happening on the ground; if possible speak to retailers, family and friends checking how are they doing instead of relying only on data, news, articles.
2026 & 2027 are going to be challenging years ahead.
Happy Holiday and may everyone have a greater year ahead in 2026!
See you next year!
Please Boost 🚀 if you enjoy this idea!

Mastering MACD: A Complete Guide to Momentum🔵 Mastering MACD: A Complete Guide to Momentum, Trend Phases, Reversals & Professional Signals
Difficulty: 🐳🐳🐳🐳🐋 (Advanced)
This article goes far beyond simple MACD crossovers. You will learn where MACD comes from, why it was created, and how professionals use it to read momentum, trend phases, acceleration, deceleration, and early reversals.
🔵 THE ORIGINS OF MACD (A SHORT HISTORY)
The MACD (Moving Average Convergence Divergence) indicator was developed in the late 1970s by Gerald Appel , a technical analyst and investor.
At that time, traders relied heavily on moving averages to identify trends. While useful, moving averages alone could not explain one critical question:
Is momentum strengthening or weakening inside the trend?
Gerald Appel solved this by measuring the distance between two moving averages and tracking how that distance expands and contracts.
This simple idea allowed traders to:
Detect trend acceleration and deceleration
Spot momentum exhaustion before reversals
Combine trend direction and momentum in one tool
Later, in the 1980s, Thomas Aspray introduced the MACD histogram , making momentum pressure visible instead of hidden inside lines.
This transformed MACD from a crossover tool into a true momentum phase indicator .
MACD still works today because institutions, funds, and algorithms continue to rely on moving averages.
🔵 WHY MOST TRADERS MISUSE MACD
Most traders reduce MACD to one idea:
Buy when MACD crosses above the signal line
Sell when MACD crosses below the signal line
While MACD crossovers are frequently used to signal potential trend reversals, their effectiveness improves when they occur at extreme MACD levels, far above or below the zero line, where momentum exhaustion is more likely.
MACD is not a buy or sell button.
MACD is a momentum and trend phase analyzer .
To master MACD, you must understand:
Zero-line regimes
Histogram pressure
Momentum expansion and contraction
Divergences
Continuation behavior
Structure confirmation
Multi-timeframe alignment
MACD shows how momentum changes around trend, not where price will go next.
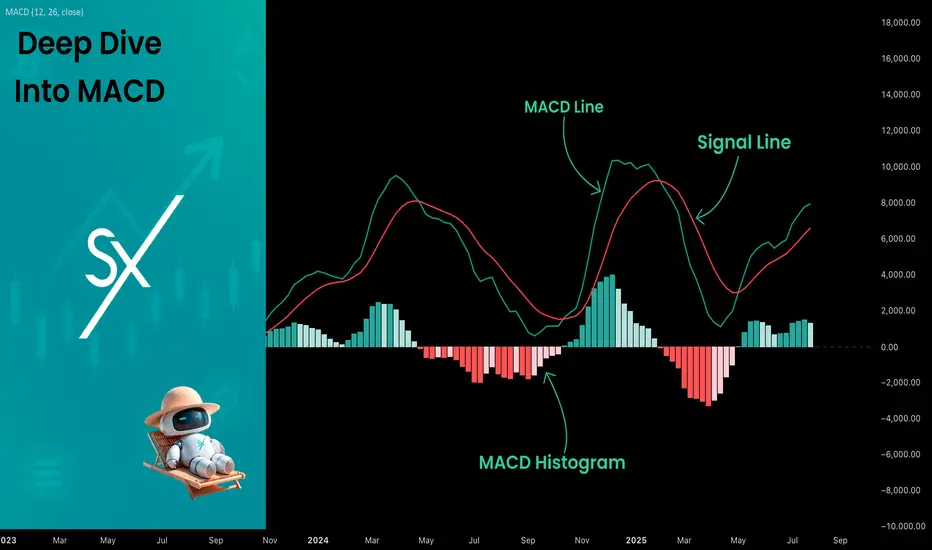
🔵 MACD STRUCTURE (WHAT IT IS REALLY MEASURING)
MACD consists of three components:
MACD line = difference between fast EMA and slow EMA
Signal line = smoothed average of MACD
Histogram = distance between MACD and signal line
Because of this construction, MACD measures the rate of change between trends .
Expanding MACD means momentum is accelerating.
Contracting MACD means momentum is fading.
🔵 ZERO-LINE REGIMES (TREND PHASE IDENTIFICATION)
The zero line is the most important level in MACD.
Bullish MACD Regime
MACD stays above zero
Pullbacks stall near zero
Histogram remains mostly positive
Bearish MACD Regime
MACD stays below zero
Rallies fail near zero
Histogram remains mostly negative
Professional rule: Trade in the direction of the zero-line regime. Ignore signals against it.
🔵 HISTOGRAM PRESSURE (THE REAL EDGE)
The histogram reveals momentum pressure before crossovers appear.
Expanding histogram = momentum acceleration
Contracting histogram = momentum deceleration
Below the zero line, higher histogram lows indicate weakening bearish momentum and a potential bullish shift
Above the zero line, lower histogram highs indicate fading bullish momentum and a potential bearish shift
Histogram turning points often precede:
Trend pauses
Pullbacks
Reversals
The histogram is the heartbeat of MACD.
🔵 MOMENTUM DIVERGENCES (EARLY WARNING SYSTEM)
Bearish Divergence
Price makes higher high
MACD or histogram makes lower high
Momentum weakens before price
Bullish Divergence
Price makes lower low
MACD or histogram makes higher low
Selling pressure fades
Divergences work best:
After extended trends
Near major structure levels
When histogram contracts sharply
🔵 MACD AS A TREND CONTINUATION TOOL
MACD excels at trading pullbacks in strong trends.
Bullish Continuation
MACD above zero
Histogram pulls back toward zero
Histogram turns positive again
Bearish Continuation
MACD below zero
Histogram retraces upward
Histogram turns negative again
This is the professional way to use MACD inside trends.
🔵 MACD + PRICE STRUCTURE CONFLUENCE
MACD becomes powerful when aligned with structure.
Higher highs + rising MACD = healthy trend
Higher highs + flat MACD = weakening momentum
Break of structure + MACD zero-line flip = regime change
Structure retest + histogram expansion = high-probability entry
MACD filters false breakouts by revealing momentum behind price.
🔵 MULTI-TIMEFRAME MACD ALIGNMENT
Professional rule:
Lower timeframe setups must align with higher timeframe MACD regime.
HTF MACD above zero = long-only bias
HTF MACD below zero = short-only bias
HTF histogram expanding = trend acceleration
This alignment significantly improves consistency.
🔵 EXAMPLE TRADING FRAMEWORK
Bullish Setup Checklist
MACD above zero
Histogram contracts then expands
Price forms higher low
Bearish Setup Checklist
MACD below zero
Histogram retraces then expands negatively
Price forms lower high
🔵 COMMON MACD MISTAKES
Trading every crossover blindly
Ignoring zero-line regime
Using MACD without structure context
Overreacting to small histogram changes
Treating MACD as a prediction tool
🔵 CONCLUSION
MACD is not a simple crossover indicator. When mastered, it becomes a complete framework for:
Reading momentum strength
Identifying trend phases
Detecting exhaustion early
Trading continuation setups
Confirming structure shifts
Aligning multi-timeframe bias
MACD does not predict price.
It reveals how momentum evolves around trend.
How do you use MACD? Histogram pressure, zero-line regimes, or divergences? Share your approach below.

Difficult and imperfect swing trade setup on BTCUSD dailyCOINBASE:BTCUSD has broken below its rising channel and is now exhibiting a downward trajectory. This shift creates a potential swing-trading opportunity arising from two distinct scenarios:
A reversal of the current downward trend, leading to a renewed bullish movement, or
A temporary pullback within the continuation of a broader bearish trend.
On the weekly timeframe, the first major traditional moving average above the current price is the 50-week moving average, positioned at approximately 100,000 USD. The daily chart reflects a similar structure: the nearest significant moving average above is again the 50-day moving average, also situated near 100,000 USD. This alignment establishes a notable—albeit high-risk—swing-trade setup. Should the price initiate even a micro bullish trend within a larger bearish context, the most probable target for such a move would be a reversion toward the 50 DMA at around 100,000 USD.
Supporting this thesis, several momentum indicators—specifically the RSI, Rate of Change (ROC), and MACD—are beginning to turn upward from recent troughs. This emerging positive momentum suggests that underlying buying strength may be forming, which would be consistent with the early stages of a bullish swing within a broader bearish structure.
A potential entry trigger on the daily chart would occur once price breaks above and remains above the 10 DMA for a sustained period (e.g., a 1- to 3-day confirmation filter, depending on risk tolerance). Historically, such moves have provided reliable signals on at least four consecutive prior occasions as depicted in the chart.
However, caution is warranted: daily closes above the 10 DMA are common, and many such moves fail to persist. This is why a multi-day filter is proposed—to increase the probability that the breakout represents a genuine shift rather than short-lived noise.
Proposed Trade Parameters
Entry: Break and sustained hold above the 10 DMA (estimated near 90,000 USD).
Take Profit (TP): Reversion to the 50 DMA (approximately 100,000 USD).
Stop Loss (SL): A daily close back below the 10 DMA (likely around 95,000 USD).
Risk–Reward Ratio: ~1:2.
Important Caveats: This setup is inherently imperfect, as both the entry and stop-loss levels are determined by moving averages and the trade itself yields a relatively modest risk–reward profile. Moreover, the rationale for a bullish retracement is based solely on technical patterns—specifically, the observation that counter-trend rallies frequently occur even within pronounced bearish phases. There is, at this point, no anticipated fundamental catalyst or macro-level justification supporting an imminent bullish move; the thesis is grounded entirely in probabilistic technical behaviour.

seems like Bear winds is blowing19Nov2025
Hello everyone!
HSI has been consecutively down for 4 days streaks.
For this week the HSI:-
🗝️🗝️ Important Support level : 26100 (which already broken down)
🗝️ Key Resistance level : 25850-25890
🗝️ Key Support level l : 25743 -25670
4h Chart:-
The cycle is repeating....history may not be the same but the pattern seems repeating.
Refer to D Chart , using 4h, 1h time frame to confirm the trend and you’ll notice the pattern is repeating.
1h Chart:-
GravityTrendLine for 1h - 26161/26356 at point of writing.
MACD for 1h chart showing the trend is continuously Bearish where the Signal and MACD is moving below the zero level and forming waves pattern beneath.
Don’t chase green in a red storm.
For long position, be cautious and check the smaller time frame 30m, 15m chart confirming the reversal.
Nonetheless, overall short-term trend is gonna be Bearish unless the resistance is being tested and cross above the level.
Sellers seems stronger. Ignore the news!
Ignore the noise, ride the flow. Bears walk in patterns too.
Stick to your plan, manage your risk. The trend rewards the patient.
Happy Trading!
** Please Boost 🚀, FOLLOW ✅, SHARE 🙌 and COMMENT ✍ if you enjoy this idea!
Price reverse from early loss but seems waiting for macro news? Hello everyone....
Price reverse from early loss but seems waiting for macro news? Should you wait for the news too?
For today,
🗝️ Resistance level : 26700, 26760
🗝️ Key support level : 26500 (this has been tested a few times during the noon session)
Remember to check with the underlying HKEX:HSI1!
4h Chart:--
GravityTrendLine (GravTrLine) for 4h - 26218
(Currently traded ranging 26730-267545 ~2.05% from GravityTrendLine)
The cycle is repeating....history may not be the same but the pattern seems repeating.
1h Chart:--
GravityTrendLine for 1h - 26476 so next support level 26218 if it pullback to 1h GravityTrendline
MACD for 1h chart has completed its cycle and break above zero level Monday.
For now, it has been confirmed the bullish trend. Buyer are slightly stronger; however trade with cautious as it’s on the halfway and probably sideways before it break the resistance.
Perhaps may monitor GravityTrendLine as a guide and using MACD as confirmation also using other indicators to confirm the trend.
Manage your risk.
Sit, Watch, Ride. 🧘
Happy Trading!

Pullback for Friday. what do you think?
Hello everyone....
MACD formed deadcross for 1h chart.
What's your trade plan?
For today and is Friday.
Resistance level : 26350
Key support level : 26130 if it break below this level then likely to continue to pull back to fill the gap and back to GravityTrendLine for 4h - 26100 (this level appear again and repeated).
The cycle is repeating....history may not be the same but the pattern seems repeating.
Suggest to watch out the MACD for 1h chart to coming back down and make a reversal for Long position.
For now, it has been confirmed the short position for short-term at least for today. Sellers are stronger.
To swing trade within the range between 150pts quite good to trade.
Long/Short : 26240-26250
TP/SL: 26200 - 26130
Manage your risk/reward.
Happy Trading!

98900 101101 this level is key for this week for BTCUSDBTCUSD - it needs to retrace back to GravityTrendLine area on Week Chart
So, it's gonna be sideways for a bit to gain back volume & momentum.
Hello everyone, from the chart the volume is low, momentum is weak.
Do watch out if it moved below the GravityTrendLine for W - 101,101 (at point of writing)
If it maintain, then it could be a healthy pullback.
It has traded beyond the 10% Gravity TrendLine - as long as it out from 'outer space" eventually it will being 'suck' back to the GravityLine.
Pullback reversal if it closed abov :110750 (at point of writing, do monitor the tredline indicator)
To continue bullish it has to cross-above 116542
Another support level to look at : 90795.
For accumulation : it depends on how you wanna layer it.
Keep an eye till month end - to see for D chart the MACD and Signal reversed and go back to bullish zone i.e above zero level.
Remember to zen while trading 🧘♂️🧘♀️📕🍵 - no action also essential as part of trading.
Happy trading!

How to Trade with MACD in TradingViewMaster the MACD indicator using TradingView’s charting tools in this comprehensive tutorial from Optimus Futures.
The Moving Average Convergence Divergence (MACD) is a momentum and trend-following indicator that helps traders identify shifts in market direction and momentum strength. It measures the relationship between two exponential moving averages (EMAs) to reveal when momentum may be building or fading.
What You’ll Learn:
Understanding MACD as a tool that tracks the convergence and divergence of moving averages
How the MACD line is calculated as the difference between the 12-period and 26-period EMAs
How the Signal line acts as a 9-period EMA of the MACD line and serves as a trigger for potential buy or sell signals
How the Histogram visualizes the distance between the MACD line and Signal line to show momentum strength
Recognizing bullish and bearish crossovers between the MACD and Signal lines
How to interpret the Zero Line as a momentum baseline — above zero suggests an uptrend, below zero suggests a downtrend
Identifying bullish and bearish divergences between MACD and price to anticipate potential reversals
Why crossovers and divergences should be confirmed with price action and trend structure, not used in isolation
How to add MACD to a TradingView chart via the Indicators menu
Understanding the default settings (12, 26, 9) and how adjusting them changes responsiveness
Practical examples on the E-mini S&P 500 futures chart to illustrate MACD signals in real market conditions
Applying MACD across multiple timeframes — daily, weekly, or intraday — for higher-confidence confirmations
This tutorial will benefit futures traders, swing traders, and technical analysts who want to incorporate MACD into their trading process.
The concepts covered may help you identify trend changes, momentum shifts, and potential entry or exit points across different markets and timeframes.
Learn more about futures trading with TradingView:
optimusfutures.com
Disclaimer
There is a substantial risk of loss in futures trading. Past performance is not indicative of future results. Please trade only with risk capital. We are not responsible for any third-party links, comments, or content shared on TradingView. Any opinions, links, or messages posted by users on TradingView do not represent our views or recommendations. Please exercise your own judgment and due diligence when engaging with any external content or user commentary.
This video represents the opinion of Optimus Futures and is intended for educational purposes only.
Chart interpretations are presented solely to illustrate objective technical concepts and should not be viewed as predictive of future market behavior. In our opinion, charts are analytical tools — not forecasting instruments.

Stay calm, stay alert! Revisit the macro prior to your trade. Hello everyone! tomorrow is the last day before the Q4 commences, let's see what's happening to HSI today. Wonder if you noticed, after lunch, it's quite amazed that how markets react to news - the meeting between the key leaders at Busan today. 😮😮😮
Well, I guess this is just another trick for the whale/smart money to flush retailers out sending 🍭🍬🍫 in the early session.
4h chart:-
Support : 26075 next 25887 and 25720 very strong support level.
Resistance : 26466, 26620
GravityTrendLine: 25887 (D chart)
1h chart:-
MACD formed deadcross for 4h and 1h chart.
🚨 Cautious for recent trades.
Look out for the support and resistance area.
Short-term is gonna be Bearish! until the MACD completed its cycle for 4h chart.
It's anticipated that is gonna be a huge pull back to 26000 level this week.
For swing-long/short - looking at range btwn 26070-26308 (at point of writing)
Or may wait for the opportunity, no trade/no action is also part of trading strategy.
Whales may play their games, but patience is our edge.
Also always refer to the underlying HKEX:HSI1!
Sticktoyourplan.
Happy Trading!
HSI staying uptrend. Heartbeat pattern is repeating,need a pausePEPPERSTONE:HK50
Uptrend channel on track.
The movement and pattern repeating as a cycle.
Spend time and effort to appreciate its movement.
With the helps of indicators confirming the trend to execute your trades.
Be patient, there is no need to rush or eagerly to take action.
With the tools, it helps on the probability of winning.
Continue to practice and train your skill.
HSI is in its 'bull run' since Apr2025 has been up for ~43%; is there going to be correction?
the answer is YES! definitely, but WHEN? I don't know but with historical data, the 29000-30000 is the key resistance level, so watch out!
Or simply the number 3,5,7,9 is kind of magic numbers, e.g like how Fibonacci sequence is being described; sometimes the WHY is futile.
For HK50 based on the chart:-
Next Resistance:29000
Shor-term (4h) : 27,514, 27,730, 27,795 (using Fibo, Fibo Extn)
Gravity Trendline : 26619.7 (D chart)if the movements follow its usual it will be attracted(sucked) at least closer or touch the line prior moving to next high.
For today: it will retrace back to 26965
MACD - is arching down, allow it to retrace and be patient.
You will notice the pattern, the heartbeat chart and its pattern is repeating...
Also always refer to the underlying HSI:HSI HKEX:HSI1!
No need to time the markets, unless you have crystal ball with supernatural power, so to trade our mindset is key: simply your trade plan (if you don't have one yet - please develop one that is unique for yourself, if you don't know how, please go to your local trading community that are reputable and learn or there are lots of free resources out there, take your first step.)
You dont have to be expert to trade (or expert in anything), one day you will be expert if and only you started to trade and practice it!
Set your risk reward, stop loss. risk management.
Zenful Trading! 🍃 🧘♂️ 🍵
Follow the stories from chart-Be still enough 2hear them b4 moveHello everyone!
From previous update, HSI uptrend mode continue on track.
At point of writing ✍️:
The HSI hit and break 4-year peak 27058 (the next target to break 5-year peak at 31,181 at 2021; do you think is possible?)
PEPPERSTONE:HK50 This morning hit 27049
What's your take with the recent fed rate cut and the news?
** Following the overnight U.S. Federal Reserve's 25-basis-point interest rate cut, China's central bank left a key rate unchanged on Thursday, as authorities appear in no rush to ease monetary settings.
** Hong Kong's central bank lowered its base rate charged via the overnight discount window by 25 bps to 4.50%, tracking the Fed move.
** The benchmark Hang Seng index
HSI surpassed the 27,000 mark for the first time since July 2021, before edging down 0.18% by midday.
www.tradingview.com
Trade as usual. Manage your risk/reward. Be patient.
For 4H - it seems gonna to take a pause; to retrace back before to charge up again to next Hi.
🗝️ 26730, 26450
If so that's the golden zone to take a bold slightly aggressive position ride the trend to break 27320 (then 27660)
MACD Signal above zero level
KDJ is above 80 and curving down a retracement is inevitable.
currently on D Chart PEPPERSTONE:HK50
🗝️ Resistance Level : 27050
Support Level : 26585
Support level 26300 (EMA30)
If break below, huge retracement from current level to 25300.
🗝️ Strong Support Level : 25250 (from 24767 @28Aug25, Gravity TrendLine support lifting circa 484pts).
Uptrend is intact.
Notice the trend, after the ⛳ , it always retrace back to GravityTrend Line area,
GMMA squeezing again (around 4,5 Sep 25 from the previous squeeze 27,28Aug25) before it spreading out again to rise again.
Well it's quite predictable the movement of the Index like 🌊 it's completing its cycle for the next wave to form; it maybe a ripple and it maybe a huge wave.
This could apply on shorter timeframe for your position on swing or intraday trade.
It's not a rocket science just a little patient and contemplation is suffice.
Following your own tradeplan/SOP.
Take your position, setting stop loss and ride on the trend (up/down).
At point of writing ✍️
Be aware that Index is about to being attracted towards to D GravityTrendLine likely tomorrow and next week.
However, the uptrend is very much intact and steady (W chart - see above) - the rippling 🌊 last longer, this seems mirroring how the Index hovering above 10% GravityTrend Line back in 2017, guess the party🕺💃is still on.
🗝️ Next Resistance Level : 25300
🗝️ Next Support Level : 24970
🗝️ Strong Support Level : 24920 (EMA30)
When in doubt, sit. Not every candle needs a response.
— Sometimes, the wise action is non-action, you always have options with wise discernment.
It's super charged!Seems like SOLUSD is going to create HH.
Using FIbo and Fibo Extension. Based on the movement it seems already passed 210.32 and might test 240.83 next.
BINANCE:SOLUSD
Confirming with 1H MACD signal is crossing and curving up (a goldencross) and GravityTrendLine.
Happy Trading and Remember to partial profit and let the rest run.
** Please Boost 🚀, FOLLOW ✅, SHARE 🙌 and COMMENT ✍ if you enjoy this idea!
Share your trading journey here to encourage the community and friends who pursing the same journey.
This is for educational and reference purposes only.
It does not constitute financial advice or a recommendation to buy or sell any financial instrument.
Always perform your own due diligence and consult a licensed financial advisor before making investment decisions.

Whale knows the flow - let's follow and ride the flow!210825
Hello bellooo everyone!
From previous update, HSI uptrend mode is still on track.
Currently is on retracement mode. IMO It is not turning bear.
At point of writing ✍️:
the HK50 $PEPPERSTONE 4H chart is undecisive - likely ranging between 25200-25096.
It seems going to test the support level at 24961 & 24772.
MACD line and signal below zerol level and KDJ although in greenzone but the trendline is cupping down.
Be cautious and monitor for shorter tf Long as it could take a while to rebound.
For aggressive entry, you may take Long/Short position within the range and set SL.
Otherwise you may wait for confirmation (depends on your time frame of trade).
currently on D Chart -
🗝️ Resistance Level : 25150
Support Level : 24,950
Support level 24,862 (EMA30)
🗝️ Strong Support Level : 24,609 (from 24120 @1Aug25, Gravity TrendLine support lifting circa 490pts)
Higher Hi⛳ marked in D Chart HK50 $PEPPERSTONE
21May2025 -23909
11June2025 -24430
25June2025 -24531
16Jul2025 - 24842
24Jul2025 - 25729
13Aug2025 - 25835
?? ??2025 - 26713 Next Hi
Notice the trend, after the ⛳ , retraced back to Gravity Trend Line area,
GMMA squeezing again (from last update on 8Aug25) before it spreading out again for bullish trend.
Well it's quite predictable the movement of the Index like 🌊 it's completing its cycle for the next big wave to form.
Nothing complicated.
Be aware, following your own tradeplan/SOP.
Take your position, setting stop loss and ride on the trend (up/down).
The HSI Index
At point of writing ✍️
Index is being sucked towards to D GravityLine again - 24665 (a lift from 8Aug2025 GravityTrendLine at 24344. Still in uptrend
🗝️ Next Resistance Level : 25300
🗝️ Next Support Level : 24970
🗝️ Strong Support Level : 24920 (EMA30)
www.tradingview.com
The 🐳 (institution including hedge funds, mutual funds, and private funds) likely is accumulating.
Probably they are 'selling' the news.
IMO:when HSI touch the EMA30/GravityTrendLine and overall is on uptrend mode, it's a healthy pullback/retracement and without hesitation very much would like to follow the 🐳 to accumulate.
Trade from awareness, not from noise. Trade with ease.
** Please Boost 🚀, FOLLOW ✅, SHARE 🙌 and COMMENT ✍ if you enjoy this idea!
Share your trading journey here to encourage the community and friends who pursing the same journey.
This is for educational and reference purposes only.
It does not constitute financial advice or a recommendation to buy or sell any financial instrument.
Always perform your own due diligence and consult a licensed financial advisor before making investment decisions.
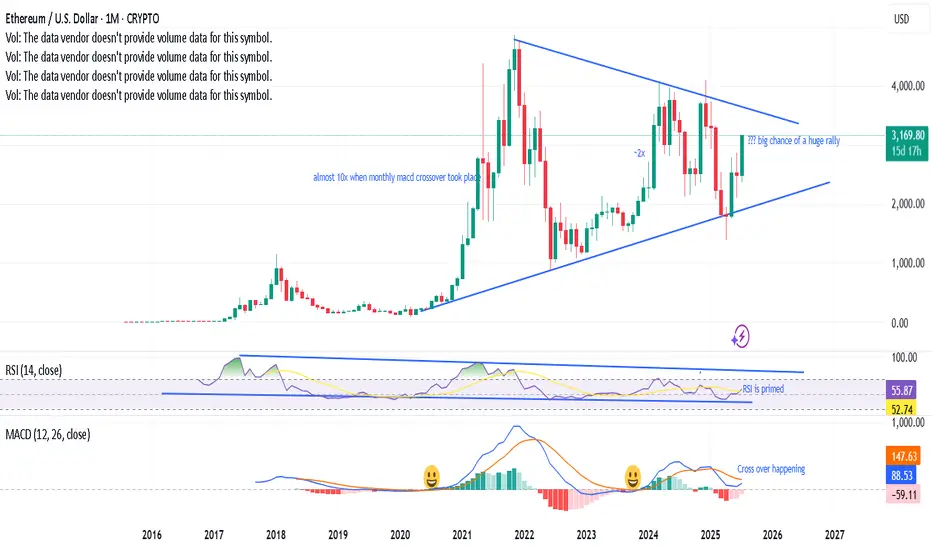
Monthly MACD crossover taking place, a prabolic rise?Last 2 times, when the monthly MACD cross over has happened, ETH has gone bonkers. A third one is on the verge of happening, RSI has enough room with a symmetrical triangle with bullish momentum - looks like a big rally is in the near horizon. Fingers cross.
The Index is at plank mode, be patient then take position.Hello everyone!
From previous update, HSI uptrend mode is still on track.
Previous POV: Deep retracement had happened. From 25,419 retraced to 24250 (circa 3.23% , 812pts). Check the previous post.
For this week and upcoming; looking at shorter time frame for Long entry.
For intraday, swing trade - look out for entry for swing (using shorter tf to entry), you may use Fibo and other indicator whichever you feel comfortable and confident.
At point of writing ✍️: the HK50 $PEPPERSTONE 4H chart is undecisive.
For aggressive entry, you may take Long position and set SL.
Otherwise you may wait for confirmation (depends on your time frame of trade).
currently on D Chart -
🗝️ Resistance Level : 25060 (the recent Hi)
Support Level : 24,787
Support level 24,612 (EMA30)
🗝️ Strong Support Level : 24,283 (from 24048@30Jul25, Gravity Trend Line)
Macroview - Hong Kong Markets continue to be Bullish.
Higher Hi⛳ marked in D Chart HK50 $PEPPERSTONE
21May2025 -23909
11June2025 -24430
25June2025 -24531
16Jul2025 - 24842
24Jul2025 - 25729
?? ??2025 - 26713 Next Hi
Notice the trend, after the ⛳ , retraced back to Gravity Trend Line area, GMMA squeezing before it spreading out again for bullish trend.
Nothing complicated. Pay attention, set up your SOP. Take your position, setting stop loss and ride on the trend.
This applicable to Long and Short position.
The HSI Index
At point of writing ✍️ Index is being sucked towards to D GravityLine - 24344; it reversed to bullish on 5Aug25.
🗝️ Next Resistance Level : 25115
🗝️ Next Support Level : 24826
🗝️ Strong Support Level : 24700 (EMA30)
Let's follow your own zentradingstrategy , continue to trade;
When in doubt, sit. Not every candle needs a response.
— Sometimes, the wisest action is non-action.
Be ease at trading!
** Please Boost 🚀, FOLLOW ✅, SHARE 🙌 and COMMENT ✍ if you enjoy this idea!
Share your trading journey here to encourage the community and friends who pursing the same journey.
This is for educational and reference purposes only. It does not constitute financial advice or a recommendation to buy or sell any financial instrument. Always perform your own due diligence and consult a licensed financial advisor before making investment
$SOL Loses Key Support | Eyes on $140 & $95 Zones📉 CRYPTOCAP:SOL Loses Key Support | Eyes on $140 & $95 Zones
🕵️♂️ On the daily timeframe, #Solana has officially lost its key support near $140, which previously acted as a strong bounce zone. A failure to reclaim this level could open the gates for a deeper drop toward the $95–$100 support range.
📊 Indicators signal downside:
RSI is trending downward
MACD shows a bearish crossover
Stochastic RSI confirms continued selling pressure
⚠️ Macro pressure adds fuel to the fire: August 1st tariff tensions, with expected news from Trump on charging Paris, are weighing down global risk assets. Historically, August tends to be a bearish month for crypto markets.
🎯 Key Levels to Watch:
Immediate Resistance: $140
Major Support: $95–$100
🧠 Trade wisely and manage risk accordingly.

Deep Dive Into Moving Average Convergence Divergence (MACD)🗓 The Moving Average Convergence Divergence (MACD) is one of the most popular momentum indicators in technical analysis. Whether you're a beginner or an experienced trader, understanding how the MACD works can significantly enhance your trading decisions.
📚 Introduction: What Is MACD and Why It Matters
The MACD (Moving Average Convergence Divergence) is one of the most powerful and widely used momentum indicators in technical analysis. It was developed by Gerald Appel in the late 1970s and has since become a staple in the toolkit of traders and investors across markets — from stocks and forex to cryptocurrencies.
At its core, MACD helps traders understand the relationship between two moving averages of an asset’s price, providing insight into both trend direction and momentum strength. By analyzing how these averages converge and diverge, the indicator offers valuable signals for entries, exits, and trend reversals.
What makes MACD especially popular is its versatility — it works well in trending markets, can be used across all timeframes, and combines both leading and lagging components. Whether you're a day trader or a long-term investor, understanding how MACD works gives you an edge in making timely and informed trading decisions.
📚 How the MACD Is Calculated: The Components Explained
The MACD is built from three core components: MACD line, Signal line and MACD histogram.
🔹 Calculating the MACD Line:
The MACD line is the difference between two Exponential Moving Averages (EMAs), typically 12-period EMA (fast) and 26-period EMA (slow). The formula is:
MACD Line = EMA(12) − EMA(26)
This line captures momentum by tracking how the shorter-term average diverges from the longer-term average. When the MACD line rises, the short-term momentum is increasing faster than the longer-term trend — a sign of bullish acceleration. The reverse implies bearish momentum.
🔹 Calculating the Signal Line:
To reduce noise and provide clearer signals, a 9-period EMA of the MACD line is plotted on top. This is the Signal Line, and it acts as a trigger:
When the MACD line crosses above the signal line → bullish signal (buy)
When the MACD line crosses below the signal line → bearish signal (sell)
Signal Line = EMA(9)(MACD Line)
🔹 Calculating the MACD Histogram:
The Histogram shows the difference between the MACD Line and the Signal Line:
Histogram = MACD Line − Signal Line
It provides a visual representation of momentum strength. The histogram bars expand when momentum strengthens and contract as it fades. It helps you spot shifts in momentum earlier than a basic crossover.
📚 How to Use MACD in Trading Strategies
⚡️MACD Signal Line Crossover
Buy Signal:
MACD Line crosses above the Signal Line from below (bullish crossover)
Preferably when both lines are below the zero line (early in the trend)
Price closes above the long-term trend approximation, in our case we use 200-period EMA
Sell Signal:
MACD Line crosses below the Signal Line from above (bearish crossover)
Preferably when both lines are above the zero line (early in the trend)
Price closes below the long-term trend approximation, in our case we use 200-period EMA
📈Long Trading Strategy Example
1. Wait until MACD line crosses over the Signal line from down to up. In our example we use 1D time frame for BITMART:BTCUSDT.P . Open long trade if point 2 will be completed.
2. Price candle shall be closed above the 200-period EMA. This is long-term trend filter to increase the probability that trades will be open only in the direction of the main trend.
3. Close the long trade when the MACD line crosses under the Signal line. This is an approximation that short-term impulse is over and correction is about to start.
In our case we have +20% return on this long trade, but, please, notice that we have not used initial stop-loss in this strategy. Trade was closed according to the technical condition, this approach can violate the risk management rules, but also can be applicable if you trade the amount ready to lose using this strategy. We will talk about stop-loss later.
📉Short trading strategy example
1. Wait until MACD line crosses under the Signal line from up to down. In our example we use 1D time frame for BITMART:ETHUSDT . Open short trade if point 2 will be completed.
2. Price candle shall be closed below the 200-period EMA. This is long-term trend filter to increase the probability that trades will be open only in the direction of the main trend.
3. Close the short trade when the MACD line crosses over the Signal line. This is an approximation that short-term impulse is over and correction is about to start.
In this case we have +15% return on the short trade. Again, strategy used the technical condition to close the trade and now let's cover how to place the stop-loss. There is no right answer how to use stop-losses. The first and the most obvious way to place stop-loss is using recent swing low/high, but the problem is that all traders are seeing them and do the same. Price tends to reach such levels to collect liquidity.
Another one way to place stop-loss is using the signal candle's high/low. This is so-called 1 candle stop-loss. Usually it's very tight and can allow to have the fantastic risk to reward ratio, but we are now recommend to use it if you are not a professional trader because win rate of such strategy decreases.
Third approach in placing stop-loss which we often use in our algorithmic strategies is the Average True Range (ATR). ATR is the volatility measurement, it allows to take into account the current volatility. Sometimes it helps to avoid the stop-loss hit when trade finally goes in your direction. You can just simply subtract (in case of long trade) or add (in case of short trade) ATR value to the entry price and obtain the dynamic stop loss based on current market condition. Also multiplier can be used for ATR. You shall choose the approach which is more comfortable for you, backtest all these approached to make your choice.
🧪Important: we used the long signals only below the zero-line and short signals above it in the attempt to catch the beginning of a trend and have large potential move. On the picture below you can see the same BITMART:BTCUSDT.P , but what will happen if we open long on the lines crossover above zero line? This trade will not be profitable because of restricted potential.
⚡️MACD Zero Line Crossover
Buy Signal:
MACD Histogram crosses above the zero line (momentum shifts from bearish to bullish)
Price closes above the long-term trend approximation, in our case we use 200-period EMA
Sell Signal:
MACD Histogram crosses below the zero line (momentum shifts from bullish to bearish)
Price closes below the long-term trend approximation, in our case we use 200-period EMA
📈Long Trading Strategy Example
1. Wait until MACD Histogram crosses over zero line. Open long trade if point 2 will be completed.
2. Price candle shall be closed above 200-period EMA. This is long-term trend filter to increase the probability that trades will be open only in the direction of the main trend.
3. Take profit when price reaches 3:1 risk to reward ratio according to the stop-loss from point 4.
4. Stop-loss shall be placed below recent swing low. This point can be discussed, you can use any stop-loss technique described earlier in this article. We demonstrate the simplest one, the key here is using at least 3:1 RR.
📉Short trading strategy example
1. Wait until MACD Histogram crosses under zero line. Open short trade if point 2 will be completed.
2. Price candle shall be closed below 200-period EMA. This is long-term trend filter to increase the probability that trades will be open only in the direction of the main trend.
3. Take profit when price reaches 3:1 risk to reward ratio according to the stop-loss from point 4.
4. Stop-loss shall be placed above recent swing high. This point can be discussed, you can use any stop-loss technique described earlier in this article. We demonstrate the simplest one, the key here is using at least 3:1 RR.
⚡️MACD Divergence Strategy
MACD Divergence is a strategy that helps traders identify potential reversals in market direction before they become obvious on the price chart. This makes it a favorite tool among swing traders and crypto enthusiasts looking to catch major moves early.
But what exactly is a divergence? In simple terms, divergence occurs when price and momentum (MACD) are moving in opposite directions — signaling that the current trend may be losing strength and preparing for a reversal. There are two main types of divergence.
🐂 Bullish Divergence
Price makes a lower low
MACD Histogram makes a higher low
This suggests that while price is still falling, downward momentum is weakening. The bears are losing control, and a bullish reversal may be near. Trading signal is very simple, when bullish divergence happens wait for the first increasing column on MACD histogram and open long trade. Place stop-loss under recent swing low and take profit at 3:1 RR.
🐻Bearish Divergence
Price makes a higher high
MACD makes a lower high
This suggests that while price is still falling, downward momentum is weakening. The bears are losing control, and a bullish reversal may be near. Trading signal is very simple, when bearish divergence happens wait for the first decreasing column on MACD histogram and open short trade. Place stop-loss above recent swing high and take profit at 3:1 RR.
🧪 Important hint: MACD histogram shall cross the zero line between two lows/high to create the most reliable divergence signals. We are not recommend to use it without zero-line crossover to decrease number of false signals.
📈Long Trading Strategy Example
1. MACD Histogram shall create higher low.
2. Price shall create lower low.
3. MACD Histogram shall cross the zero line between lows.
4. MACD Histogram shall show the first increasing column.
5. Put stop-loss under the recent swing low.
6. Put take profit at 3:1.
🧪 You can enhance the long signal with the MACD Line divergence. In our case we have both divergences: with MACD Histogram and MACD Line.
📉Short trading strategy example
1. MACD Histogram shall create lower high.
2. Price shall create higher high.
3. MACD Histogram shall cross the zero line between lows.
4. MACD Histogram shall show the first decreasing column.
5. Put stop-loss above the recent swing high.
6. Put take profit at 3:1.
🧪Divergence is extremely strong signal, but when price continue it's move in the direction of a trend and it's not reversing it can also be the signal for the trend continuation. This situation is called "Baskerville Hound" signal, this name was given by famous trader Alexander Elder. We don't recommend to use it for novice traders, but it's useful to know about it.
📚 Conclusion
The Moving Average Convergence Divergence (MACD) is more than just a crossover tool — it's a powerful momentum indicator that offers deep insight into the strength, direction, and timing of market trends. By understanding how the MACD line, Signal line, and Histogram interact, traders can uncover early trend shifts, spot momentum divergences, and time entries and exits with greater confidence.
Whether you're a short-term trader using fast crossovers for scalping or a long-term investor watching for weekly divergences, MACD can adapt to your style when used thoughtfully. Like all indicators, it works best when combined with price action, support/resistance levels, and other indicators — not in isolation.
Ultimately, mastering MACD is not about memorizing patterns, but about learning to read the story of momentum that unfolds beneath the surface of price. With disciplined application and practice, MACD can become a reliable compass in your trading strategy.
HSI dipping, traders are flipping,stay Zen - Index is yoga-ing!Hello everyone!
Today HK50 PEPPERSTONE:HK50 D open at 25350, Hi:25446 Lo:25164
IMO: Deep retracement is happening with profit taking from futures expiring tomorrow for traders & waiting for catalysts for talks next week.
For 4H - Index moving closer to Gravity Trend Line - look out for entry for swing (using shorter tf to entry).
At point of writing ✍️: the HK50 $PEPPERSTONE uptrend mode is on track and now in the retracing mode.
currently on D Chart -
🗝️ Resistance Level : 25300
Support Level : 24950
Support level 24558 (MA30)
🗝️ Strong Support Level : 24048 (Gravity Trend Line)
1H Chart HK50 $PEPPERSTONE
If today not able to close 25304 (25335 HSI), it's likely a deep retracement.
Shor term pullback -for swing trade and for mid-longer term it's still on bull track. Most likely people profit taking before the HSI futures expires tomorrow.
Macro view - Index continue to be Bullish. Well, markets cooled a bit waiting for details from the ongoing US-China trade talks early August'25.
Higher Hi🚩point marked in Chart HK50 $PEPPERSTONE
21May2025 -23909
11June2025 -24430
25June2025 -24531
16Jul2025 - 24842
18Jul2025 - 25052
24Jul2025 - 25729
?? ??2025 - 26163 Revised Target
The HSI Index HSI:HSI
At point of writing ✍️ Index is being sucked towards to D GravityLine - 24085; it fall below the sideway box.
If it doesn't close above the key support level this week, the deep retracement is happening.
🧨🧨🧨Pay attention and cautious.
🗝️ Next Resistance Level : 25350
🗝️ Next Support Level : 24900-25200
🗝️ Strong Support Level : 24300-24750
Let's follow your own zentradingstrategy , continue to trade; Observe your emotions as you would the clouds—passing, shifting, never you.— Mindfulness helps you respond, not react, in volatile markets and moments.
Be ease at trading!
** Please Boost 🚀, FOLLOW ✅, SHARE 🙌 and COMMENT ✍ if you enjoy this idea!
Share your trading journey here to encourage the community and friends who pursing the same journey.

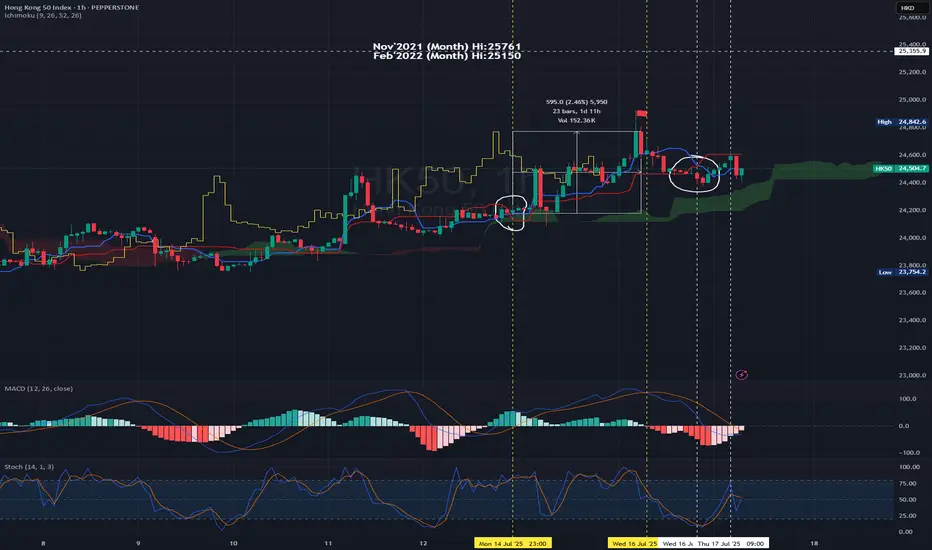
Dont predict&anticipate the market - ask indicators for hints! Hello everyone! how was the HSI trade so far?
Apologies for not updating as I was allowing myself to take a pause journaling my trade also to pay attention on my own personal growth journey. However, am continue to trade HSI in sustainable and profitable way and have had trying and test using different combination of indicators that bring quite positive results since.
Sharing this with anyone that reading this.
Please note that this is just for my own experiences and please DYODD.
For Swing Trade Test: (some steps to consider for entry set up - setting your time frame)
E.g using 1H Chart - 14Jul2025 23:00
MACD - entering the above zero line - it breaks above zero level on the next candle. Turned bullish confirmation.
Using Ichimoku Cloud for trend confirmation.
Once the MA9>MA26 the blue line crosses above red line (circled in white). This is a bullish confirmation and it is trading above green cloud.
You may pay attention to set your entry point.
Set Up : on the next candle open - you may open Long position - 24204.90 Set SL with R/R Ratio 1:1 or 1:1.1-1.25 (or in accordance to your risk appetite or carry out backtest and to be realistic)
Taking Profit : You may pay attention to be more aggressive to TP only when the MACD is forming DeadCross i.e 16Jul2025 11:00 (using the same timeframe chart).
For the reversed side it's the same methodology. But it's recommended to Short if and only if when the candles are closed below cloud + MACD is on the bearish zone.
So, in this case, I will not open short position as it's not the normal underlying HSI trading hour, so we wait till the underlying normal trading hour commence.
Today HK50 PEPPERSTONE:HK50 open at 24567, you may decide if you would to short and setting SL and TP.
From chart, you may open short position with R/R : 1.1.1 (TP : 24:400; SL : 24772) Entry: 24596 (the next hour candle at 10:00, of course you may cross check with shorter time frame to 'catch the high' 😂)
Trade for profit requires persistency and consistence.
There is quite a wide range to trade in between the movement.
Buy into Support Sell at resistance.
Set your TP/SL & protect your capital.
at point of writing ✍️: the Index uptrend mode is on track.
currently on D Chart -
🗝️ Resistance Level : 24600-24700
🗝️ Support Level : 24370-24400
🗝️ Strong Support Level : 24030-24300
Higher Hi🚩point marked in Chart
21May2025 -23909
11June2025 -24430
25June2025 -24531
16Jul2025 - 24842
?? ??2025 - 25907 Target
Opinion: continue Bullish and shall breaks the recent Hi of 24900 and target could break 25200-25750 pretty soon (the Gravity Line upper band).
The Index is now on the intermediate bullish trend (not far off from Gravity line and not yet touch the Gravity Upper band or beyond for D chart) - Shall publish this indicator.
From previous posts:-
W Chart:- HSI continues its Bullish mode with strong pullback! Recovery could expected to see in end Jun - early Jul'25.
14Jul2025 -
at point of writing ✍️:
Perhaps it shouldn't been said as recovery but continue the uptrend.
As we can notice from the latest chart it seems to continue its uptrend momentum even MACD have had curving down after deadcross formed 12May25.
The MACD signal line staying above zero level.
Continue the Long call for HSI with the forecast and repetitive of history the next 4-6 weeks might be a good profit to hold Long position.
🚨However, please take note that the index is moving beyond the Gravity upper brand on W chart which we should monitor closely to TP and enter again for healthy retracement.
🎯 Reminder: For long term (6-18 months) continue to accumulate China & HKG for the potential upside for the year! All retracement is a good entry point. Again, everything is impermanence. Manage your risk, position sizing. Take only the risk that you can afford.
For HSI HSI:HSI
Recent Hi : 16Jul2025 - 24867.81 (trying to test the resistance at 19March2025@24874)- this ¬6.58pts seems took quite a while to break. Let's be patience.
🔎 DYODD and don't listen to anyone.
Invest in yourself, do some study and learn along the way while you trying to verify or finding the answer if to start invest in CHN/HKG markets.
If you don't know how or where, you may ask Deepseek/Chatgpt for most reputable Trading courses nearest to you.
Let's follow your own zentradingstrategy , continue to trade; a strategy is a raft—cross the river, but do not carry it on your back forever — Stay flexible. No method is permanent. Adapt, let go, grow.
** Please Boost 🚀, FOLLOW ✅, SHARE 🙌 and COMMENT ✍ if you enjoy this idea!
Share your trading journey here to encourage the community and friends who pursing the same journey.
MOIL - Potential for 500 target with Crown pattern in makingMOIL has confirmation for Bullish crown formation .
It has closed above 20 & 50 EMA on day time frame.
Moreover MACD is signal line has turned positive.
With all this it has potential for following targets;
360 / 400 / 450 / 500
SL: 315

$NVDA Hits Key Inflection Zone – Breakdown or Breakout?📍 We’ve arrived.
NASDAQ:NVDA has reached the key reversal zone where sellers previously took control. This is the third touch, and markets rarely leave these zones without a fight.
🔍 Technical Setup:
Price has retraced to prior breakdown level.
MACD is trying to cross bullish — momentum building.
Sellers should defend here… but the recent AI narrative and Gulf chip deals could fuel a breakout.
If sellers fail to show up, we may blow straight through this level toward new highs.

HSI on the climb—ride the waves with your own strategy!6May2025
Hello everyone! how was the HSI trade so far?
From the previous updates trust everyone likely knows how the movement of the Index.
Paying attention on how it moved and the forecast of futures movement seems predicted. Of course, some times it may not go according to what you forecasted. Hence, to develop your own trade plan is essential.
From previous posts:-
MACD - Deadcross formed 20/3/2025 on D Chart.
MACD - Goldencross formed 21Apr2025 on D chart, although still within bearish zone but it did a short bull run since then; opened at 21015 on 22Apr and as of writing 22613; it gives around 1598pts ~7.6% gained.
CAPITALCOM:HK50
Fast forward to now:-
4H chart
at point of writing ✍️: the Index uptrend mode is on track again.
Trade for profit requires persistency and consistence. The constancy is kind of boring.
Buy into support Sell at resistance.
Set your TP/SL & protect your capital.
currently on D Chart -
20EMA:22065; 50EMA:22080 (both are sticking together at the moment and curving up)
🚨 as of ✍️ :
🗝️ Resistance Level : 22700-22730
🗝️ Support Level : 22360-22400
🗝️ Strong Support Level : 21950-21990
W Chart:- HSI:HSI
HSI continues its Bullish mode with strong pullback! Recovery could expected to see in end Jun - early Jul'25.
17Mar2025 -
24Mar2025 -
7Apr2025 -
6May2025 -
Continue the Long call for HSI:HSI with the forecast and repetitive of history the next 4-6weeks might be a good profit taking level; hold any long position and manage the risk as well.
Target to take profit: 24630-24910 (it may break 25000 level, and paused at 25300 strong resistance level, you may crosscheck with Month chart for the Bullish trend; last week the MACD signal line break above the zero level.)
For current markets condition, the CHN & HKG continue to be volatile with the continuing noise from tariff and on macro the numbers could be mixed.
🎯 Reminder: For long term (6-18 months) continue to accumulate China & HKG for the potential upside for the year! All retracement is a good entry point. Again, everything is impermanence. Manage your risk, position sizing. Take only the risk that you can afford.
🔎 DYODD and don't listen to anyone. Invest in yourself, do some study and learn along the way while you trying to verify or finding the answer if to start invest in CHN/HKG markets. If you don't know how or where, you may ask Deepseek/Chatgpt for most reputable Trading courses nearest to you.
Stay sharp, trade smart, and let consistency be your superpower. 📈🍵📙
Continue to trade; continue your life as it is!
Happy Trading!
** Please Boost 🚀/LIKE 👍, FOLLOW ✅, SHARE 🙌 and COMMENT ✍ if you enjoy this idea! Share your trading journey to encourage peoples who pursing the same journey.
