BTC/USD Head And Shoulders Pattern 4 HourHi Traders,
I'm looking at BTC today on the 4-hour time frame.
We don’t know if the bottom is in yet for this recent capitulation but that’s not my problem to solve.
I only trade what the charts show me. If a setup presents itself and fits into my list of rules and criteria, then I will jump into a position.
I'm noticing a potential head and shoulders pattern.
We have full divergence on the MACD
What I would like to see is the price close above the neck zone impulsively with substantial bullish volume to accompany that move.
I would then look for low bearish volume on a retrace down to the neck zone.
Once the price retraces deep into the neck zone, I would open up a long position
My target would be the 23.5k level
Trade safe out there!
The Vortex Trader
Macdivergence

EUR/USD Double Bottom Daily Time FrameHi Traders,
I am looking at this potential Double bottom forming on the Daily Time Frame for EUR/USD
We've seen this descending trend line act as resistance since early February.
We can see we also have two clear bottoms with accompanied divergence across the MA lines of the MACD.
If we can see some impulsive price action accompanied by sizeable bullish volume that breaks us out of the descending trend line, ( and closes above the neck zone ), I would then wait for the price to retrace back into the neck zone before opening up my long position.
Targets would be previous price structures.
Daily chart patterns are a great way of practicing patience haha.
Trade safe out there!
The Vortex Trader

Where is VERU going?I am not a professional and don't work in finance. This is a technical analysis of the daily candles.
I think in at least the short term you are going to see VERU make a drop. This opinion is only based on the fact that the MACD just crossed over. I originally thought with the green engulfing candle that we may continue the uptrend, but the lack of volume and the cross over on the MACD solidifies for me that we will be going down.
Let me know what you think. I would love your feedback.

Double Bottom For EUR/USD 4 HourHi Traders,
I am looking at this potential Double bottom forming on the 4-hour time frame for EUR/USD
We have pure divergence showing on the MACD.
We have sellers weakening out on the histogram as well as the MA lines.
This current candle needs to close ideally above the neck zone but needs strong bullish volume to accompany it.
If we see that, then we can wait for a retracement back into the neck zone before opening up a long position.
I have used the trend-based fib extension tool to pre-determine my targets.
Target 1 – 1,055
Target 2 – 1, 06
Trade safe out there!
The Vortex Trader

New Rising Channel for BitcoinCurrently, we seem to have received rejection from ma200 in the h4 time interval. Although we seem to be holding on to the ma50 on a support basis in the same timeframe, I don't think it will make the channel valid and I think we will throw a pin below the weekly ma200 and close it on this lively average. Although the sloping channels formed in all kinds of logarithmic scales and weekly timeframes show that we are at the bottom, there is clearly a need for a sharp decrease so that we can see a sharp reaction rise. We still have not reached the goal of the bear flag formation in the big picture, and moreover, there is another bear flag that we can see in the small picture, confirming the goal of the other one.
B

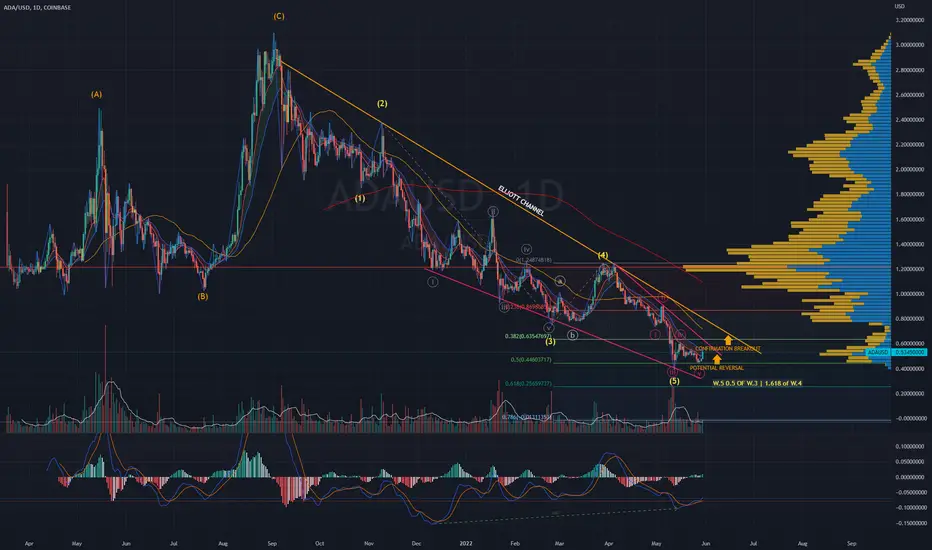
ADAUSD | Wave Analysis | Ending Diagonal - Downtrend Target ZonePrice action and chart pattern trading setup
> Elliott Wave Analysis Mapping with ending diagonal positioning target downtrend reversal pattern
> The current potential final wave 5 within the target zone extended 0.5 of wave 3 and retraced exactly 1.618 of wave 4.
> Long 1st Entry @ Ending Diagonal downtrend line breakout and 2nd entry @ Elliott Channel Breakout for reversal confirmation
> 1st Target uptrend @ Wave 4 and 2nd target @ Wave 2 position
> Stoploss at the lowest candle of wave 5 minor with -20% downside risk.
> RRR: 1:3 for medium term trade
Indicator:
> MACD - some bullish divergence crossover signal line below center
Always trade with affordable risk and respect your stoploss
BNBUSDT | Wave Projection - Downtrend Target Primary Wave IIPrice action and chart pattern trading
> Downtrend Elliott channel - ABC Flat Correction - Wave C extension 1.0 of Wave A projection
> Projected target primary Wave II with correction subwave V at 1.236 - 1.618 retracement of subwave IV in the price range of 150 - 200.
> Long Entry @ local downtrend breakout for 1st entry and Elliott channel breakout for medium and long term trade
> 1st target at SMA200 and Primary Wave I as the 2nd target
> Stoploss at the lowest position of reversal wave C inverted H&S zone
Indicator:
> MACD Slight bullish divergence just crossover signal line below 0
Always trade with affordable risk and respect your stoploss

JPM double bottomDouble bottom with divergence on MACD, RSI and Stochastic with 61.8% Fibonacci support from the bottom of the corona crash. Compared to the index finances are looking a lot better with JPMorgan Chase & Co. and Citigroup leading the way. Breakout of falling Wedge pattern shows a great opportunity for a Long position.

SPX temporary bottomThis could be a temporary bottom for the Market. First we have a divergence both on the Stochastic and the RSI. The price bounced of the trendline and the Fibonacci(Bottom of the Corona Crash and all time highs).And on the Weekly the price closed outside of Bollinger bands which could mean that the price is oversold in a way. But this is not the market bottom, far from it. The situation in the world is unpredictable and unstable. Another reason are the Elliot waves on the weekly chart that I posted showing where the price could go.


❌ BTC Price Faces Hurdles ❌Hello!
Bitcoin now started making some of the mess in charts as there is a clear indication of any breakout, but a short-term upward movement is happening in a very corrective manner. Keep an eye on Bitcoin as it may dump at any time. The $32,000 mark will give some relief to the market.
Bitcoin is now trading above the $30,000 level and the 100 hourly simple moving average.
The first support is $ 29600 - $ 29,000, and the $ 27,000 area.
The next major resistance is near the $ 31,400 level. A clear move above the $ 30,300 and $ 31,400 resistance levels might start an increase in the coming sessions. The following key resistance could be near the $ 32,500 level, above which the price might rise to $ 34,000.
The MACD is now slowly gaining pace in the bullish zone.
The RSI for BTC/USD is now above the 50 level.
The current GBTC (Grayscale Bitcoin Trust Premium) has reached a new All-Time Low of -30.80%, meaning that the current interest shown in large BTC investment products has declined drastically and, for now, is showing no signs of a rebound; however, this remains an important market indicator.

BTC Weekly Chart - MACD + Elder Force Index + RSIIn my analysis, I have used a logarithmic scale on the weekly BTC chart.
First of all, I want you to pay attention to 200 days of Moving Average Exponential it is very close to the current price of BTC at the $26976 level. With all the inflation rate that we got today 8.3% plus 50 basic points monthly raise will continue we can expect that price could test this 200 days EMA.
Also, we can see the fighting between bulls and bears for the $30000 level right now in real-time. In my opinion, it will be good to see a test and after that retest that will create a double bottom technical figure with a shape of W. Of course, bulls will try to defend this level as much as possible. It is a potential place for opening a long position.
Let's discuss the MACD, Elder Force Index and RSI indicators:
On the chart, you can see two ATH - the first one on 12 Apr 2021 ($64956) and the second one that was a little bit higher on 08 Nov 2021 ($68976), but the indicator shows us a bearish divergence that was an urgent call to start closing long position and think about short one. What's more, you can see on the diagram that it shows that the power of acceleration is dropping down and the same result occurred on the Elder Force Index - force was decreasing.
RSI was showing the same exact picture of bearish divergence as MACD. All three of them just powered each other which helps us to build a strong basis that soon will be BTC correction or even a bear trend.
Now is it time to speak about both corrections that happened on 17 May - 19 Jul 2021 and 17 Jan 2022 - 21 Feb 2022, there was bullish divergence on MACD and RSI, but not on the EFI that clearly has shown that we should be careful and watch out for the bull trap and it happens on the $48000 level.
Now the last downtrend movement has unveiled both bullish divergences on MACD and RSI.
At the present time, we have a bullish divergence on the Elder Force Index, but for me, it is not a leading indicator but more a tool that helps approve the other two indicators.
RSI shows us that it moves to the lower zone which indicates that BTC is oversold. I also depicted the Covid dropdown (09 Mar 2020) on the RSI it is on the 33.53 level, actually, at the current level and even deeper downside movement - 28.86 level (10 Dec 2018) when was the bottom of the bear market.
MACD's diagram indicates that two previous downtrend movements were more powerful where whales were selling their bags, otherwise, you can see that diagram became smaller and smaller each time, for me, it shows that price got pressure from the overall world economy and the U.S. itself, but not from the whales that still accumulate more BTC coins.
May the profit be with you!

DAL 46.64 ShortFundamental Analysis
With Airlines getting business back up and running in a slow fashion, the Airline industry as a whole has to return back to profitability. However it looks like investor confidence is still not bullish, and DAL isn't an exception to this case. For the short-run, there is still a bearish outlook for the industry considering the consistent Covid variants causing havoc.
Technical Analysis
Price volatility since last year month-to-month.
Price is in a downtrend at resistance level of 46.64.
Widening channel with no breakout creating lower lows in the price without higher highs. This is a bearish trend in the near term.
MACD is flat near the zero line.
RSI level at 51.80. A breakout here can signal a potential upward momentum, however confirmation with a breakout at 46.46 is also needed.
Stochastics showing mixed readings so it's not valid.
Fibonacci retracements showing lows have retraced to 23.6 while resistance at 61.8 level has remained steady.
Candlesticks showing that every time there has been a push to the upside, a doji star has confirmed a reversal on several occassions.

HOW TO SWING TRADE USING BB - MACD!Today im going to show you how to use Bolinger Bands and MACD together to understand where the price is going.
So you can swing trade easily.
By the way swing trade is holding assets for profit for more than a day.
So this strategy is suitable for novice investors. But you will need practice before applying this to your trading strategy!
First of all i do not recommend betting against the market.
Do follow the trend when using this strategy. If the trend is upwards do not short the asset.
But there can be breakout from the existing trend.
Therefore we can also use trendlines to have better understanding of the market.
Lets identify indicators that we are going to use then i will explain how to use them to swing trade.
MACD measure specific EMAs and their relations. EMAs are mainly 12 period EMA and 26 period EMA.
There are 2 lines and 1 histogram on MACD. They are called, MACD line, Signal line, Histogram.
MACD line = 12 EMA - 26 EMA
Signal line = 9 EMA of MACD line
Histogram = Difference between MACD line and Signal line
We use MACD to identify trends so we can trade accordingly.
If the MACD line is above 0, we are in a uptrend.
If the MACD line is below 0, we are in a downtrend.
If the MACD line is above or crosses above signal line it is a buy signal.
If the MACD line is below or crosses below signal line it is a sell signal.
Longer histograms and being too far away from zero line means momentum of the trend is high.
These are the basic of MACD.
Bolinger Band is easier to grasp than MACD.
There is an upper channel and lower channel calculated with volatility and 2 Standard Deviations from 20 Simple of MA line.
Generally if the price is closer to the upper band, market is considered overbought and vice versa.
If the market is highly volatile bands widen and if volatility is low bands contract.
The most important thing about BB is 20MA. Generally price will test 20MA line after it hits the upper or lower band.
If price breakout or rejceted from it, trend is established.
So how can we combine both of them to swing trade successfully?
1- We have to identify the market trend. We can simply draw a trendline on the chart to identify it.
2- Use 20 MA as entry-exit
3- Look MACD histogram for momentum
4- Use lower - higher band as SL-TP
Example;
Look at the chart on the left!
Feb 04 19, uptrend started and MACD signal buy.
But there is no momentum.
MACD far away from zero line and price far away from 20MA.
Wait until price breakout from 20MA.
1- is the confirmation of trend with momentum rising and price breakout above 20MA line. BB start to widen meaning high volatility.
You can enter long trade here since price and momentum rising with volatility.
2- is the upper band of BB. This is take profit levels.
If you are seasoned enough you can open short position here with 20MA area TP.
3- Test of 20MA. You can enter short or long here with lower BB being SL - TP.
But with MACD signaling sell and losing positive momentum in histogram, short seems to be the RIGHT CHOICE .
4-Price cant hold 20MA. Drop to the lower band. SL-TP zone.
If you are seasoned enough, potential entry zone for long trade. TP being with 20 MA zone.
Lets take a look at the chart on the right.
Same chart, after a couple of weeks from chart 1.
There is a clear uptrend that started 09 March 20.
1- At 20 April MACD signal buy but there is no momentum and price was still below MA20.
It is logical to wait for confirmation which is the breakout of MA20.
2-Price breakout MA20 after a week.
Between 27 April - 05 Oct, there are more than couple times that market offers good entry zones.
Between this time, MACD momentum and lines are rising to the positive-buy zone.
3- Price is around upper band for a long time. Could be a TP zone.
Price also lost %25 value 2 in weeks. Some people use here as TP zone.
But MACD lines and histogram were positive.
Price didnt test the 20MA.
Also BB is still widening. Meaning high volatility in a bull market.
Opening short is not logical here.
4- Last time price touched the upper band.
Histogram started to lose momentum.
Potential TP zone and short entry.
To be honest this seems to be a good point for short trade but didnt work out.
Price went up (2. ATH) couple of weeks later with MACD momentum nearly finished.
Therefore always put SL-TP with your orders.
5- MACD signaling sell.
Low negative momentum.
If open short here, it could be like NO.3 on the chart.
Wait for confirmation.
6- Price test MA20.
After couple of weeks we broke down MA20. Bear confirmed.
Momentum rapidly increase to the negative zone.
Potential short entry.
7-Price cant hold MA20.
Lower BB reached.
Possible SL-TP area.
So sign from MACD to enter a long trade just yet.
8- Possible long entry with MA20 breakout above.
MACD signal buy with low momentum. Therefore wait for confirmation is logical.
After a week momentum rises.
Long entry seems logical.
New ATH for BTC.
So in short,
Identify a trend!
Check MACD for momentum and trend strength.
Enter when price breakout MA20.
Confirm the breakout before enter!
TP-SL at the MA20 and Band limits.

possible Double Top on XAU/USD weekly!!!i see double top pattern, weekly time frame on Gold , not too much sure but we have very big -RD and we can't ignore it
cause higher time frames are more important than the lowers one, so just take care and be careful and don't miss the big money

Short $ARKK $84.42Short $ARKK $84.42. Appears to heavy sell off. Downtrend will continue in my opinion. $ARKK walking on very fine line of support. Any further sell off below $85 area is not good for the $ARKK. Trading below all major moving averages. MACD turned negative recently. Current support level $85 area. If broken below then expect short target 1 is $73 area in coming weeks followed by short target 2 $62 area.

Bitcoin is likely to experience an uptrendhi guys
If Bitcoin loses its current support, it will enter the range of 37,500 to 3,500, which contains a harmonic bullish pattern, but I think Bitcoin will experience a bullish move and rise to a price of 45,000, but at 45,000 Bitcoin 2 It has static resistance and 2 dynamic resistances And I also found a RD+ divergence that could be a sign of an uptrend for Bitcoin

Bitcoin Move up to 44.3-44.5kHey Traders,
As you can see on the Daily Chart of Bitcoin (BTC). The price action has formed a falling wedge. The Elliot wave count shows that the breakout is imminent. The ema's are for decoration. We have hard resistance right now because not only is it a trend- line but there is also the orange basis ema of the daily Bollinger band in the same spot. Additionally, the MACD histogram will flip green soon indicating an uptrend! But expect a retracement up to the golden pocket near 44k!
Safe Trading,
-Pulkanator

Bitcoin, don't give me hopeHolding the weekly bear flag although it broke many daily resistance already, we'll have to wait for a close as the last 6 weeks have been.
WAITING

Bitcoin is about to Bounce!Hey Traders,
On the four-hour, we can see the MACD is creeping up to a bullish histogram while the RSI is indicating strength is coming back into the market temporarily. If this happens we will definitely cross the four-hour ema orange basis line of the Bollinger Bands .
Safe Trading,
-Pulkanator

Tesla to $1700? Hey Traders,
As you can see on the Daily Line Chart of Tesla (TSLA). The price action has formed a Descending Broadening Megaphone/ Wedge which is a Bullish Pattern. Now in fundamental terms, I think this is impossible at the moment because Tesla already has such a big market cap but in technical terms, this looks like it could happen. Tesla is a company mainly based on fundamental terms, so that's why various short sellers pick it unaware it defies bearish technical analysis. However, on the Bearish side, the MACD on the weekly looks like it will revert to red bearish histograms, foreshadowing maybe a correction.
But, I highly doubt it will hit $1700 in 3 years.
Safe Trading,
-Pulkanator

Bullish Divergence in Euro FuturesBasically the same idea that I posted last week about the Bearish Divergence in $DXY but more time has passed, and it looks even more pronounced in the Euro itself.
Pick your poison: /6E, /M6E, EURUSD are all good Long candidates to play this idea. Another good option could be to short /SFX - which is the Small Exchange's US Dollar Futures contract. If you don't know about The Small Exchange, I'd highly recommend looking into their products.
community.thesmallexchange.com

DAL Falling Expanding WedgePotential continuation with confirmations from the MACD histogram.
Will post updates along with targets if there is a breakout.
