When Indexes Disagree: Evidence-Based Clues Heading Into 2026Market Context: Why Futures-Based Index Analysis Matters
When equity markets approach historical extremes, surface-level price action often hides important structural information. This is especially true when analyzing cash indices alone. Futures markets, by contrast, provide continuous pricing across all trading sessions, including the Globex (Extended Trading Hours) session, offering a more complete picture of participation, liquidity, and risk transfer.
By focusing on US equity index futures rather than cash indices, traders gain visibility into how markets behave outside regular trading hours — often where meaningful positioning occurs. This becomes particularly important when markets are near all-time highs and internal alignment begins to fracture.
In this analysis, attention is placed on the four most relevant US equity index futures:
E-mini S&P 500 Index Futures (ES)
E-mini NASDAQ 100 Index Futures (NQ)
E-mini Dow Jones Index Futures (YM)
E-mini Russell 2000 Index Futures (RTY)
Together, these markets represent large-cap growth, broad market exposure, industrial and value-oriented components, and small-cap participation. When these indexes move in harmony, trends tend to persist. When they diverge, conditions often become more fragile.
All-Time Highs in Focus: Who Is Leading and Who Is Lagging
A defining characteristic of the current environment is disagreement among indexes, despite elevated price levels.
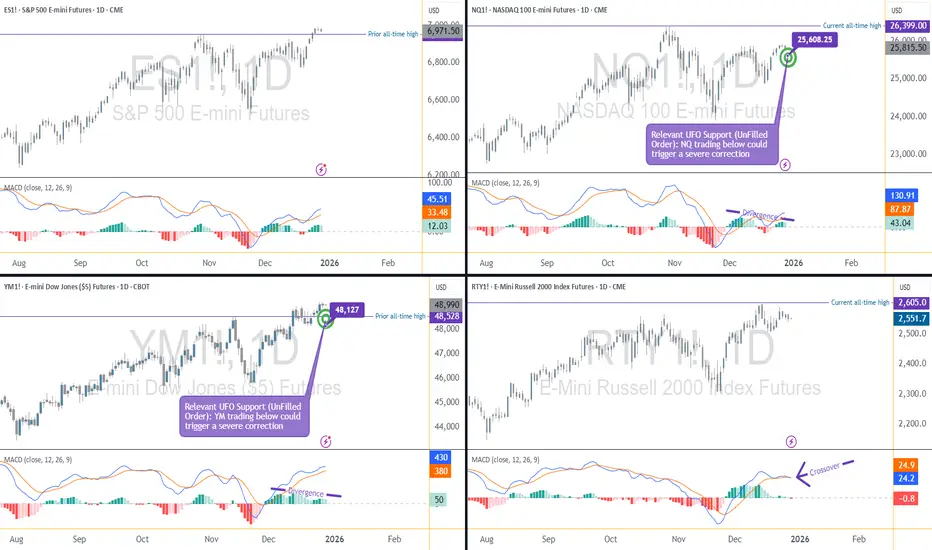
The E-mini S&P 500 Index Futures (ES) has recently pushed to a new all-time high. This reflects ongoing strength in the broader market and confirms that headline risk appetite remains intact.
In contrast, the E-mini NASDAQ 100 Index Futures (NQ) has failed to confirm this strength. Despite previous leadership, NQ is currently trading below its all-time high. This matters because the NASDAQ is heavily weighted toward technology and growth-related stocks, including those linked to artificial intelligence (AI) — sectors that provided a significant portion of upside momentum throughout 2025.
Meanwhile, the E-mini Dow Jones Index Futures (YM) is trading above its prior all-time high. This is notable because the Dow has a more diversified sector composition and is less concentrated in high-growth technology names. Its relative strength suggests that current market resilience may be coming from areas outside of the technology complex.
Finally, the E-mini Russell 2000 Index Futures (RTY) remains below its all-time high. Small- and mid-cap stocks often act as a confirmation layer for broader economic participation. When large-cap indexes make new highs while small caps lag, it can signal uneven economic traction and rising internal imbalance.
This combination — ES and YM showing strength, while NQ and RTY lag — forms the foundation of the current intermarket tension.
Momentum Evidence: What MACD Is Revealing Across Indexes
Price alone rarely tells the full story near extremes. Momentum indicators, when used correctly, help evaluate the quality of participation behind price movement.
In this case, the MACD indicator reveals important divergences across multiple indexes.
The NQ is displaying a bearish momentum divergence, where price remains elevated but momentum fails to confirm. This suggests that upside participation is narrowing rather than expanding.
The YM — despite being one of the strongest indexes — is also showing a bearish divergence on MACD. This is particularly important because divergences forming in strong markets often precede broader shifts, not because price must reverse immediately, but because momentum strength is no longer accelerating.
The RTY presents the most advanced signal set. It is not only showing a bearish divergence, but also a MACD crossover, which can be interpreted as early-stage downside momentum attempting to assert itself.
The ES, while not currently exhibiting the same degree of momentum weakness, stands increasingly isolated. When leadership narrows to one index, risk becomes asymmetric rather than evenly distributed.
Structural Risk Zones: Interpreting UFO (UnFilled Orders) Support
Momentum divergences alone do not constitute actionable signals. They require structural confirmation.
This is where UFO support and resistance levels (UnFilled Orders) become relevant. UFO zones represent areas where liquidity previously failed to transact fully, often acting as structural support or resistance when revisited.
In the current structure, two UFO support zones stand out due to their proximity to price and their relevance to both the strongest and weakest markets:
NQ: UFO support ending near 25,608.25
YM: UFO support ending near 48,127
These levels are significant because they sit directly beneath current price action. As long as price remains above these zones, structure remains intact despite momentum warnings.
However, a violation of such UFO supports would represent a meaningful shift. It would indicate that buyers previously willing to defend these levels are no longer present, allowing momentum divergences to express themselves more fully.
Conditional Scenarios: What Would Confirm a Broader Risk Shift
Rather than anticipating outcomes, evidence-based analysis focuses on conditions.
From a structural standpoint, bearish scenarios would gain credibility if:
NQ trades below 25,608.25, violating its nearby UFO support
YM trades below 48,127, removing structural support from the strongest index
Weakness emerging simultaneously in both the weakest and strongest indexes would suggest that divergence is resolving through price rather than consolidation. In such a case, broader downside expansion could develop, potentially manifesting as a sharp corrective phase.
Importantly, this framework does not assume that such a move must occur. It simply defines what conditions would matter if they do.
Illustrative Trade Framework (Educational Example Only)
For traders studying downside scenarios, a hypothetical bearish framework could be structured as follows:
Trigger: Confirmed daily close below relevant UFO support
Risk Definition: Invalidation above reclaimed structure
Objective: Next lower structural liquidity zone
Reward-to-Risk: Favorable only if structure breaks decisively
This framework is illustrative and intended solely to demonstrate how structure, momentum, and confirmation can align. It does not imply expectations or outcomes.
E-mini vs. Micro E-mini Contracts
All four equity index futures discussed — ES, NQ, YM, and RTY — are available in both E-mini and Micro E-mini formats. Both versions track the same underlying index and move tick-for-tick together. The difference lies in how risk is expressed.
ES / MES Tick size: 0.25 index points = $12.50 (ES) | $1.25 (MES)
NQ / MNQ Tick size: 0.25 index points = $5.00 (NQ) | $0.50 (MNQ)
YM / MYM Tick size: 1 index point = $5.00 (YM) | $0.50 (MYM)
RTY / M2K Tick size: 0.10 index points = $5.00 (RTY) | $0.50 (M2K)
Across all four indexes, Micro E-mini contracts represent one-tenth of the tick value of their E-mini counterparts.
Margin requirements vary by broker and market conditions. From a structural perspective:
ES / MES required margin = ~$22,500 (ES) | ~$2,250 (MES)
NQ / MNQ required margin = ~$33,500 (NQ) | ~$3,350 (MNQ)
YM / MYM required margin = ~$14,250 (YM) | ~$1,425 (MYM)
RTY / M2K required margin = ~$9,500 (RTY) | ~$950 (M2K)
This difference allows traders to express the same market thesis with far greater precision, especially when working around tight structural levels or conditional triggers.
With momentum divergences developing and key structural zones nearby, position sizing flexibility becomes critical. Micro E-mini contracts make it possible to:
Scale exposure gradually
Reduce concentration risk
Align risk more closely with invalidation levels
The analysis remains identical across E-minis and Micros — only the risk calibration changes.
Risk Management Considerations
Divergences can persist longer than expected, especially in strong trends. Acting without confirmation often leads to premature positioning.
Key principles include:
Waiting for structural validation
Defining risk before engaging
Managing exposure across correlated instruments
Avoiding overconfidence near historical extremes
Markets rarely turn because of opinion. They turn when structure and participation change.
Final Takeaway: Evidence Over Assumptions
As 2025 comes to a close, US equity index futures present a market that is strong on the surface but fractured underneath. Leadership is narrowing, momentum is diverging, and structural levels are increasingly relevant.
Whether these signals resolve through consolidation or correction remains unknown. What matters is that the evidence is now visible — and futures markets provide the clarity needed to observe it.
Data Consideration
When charting futures, the data provided could be delayed. Traders working with the ticker symbols discussed in this idea may prefer to use CME Group real-time data plan on TradingView: www.tradingview.com - This consideration is particularly important for shorter-term traders, whereas it may be less critical for those focused on longer-term trading strategies.
General Disclaimer
The trade ideas presented herein are solely for illustrative purposes forming a part of a case study intended to demonstrate key principles in risk management within the context of the specific market scenarios discussed. These ideas are not to be interpreted as investment recommendations or financial advice. They do not endorse or promote any specific trading strategies, financial products, or services. The information provided is based on data believed to be reliable; however, its accuracy or completeness cannot be guaranteed. Trading in financial markets involves risks, including the potential loss of principal. Each individual should conduct their own research and consult with professional financial advisors before making any investment decisions. The author or publisher of this content bears no responsibility for any actions taken based on the information provided or for any resultant financial or other losses.
Macrotrend
Roku Test with Destiny A 2 year Support trendline A Buy?Hi Guys. So i am always on the lookout for Macro trend setups, signs and opportunities. I believe ROKU is potentially in a position to take a nice swing.
This analysis is on 1 day.
Notice we have reached a Sloping Support trendline from December 2022.
We've had 2 touches previous that resulted in bounces.
Trendline theory states trendlines can stay intact for atleast 3 touch points.
Owing to the idea that our recent touch point is a solid area to take positions. Has a decent probability of a bounce.
On top of that we have the Blue horizontal trendline, which acts as an added layer of Support.
Incase the black trendline does not hold, this would be next lvl.
Stop loss/limit should be placed below trendlines based on risk tolerance. Small positions can have a larger % loss, vise versa.
Now to Support my theory of this buying a solid area to take positions.
I have 3 indicators.
RSI which is in Oversold conditions after 3+ months.
On top of that the momentum indicators MACD and STOCH. Are also oversold.
MACD is signaling a waning bearish momentum. As seen by the light red histobar prints.
We are looking for and eventually should see Green bars and a bullish cross. Which can bring in necessary demand we need for bounce.
Also STOCH RSI is below the 20 lvl, but crossing Bullish as we speak.
This must continue and a bullish cross ABOVE 20 lvl, will also bring in demand and help with bounce.
If we see bullish changes in the momentum indicaotrs, i believe there would be a even higher probability of prices bouncing.
So pay attention, be diligent and manage risk accordingly.
__________________________________________________________________________________
Thank you for taking the time to read my analysis. Hope it helped keep you informed. Please do support my ideas by boosting, following me and commenting. Thanks again.
Stay tuned for more updates on ROKU in the near future.
If you have any questions, do reach out. Thank you again.
DISCLAIMER: This is not financial advice, i am not a financial advisor. The thoughts expressed in the posts are my opinion and for educational purposes. Do not use my ideas for the basis of your trading strategy, make sure to work out your own strategy and when trading always spend majority of your time on risk management strategy.

Americas Car Mart Testing Multi-Year Demand Zone (Buy Zone)Hi guys!
This is a MACRO Analysis on AMericas Car Mart (CRMT). Macro meaning larger timeframe aka the 2 week in this instance.
Macro moves tend to speak louder than smaller timeframes like the 1 day for example when they start to move in price.
I believe CRMT has come to an important area and poses a great trade setup in my opinion.
If we look to Price action.
Notice 2 Support trendlines outlined. These are MULTI Year Support zones.
When price reached the trendlines, we ended up bouncing UP.
Notice our current price indicated by Orange box.
Our 2 support trendlines have converged. When 2 support trendlines meet it strengthens the Support.
Also notice the 21 EMA (Purple moving average) -> We have been below this since Septemberish of 2023. Moves below 21 EMA especially on the 2 week pose for good Buy zones as well.
So the combination of converging Support lines and being below 21 EMA = Good area to take positions
Now notice the 2 indicators ive included. These are momentum indicators.
STOCH RSI has crossed BULLISH. (where blue line moves above orange line)
Momentum can pick up and start a move up once this crosses ABOVE the 20 lvl.
MACD is currently below the 0 lvl. With the histogram bars changing from dark red to light red. This indicates a waning of bearish momentum. It is also attempting to create a higher low. All good signs. Look for a Bullish cross and green bars to show up. That will help drive prices up.
A cross ABOVE 0 lvl would bring about massive moves up.
Continue to monitor the indicators and price to stay above the Support zone indicated.
__________________________________________________________________________________
Thank you for taking the time to read my analysis. Hope it helped keep you informed. Please do support my ideas by boosting, following me and commenting. Thanks again.
Stay tuned for more updates on CRMT in the near future.
If you have any questions, do reach out. Thank you again.
DISCLAIMER: This is not financial advice, i am not a financial advisor. The thoughts expressed in the posts are my opinion and for educational purposes. Do not use my ideas for the basis of your trading strategy, make sure to work out your own strategy and when trading always spend majority of your time on risk management strategy.

Nike Monumental Macro TA FindingsHi guys! This is a look into Monumental MACRO developments occuring in Nike stock market structure, some of which are happening for the 1st time in history.
For this reason and in my opinion, its a very important time to keep eyes on Price action.
The aim is to briefly go over what those developments are and what it may mean for NIKE's Current market trend. Hopefully providing insights for investors.
For this analysis, we are looking at Hieken Ashi candles on the 6 month timeframe.
Note that: Our current candle will close in January 2024. So it has alot of room to change by the time the candle closes.
Ive chosen Hieken Ashi candles to provide clarity in patterns of trend that occured in Nike's History.
Our major development is that we have broken down BELOW and confirmed resistance against our MAJOR MAJOR Historical Support Trendline for all of Nike's Market History.
This is the 1st time we have ever done this.
It warrents caution as this signifies Major Trend Change, perhaps even macro trend reversal.
While we were above the Spport line, we knew that everytime we came down we would atleast test that line.
Now that we are BELOW it, we need price to find the next support.
Currently ive highlighted by a Black Support Trendline, that very support area. We've maintained support since January 2020.
This line coincides with another black line that marks Resistance.
When combining these 2 black lines, we have ourselves a Symmetrical Triangle. That is very likely to play out sooner or later.
If we are able to break above it, it may be probable for us to get back ABOVE the MAJOR SUPPORT Orange line, continuing our Uptrend.
If we break below, further declines will occur. Further supporting the idea of a Major Trend Reversal.
We are also currently at 4 Red candles in a row. If you notice previous history, 4 in a row has happened only 1 other time. July 83 to Jan 85. And also notice that the 3rd candle of the sequence indicated market bottom with the 4th candle printing a higher low.
Can that be the case for us now? Maybe but things in the past don't have to repeat.
Being inside of the symmetrical triangle, 4 red candles in a row would warrant me to NOT take any investment positions.
In my opinion, if we break out on the upside of the symmetrical triangle and preferably get back above "Orange support line", would i consider taking positions.
I think as of now however, we are at best more likely to either move in a range/ sideways or see further declines as the worst case.
Why i think this, is because of the STOCH RSI.
Notice how we are below the 20 level with a bearish cross/signal.
The last time we did this, we were in here for multiple years which led to moving in a range for many years before continuing to make all time highs.
Within range our, price dropped from the top about 67% to bottom of the range.
If we continue the previous pattern, the same is likely. Hypothetically, we can also drop 60% to $70.00 level, which is a support area.
For that to not happen we would need a BULLISH cross ABOVE the 20 level.
Also notice the RSI, we are currently at the lowest level in all of NIKE history. We are also in an RSI range that coincides with sideways or range bound action.
__________________________________________________________________________________
Thank you for taking the time to read my analysis. Hope it helped keep you informed. Please do support my ideas by boosting, following me and commenting. Thanks again.
Stay tuned for more updates on ETSY in the near future.
If you have any questions, do reach out. Thank you again.
DISCLAIMER: This is not financial advice, i am not a financial advisor. The thoughts expressed in the posts are my opinion and for educational purposes. Do not use my ideas for the basis of your trading strategy, make sure to work out your own strategy and when trading always spend majority of your time on risk management strategy.

A look into Shake Shack's Macro Trend, Bullish or Bearish? Hi guys! This is a Macro analysis into Shake Shack (SHAK).
We will assess various developments occuring in the charts, shedding some light into whether we are in a bullish or bearish overall trend.
The analysis is done on the 1 Week timeframe.
When looking at the Price action of Shake Shack.
We have recently been REJECTED from a Major Resistance Trendline (RED line).
This line has been acting as resistance since Feb. 2021.
NOTE: This trendline indicates our current TREND. That is we are in a downtrend until proven otherwise. That proof is breaking ABOVE and CONFIRMING Support on this RED line.
Also NOTE: This is our 2nd touch point of this RED line. In trendline theory it states that atleast 3 or more touches are required on trendlines for them to weaken enough for a break to the opposite side.
So it makes sense that It has pushed us into another downtrend that has recently broken down below the 21 EMA (Purple moving average).
We are now rapidly approaching a SUPPORT test on the 50 SMA (Green Moving Average).
It is crucial we find SUPPORT on the 50 SMA and Horizontal Black Support line.
If we can't we risk falling to the "Major Support Trendline".
Which also risks another DEATHCROSS. Notice the slight downward curve on the 21 EMA.
Having a DEATHCROSS occur can bring in momentum to even push Prices below the "Major Support Trendline".
Our MACD indicator has also CROSSED Bearish with signficiantly increasing RED histogram bars. This signifies an increase in bearish momentum.
To maintain Bullish trend, we need to stay ABOVE the 0 level on MACD and have a BULL cross with the print of GREEN histogram bars.
We also MUST maintain Support on the 50 SMA, eventually CONFIRMING Support ABOVE 21 EMA.
Notice also the GOLDEN CROSS between 21 EMA and 50 SMA, as long as we maintain SUPPORT Above 50 SMA, this has the momentum to maintain an UPTREND.
It can also help us breakout through the Major Resistance Trendline.
Also take a look for reference at our previous REJECTION of this Major Resistance Trendline.
(Orange arrow)
Notice how we ended up testing Support on Green 50 SMA, bounced upwards but ended up coming back down and breaking down, printing the death cross and falling 72%. There is nothing saying that we cant do a similar move but theres also no way of knowing that it will play out exactly as past history.
Thats why we need to be level headed and take it 1 step at a time.
So in the coming weaks our current direction of price action is to TEST SUPPORT on the 50 SMA and the Black line Support CONFLUENCE first.
This area is CRUCIAL area that will determine whether we go back to RE-TEST either:
1. RED Major Resistance Trendline above.
2. BLACK Major Support Trendline below.
If we re-test the REDline that will make 3 touch points, and we will need to observe whether or not we break through.
If we re-test the Black Major Support trendline, we risk breaking down which may cause further price declines. But note its a Major Historical Trendline so it can make monumental buying opportunity provided we get back down there.
__________________________________________________________________________________
Thank you for taking the time to read my analysis. Hope it helped keep you informed. Please do support my ideas by boosting, following me and commenting. Thanks again.
Stay tuned for more updates on SHAK in the near future.
If you have any questions, do reach out. Thank you again.
DISCLAIMER: This is not financial advice, i am not a financial advisor. The thoughts expressed in the posts are my opinion and for educational purposes. Do not use my ideas for the basis of your trading strategy, make sure to work out your own strategy and when trading always spend majority of your time on risk management strategy.

Are we out of the woods yet? The following assumption is quite simple. A close on the monthly chart on any investment instrument is hugely important, and the one we are going to have for BTCUSD in August could potentially dictate the upcomming macro picture.
After the peak in 2017, the market had simmilar reaction in which price fell relatively sharp, followed by an unsuccessfull rebound to prior ATHs.
Last cycle macro stages (*on price alone*) :
BTC prints an ATH fueled by some sort of impulse move.
Fails to sustain the price at these levels.
Breaks to the downside, below the fast MA
Rebounds just slightly above the fast MA - not enough buying pressure
Falls around 60% from the rebound to the fast MA - creates a bottom (and a solid entry on next cycle.)
On the chart, I've plotted what I am seeing currently - we had the top at ~64K, followed by drop below the fast MA, and we are currently trying to rebound for potentially another drop lower - coincidently, if we drop around 60% once more, it seems to be in a very logical spot (where prior ATH from 2017 and the last monthly candle of 2020 - and the first candle after the BO - meet. (~$18.5K)
Of course, this does not mean we are going down, but there seem to be logical reasons for a further drop - and if we dont close this monthly candle on a strong bullish note, I think having a bearish bias would pay off better, and easier.

All Time SPX Fibonacci ChannelFibonacci channel with zero line stretching from 1942 low to 1974 low, and 100% at December 1961 high. The chart is in logarithmic scale.
A few interesting things to point out:
1. Price only surpasses the 100% level during the dot com bubble and 2021-22 when the Fed's money printer was running wild (another bubble).
2. Price between the 78.6% and 100% level seems to coincide with low to moderate unemployment and average to above average GDP growth, however this is a generalization. There are instances where price remains above the 78.6% level during mild recessions (1960), and there are unexplained events like the "Kennedy Slide" where price dropped close to the 61.8% level even though unemployment was moderate and GDP growth was well above average. But in general, if price is below the 50% level, it's during tough economic times, like the 1970's. When the economy is in at least decent shape, we tend to stay above 61.8% at least.
3. Price almost reaches 100% level again in 1965. In 1997 it tests it before breaking through it in '98. In 2007, 100% level was reached, right before the Great Recession.
4. When the dot com bubble burst, price fell to the 61.8% level. March 2020 COVID low fell to the 50% level. 2022 low fell to the 78.6% level.
At a minimum, the channel provides me a way to better visualize the long term trend.
Be sure to zoom in.
Do you believe we'll fall below the 78.6% level in 2023? Let me know your thoughts.

Cardano - Updated Charting 06/02 with Bottom Target Buying Zone Cardano enjoys a sweet dead cat bounce before moving further down finishing wave 5 (.30-.10) before moving upward towards ATH.
Headwinds to take into consideration BEFORE investing in what they identify as risk on investments:
Jamie Dimon's Hurricane Comment: www.cnbc.com (People should take not coming from Jamie, potential significant heads up)
Latest ISM Report (May 2022) BULLISH FOWARD GROWTH: www.ismworld.org
April Jobless Claims in at 200K (Extremely low) : www.cnbc.com
Latest PPI Report (April) 11% www.bls.gov
Latest CPI Report (April) 8.3% www.bls.gov
DXY: Upward momentum since 07/2021 (Up 17.29% from 89.47 - 103.57 (Trending now around 101-102.xx)
Ukraine War
Crude Prices: Macrotrends
Covid / Monkey Pox / Viral flavor of the month (Fear Tactics)
Supply Chain Challenges
Manufactured slowdowns of goods...for example China closing key manufacturing plants in an attempt to retain pricing power.
Continued FALLING YEN! (Danger Zone)
BTC.D Dominance! (46.78% Currently) Up from 39.26% in Jan 2022
Housing: Who would have EVER thought the CURE of the housing shortage was higher interest rates. By some sort of miracle, there's no longer a shortage! www.thetitlereport.com
*** CAUTION *** There are significant CRACKS in housing, especially in those areas that enjoyed MASSIVE double-digit gains in most recent years. Looking for WALL ST corps to dump asset inventories as to not carry negative appreciative assets on their balance sheets. 1 out of 5 homes on the market currently has price reductions already. Look for significant additions of inventory VERY soon as even more people are priced out and corporate landlords like BlackRock will be looking to offset their portfolios not gain. The FED also looking to sell MBS (Mortgage Backed Securities) instead of buying them, will force lenders to keep more mortgages on their balance sheets (They are already adjusting for tightening lending requirements. REFI markets with even higher interest rates are almost completely DEAD. Mortgage companies have already begun restructuring (layoffs) of many mortgage personnel.
Looking for a 40-50% reduction in housing prices (Generally speaking, go back to 2016 / 2017 and add 5% to those sales prices and that will provide realistic guidance of where the housing prices will retrace to.
ALL of the above is strictly entertainment and not financial advice. ;-) GOOD LUCK EVERYONE!

Can we expect more inflation? A look US Consumer Price Index.We are living in very uncertain times. I wanted to provide a couple of view in order to understand the current market situation better and determine a strategy going forward.
So I have created a US consumer price indes YOY% chart.
We have not seen such high interest rates since the 1970s when demographics created a demand shock and oil embargos and Iran crisis created a demand shock leading to high inflation.
Today, respectively as a result from 2 years of Covid-19 (measures) and now a war we have seen tremendous supply shock.
Now can we expect the peak of the inflation fear has passed?
Will we see a slow growth and a declining inflation?
Stay tuned for more charts....
--------------------------------------------------------------------------------------------------------
** Please support this idea with your likes and comments, it is the best way to keep it relevant and support me. **
--------------------------------------------------------------------------------------------------------
!! Donations via TradingView coins also help me a great deal at posting more free trading content and signals here !!

Global vision of BTC according to Market Phases TheoryHey mates,
When the market behaves unexpectedly and many people lose their money it is the best time to calm down and take a look at the market globally and historically.
Market Phases Theory comes from the roots of the Dow Jones theory of Stock Market Cycles. Basically, all markets are passing 4 constant market phases:
1. accumulation
2. uptrend or markup
3. distribution
4. downtrend or markdown
Before making any decisions it's crucial to understand where we are now and we do we go. Let's use the method of elimination.
So, today, on April 12th, we are obviously not in the Uptrend or Advancing phase. We are not in the Distribution phase too.
Are we in a Downtrend or Declining Phase? Maybe, because 6 months ago we hit All-Time-High. Maybe not, because we are still in a macro bullish trend since 2020, for 2 years by now: higher lows - higher highs.
Are we in Accumulation Phase? Highly probable.
Take a look at the Chart. After a rapid downtrend, we stopped at a particular level of 33000-34000, and since then we're defending this level and moving to ascend.
The Point-of-Control of the last 18 months shows us an important accumulation level on 38888, where we are today.
Of course, the global economical and political state is not optimistic, there is big tension and uncertainty.
We've got a Black Swan of Russian Military Aggression on Ukraine and the whole world.
The US is trying to fix things it was done by printing unlimited money and ignoring inflation risks.
So there are a lot of factors that can bring us to a continuous downtrend leading to the bottom of nowhere.
But until we're in a macro ascending trend and holding above 35000 - we may say it's still an accumulation phase. Otherwise, we would say about degrading market and falling under 30000.

ETH/BTC Looking Bullish! Alt Szn incoming? ETH is at local resistance + a high volume node, trying to break out and confirm an Adam & Eve bottoming pattern and continue it's macro uptrend. If it breaks above this area, there is lower volume above which means it will face less resistance if/when it moves towards the upper trend line. We're also seeing increasign volume on increasing price - also bullish.
ETH/BTC chart is important, not just so you can balance your long-term portfolio towards whichever is outperforming,
but also because ETH/BTC is a powerful indicator for the strength of Altcoins, in general. When ETH rallies (and BTC.D falls), alt season is on-- so don't focus solely on ETH; there will likely be other coins & small caps that outperform it in these mini alt cycles, if you know where to look.
It's hard to ignore the doom and gloom of macroeconomic factors that have beaten down the markets recently, and those of us who have been around since 2017 may be suffering some PTSD from the hopium rallies at the start of the long bear market, but there's good reason to believe we wont see such a long/devastating bear market again. Nobody knows, so try to focus on the PA.
Charts are looking bullish, so maybe it's time to be bullish. Even if it's short term, there's lots of good trading that can be done in these mini cycles. just keep stops in place and don't get rekt.
happy trades
CD

This idea is holding up surprisingly well.I made this chart months ago with a massive flag being printed on the macro scale. This is show on the daily here but is better viewed on the weekly. If this continues to hold up, we could see a major rally, heading into q2. IMO

NZD-USD Fundemental and Macro AnalysisThis weekend's market is expected to be relatively quiet.
They will not produce large effects or move, and they will most likely not affect all pairings.
We should proceed with caution, but the New Zealand dollar and the United States dollar have a very high possibility of gaining ground because of recent performance and statistics that I have obtained.
After that, I'm going to stick with this currency pair for the weekend.
Everyone should use caution, even if they have high expectations.

EUR-NZD - Macroeconomic, Global Macro... FINALThis is the ultimate score of my previous three weeks; I'm not sure what will happen next weekend; I have a lot of work to do today... yet as I sit here and watch all of this, I feel stunder. I'm at a loss for what to say... is just untrustworthy.

EURNZD - Macroeconomic, Global Macro...I will simply follow up on the previous two weeks with fresh and stronger knowledge, which I will get at the Microeconomic Information/Fundamental Analysis stage of the process.
Things are rather straightforward; I don't need to say much since figures speak for themselves, and you can see my previous notion, which I have already shared...
If you see the same things I do, please share your observations.
Thank you very much!

Monthly RSI Hidden Bearish Divergence confirmation.Lets not forget this little bad boi either!
Hidden divergence is indeed considered an indication of trend continuation, but have a look at the bigger picture here.
Eeeeeeven if BTC remains bullish on the macro trend, this confirmation of hidden bearish divergence could see a comparatively massive pullback. This would fit the "Expanded Flat" paradigm mentioned in my other post today. After a redonkulous 91 level on the monthly RSI one could expect the old dog might be a bit clapped out and in need of a rest.
With 2 touches on each side, Bitty appears to be in a positively gigantic Ascending Broadening Wedge. A 3rd tap on macro trend support due to Hidden Bearish Divergence could see the asset return to 15 or 20k... or LESS!
The Ascending Broadening Wedge is known to be a continuation pattern, so if this scenario plays out the measured upside move is astronomical. But honestly, this will take years and years and years. A lot can happen to change the course of history in that time, so who knows!?
Food for thought anyway.

BITCOIN - Keep It Up Bulls!!Hello everyone, rouzwelt here
Well we are seeing some interesting moves from bitcoin recently, as price managed to shoot straight up through 35k resistance level to 39k without any reaction from bears. If you have been following me you know that I've been pretty vocal about the general weakness in chart and the lack of demand and that these reasons may cause bitcoin to crash even more and bring all the crypto market down with it. But at the end of the day I can't predict the future, I'm just focusing on the probabilities and position myself on the most probable direction. But the more probable direction doesn't always play out and you get one of these F*** YOU candles every once in a while in crypto space as it is not yet matured enough like other markets and these high volatility events mostly happen when the liquidity is low, just like the current moment.
Price has done some good bullish actions in last few days, but the point is that nothing has changed much since this pump initiated, technically and fundamentally. As you can see we are still in the 30-40k range, and we are also below the main blue down-trend line formed from our macro highs. As you can see in the screenshot below of my last post on bitcoin daily timeframe (Link: ), price has recovered some of lost levels quite like my projection, and I also have been talking in that post about the importance of the 42K and blue macro trend line, which are the 2 most critical levels for btc to break if we want to see higher levels again, and right now if price manages to head high in the coming week or so, it can actually test those 2 levels at the same time and break above them, but until that the macro trend is still toward the downside and even if price breaks those 2 levels, it still has a great chance of rejection, as we need to see a macro higher high getting printed above our last macro high, but there are great trade opportunities on the way, so bulls still have a lot of work ahead of them if they want turn things around.
I also pointed out there that the triangle formation gets invalidated if price manages to break and find some support above it, so then the rectangle formation becomes the main chart-pattern formation which traders will pay attention to. I also talked about the possible sideways movement until price reaches to the macro blue trend-line which would be the most bullish scenario for btc in my opinion. So I still believe in what I said in that post until it gets invalidated.
Last night I updated my last post and said that I'd be looking for a short trade entry point when price reaches to the 35-36.5k area, but it's good that I didn't find any as price has cut through that area, but I still think that there a good possibility that we see a decent pullback after this pump, and if that pullback manages to hold above the triangle then it will be good entry point for a long position, but at current moment I don't see any entry point for a long position as price has risen so much and entering here brings a great risk with it.
We still need to stay cautious as this pump has come mostly as a result of low liquidity which you can clearly see in the bars' volume, so the chance of it being a fake-out to cause the maximum pain is not low.
At last I'd like to mention again that at these market situations, risk management becomes even more important and shows its real value, as this whole range's price action was and is haunting many people's Stop-Losses as I had said in my last month post (article link below the post). I have taken some trades in this range and most of them stopped-out at break even after securing some profits before it turns around and I had the ability not to lose any and gain some with good risk management. So I suggest you to practice risk management excessively at this stage.
I'll be posting about my next trade setup idea soon as I'm looking to enter aggressively when I see a good entry point, no matter which direction bitcoin goes, so stay tuned. And if you find this post helpful then consider supporting me by hitting like and comment if you have any opinion about it, I'd would love to hear your opinions. Have fun and trade safe.

Possibly a good High risk playThese are fairly low and that is a real deal when considering that we may be experiencing a spec bub. Possible inflation hedge along with GME

What is cooking for BTCUSDBased on my understanding of INDEX:BTCUSD macro direction, this chart shows the three significant parts of the market cycle:
- Forms a low after capitulation ( due to news, potential regulations, deleveraging on exchanges etc. )
- Creates a fast and parabolic run for several months ( diminishing returns each time )
- Market falls hard after creating a significant ATH multiple times greater than the previous one
- After finding a bottom Bitcoin spends majority of the time in an accumulation stage until it reaches prior ATH.
Cycle repeats;
So far we can see only 4 cycles, if we include the current one. In the scenario the current cycle would follow the same overall market structure as seen previously, my bias would be towards the bull side of the market.
Bull case:
Currently the opinion of market participants is that we should see another leg up, with some projecting 100K, others 300K targets.
DXY may continue to lose strength towards the end of the year, allowing for BTC to gain momentum potentially.
Prices of -50% should be tempting to some bigger investors and institutions.
Bear case:
Opinion of the masses is often the wrong one - hence we could have already seen the cycle peak ;
Adding confidence to the contrarian viewpoint - the current market ATH is well aligned with the previous market peaks ( s3.tradingview.com )
From a pure technical standpoint, the current ATH had formed an area of trapped long-biased traders, suggesting that it would not come to revisit the 55K+ prices any time soon; on top of that, on the 1W chart I've noticed some time ago that there is not 1 but two extremely strong reversal patterns - Head and shoulders, together with a Double Top (within the head of the H&S). Generally on such long timeframe one pattern is a confirmation strong enough, especially of that relevance - in this case we have two, which have already been validated as well. Here are my analysis prior to the drop, I wasn't really sure it was going to play out like that but.. I guess it was time to happen anyway. ( 1/ s3.tradingview.com ; 2/ s3.tradingview.com )
Generally, those patterns hold for around 100 candles - in this case around 100 weeks before the market bottoms?
Additional confluence - Wall Street cheat sheet - the emotional blueprint seems to be playing out so far - if this is so, we are currently to see "back to normal" where 43K-45K might be the LH before the second leg down.

looking at BTCUSD from a higher timeframe perspectivelooking good tbh
long, set tp 8.2 x 10²⁰ of chosen currency, 4 years
gg
text

Macro Trend on the Global Market Cap (excluding BTC)The last post was inaccurate.
According to this fractal, we could see another 40% growth before the panic selling begins. The fractal also shows us that this panic selling could begin in early-mid March. However, fractals tend to assume no external factors, such as mass adoption, could be at play - so take this with a grain of salt.


Ethereum it's confirmed; it's bullish once again more!!!At the moment, Ehereum it's moving into this bullish channel that we formed in H4 timeframe. Waoh, so, as I cancelled so wrong my long position becuase as we see in the chart that Ethereum make descense of the price. Right now we have a great opportunity to bought Ethereum at $1,307 dollar. That it' my buy order limit. At the moment, I put again my buy order limit at $1,307 USD toward the $2,000 dollars. So, in general the trend it's extremely bullish
And looking the Daily chart, it's show theat Ethereum it's bullish in medium term that we can to go to the way of $2,000 dollars
So, I follow more the Daily chart based in the technical analysis in macrotrend toward my goal.
Good luck in this position
Guys, if you like my trades, please share this analysis with your friends, traders or anything that need help of the cryptos trades operation.
And tomorrow, I will going check out the Ethereum and Bitcoin dominance to know f we have any altseason soon. And i will going to talk about more of Chainlink becuase I thinking to bought just 100 coins of Chainlink approximately to hold in the next bull rally and how Chainlink it's goes to earn good profits in this investment, and also, I will going to talk about in Cardano becuase I thinking to accumulate more Cardano
