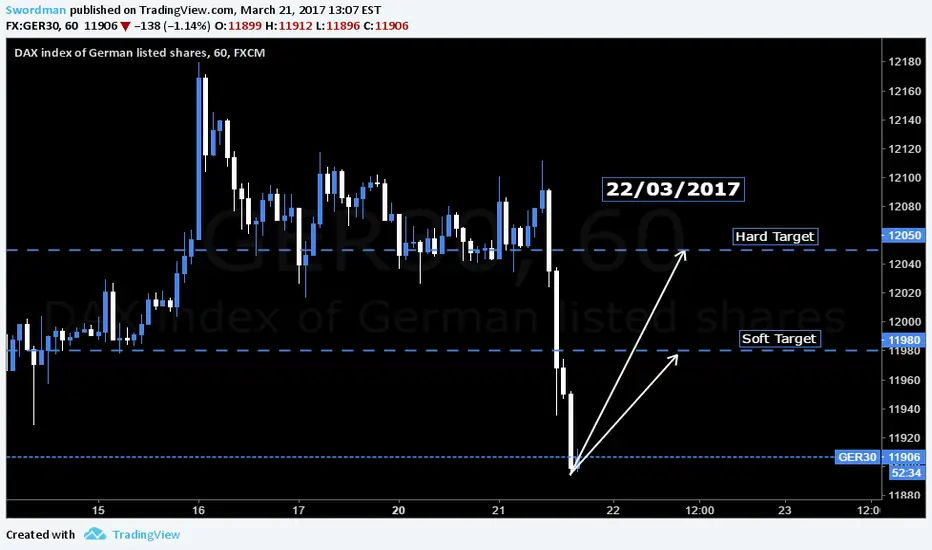
22/03/2017 DAX LONGTomorrow I expect bullish day. My first target( soft target has 11980. My Hard target 12050. good Trading
March
Next's week Boom // Short EURUSD!
EURUSD is currently forming a strong short, its very expected to stay short for the next 3 or 7 hours next week, which can make us profit between 200 pips.
I will be updating this chart as time goes by. It'll surely be a good trade. Stay tuned!

DAX 16/03/2017Tomorrow I expect to see a strong fall of the DAX at least until 11950. I think we can see the emnos a fall to 12000 with some ease. Then you can make the move slower to get to 11950. Good trading
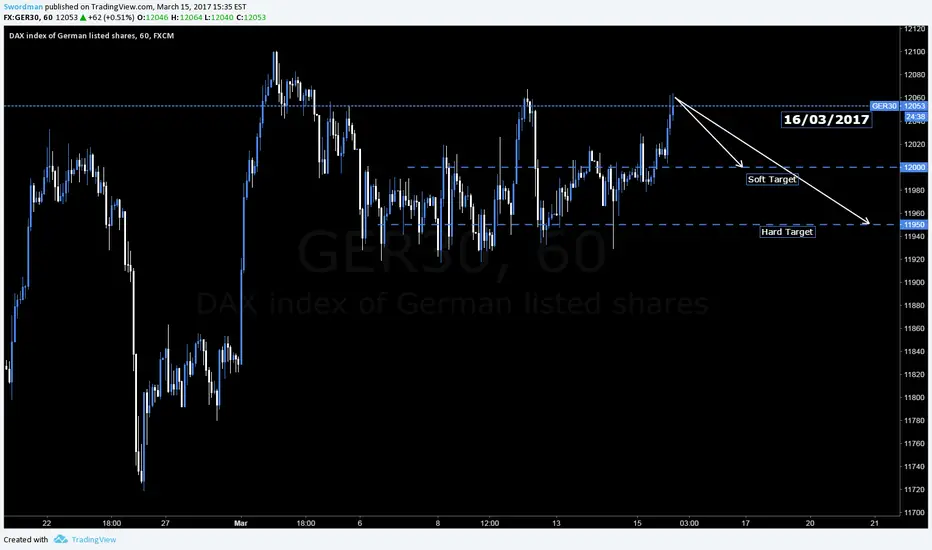
DAX 15/03/2017tomorrow i think we will see fall DAX. I expect to see a strong drops to level 11900, but will depend on how quickly the initial decline to 11950. If have a rapid decline to take soft target we can take a surprise seeing reaches close hard target. Good Trading.

DAX 14/03/2017tomorrow i expect downtrend at begining to take 11975 less or more and after go uptrend to take 12025. Good Trading.

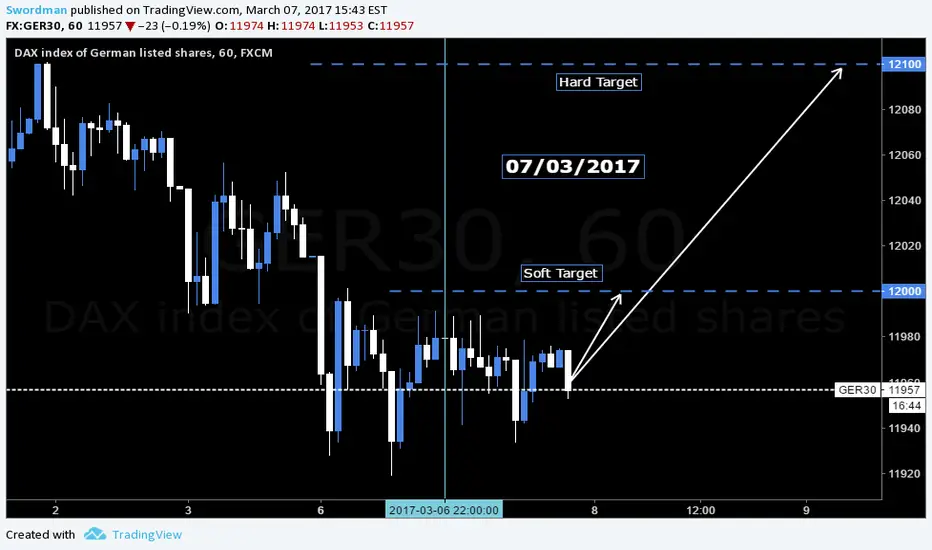
13/03/2017 LONGTomorrow i expect short open but after 2 first hours i expect bullish reaction to take soft target on 12025. If thye take this levels quikcly is possible to rise upe far away to 12075. If 12025 has slowly to take i close position and preapre to bearish positions to Tuesday. Good Trading

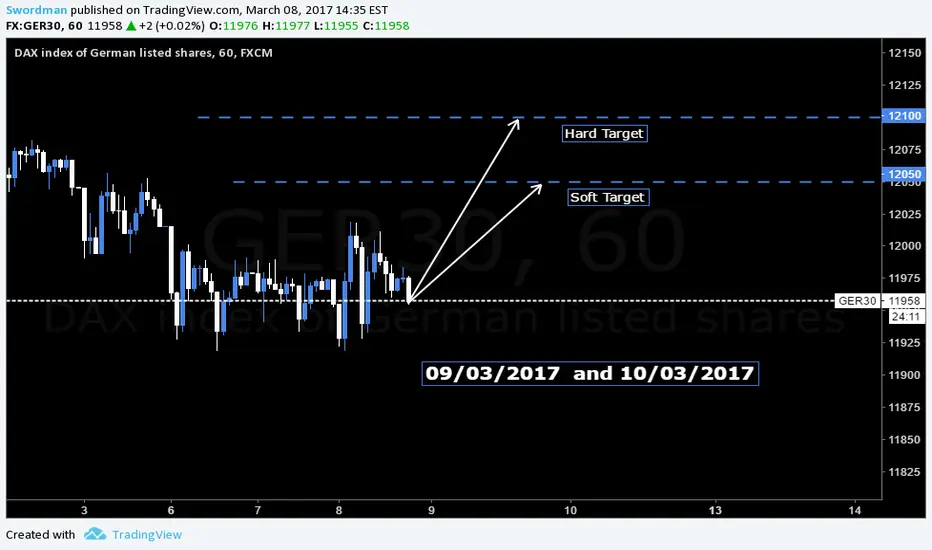
DAX LONG 9/03/2017 and 10/03/2017By tomorrow I think we will see something similar to the opening this morning. It will start a first downtrend, which would be good to be alert in the first two hours of opening the DAX to take bullish positions if we do not have them already open. From the two hours I think we will see a similar rise to today, although somewhat slower but with a clear trend until 12050. From here and surely already reaching the vierens we will be able to see the reach of the 12100 but of form More erratic and punctual. Have a good trading.
USDJPY accumulating below 114.95/115The Dollar is extremely well bid against the Yen as we head into Non-Farm Pay Rolls and may even break higher before the number. We are anticipating an eventual move to 117 - 117.50 over the coming weeks, however, the path higher is far from clear.
Initial resistance is 114.95/115, already tested earlier the session. The figure could well go today, but further resistance lies just ahead; with 50% of the down-move at 115.12. Beyond there, we have the 115.40 - 115.65 zone, which sparked two bearish reversals in late January. Assuming an in line jobs print, this zone seems like a logical target for end of week. In the event of a substantially stronger than anticipated jobs number; we see a move to the 115.95 - 116.25 zone, marked by the 61.8 fib at 115.94.
Initial support is today's low around 114.25, with more important support seen in the 113.55 - 113.80 zone, and a breach of there invalidating our bullish bias.

DAX Long 8/03/2017Tomorrow the DAX will surely start in bearish trend. I think it will not get much further than position 11940. After reaching that level we will see a recovery of the DAX close to the level 12000. If that rise occurs quickly then it is very possible that we see the DAX reach again at levels of 12100 On the contrary, if the climb to level 12000 is slow we will surely not see a rise beyond the soft target.
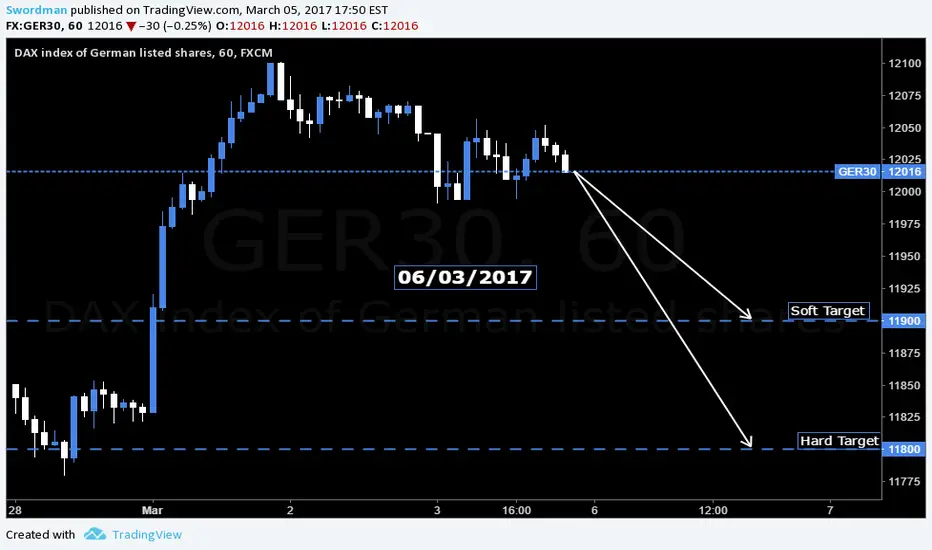
DAX Short 06/03/2017Monday DAX go short to take 11900. AFter, if have a quickly bearish movment is possible to take hard target on 11800. If movemnt has slow to take soft target has a more probability to go bullish. Good Trading.
Dollar bulls attempt bounce from former resistanceUSD bulls are currently attempting a bounce from former resistance in the 101.05-101.30 zone after French election worries rattled the Euro. The index traded above the 61.8 fib briefly last week, but was rejected at the top of a zone which we had previously deemed inconsequential and finished the week back inside the wedge.
Our preference is for a break back above the wedge top in the next few hours, followed by a retest of last week's highs in the 101.90-102.25 zone over the coming sessions. If however, the DXY fails to clear resistance, we may be looking at sideways consolidation til later in the week when NFPs clear things up.

Connors' Price Action Analysis // GBPUSD LongHi traders.
GBPUSD is currently forming a strong short near the 23264, its very likely expected to stay long for the next 3 or 4 hours, which can make us profit between 140-170 pips, because thats what I aim for. I care about pips, not profits as most traders do. Its what brings me money in long term.
I will be updating this chart as time goes by. It'll surely be a good trade. Stay tuned!

DAX SHORTtomorrow and Friday i expect downtrend. First Target on 11900 and second target near 11800. I expect slow movement tomorrow and fast movement on friday. Good Trading.

Dollar Index gaps into interim resistanceThe DXY US Dollar Index has gapped into interim resistance following an intense round of FEDspeak seemingly aimed at boosting expectations of a March hike. Chance of a March hike was less than 33% just a few weeks ago, but both voting and non-voting members have embarked on a full blown communications offensive over the past week, pushing expectations up above 60% - The FED has never hiked when market expectations were below 70%.
The index has cleared a major resistance confluence zone and looks set to continue higher over the coming weeks. Interim resistance lies just above here in the 102 round region, marked by Monday's high of 101.97 and the 61.8 fib at 102.07. A breach of there would target zone confluence near 103 round, with the 78.6 fib at 102.84 and the January 11 high at 102.95.
The 101.40 - 101.80 zone, marked by the broken wedge top and 50% level at 101.53, should offer solid support over the coming sessions. A breach of 101.40 would suggest a false break and invalidate our bullish bias.

GOLD FOR NEW MONTH OF MARCH GOLD IN MARCH TECHNICAL REASION
GOLD TO NEW MONTH OF MARCH STARTING GROW
TO TOUCH 1328.03 AND MORE TO 1373 MAYBE
WAIT AND WATCH THIS
BUY GOLD OF HAVE SMALL OF RISK INVESTMENT
BUY GOLD IN MARCH

2017 March Oats creating a Bullish Cypher PatternMarch Oats may form a bullish Cypher in the coming weeks. Look for retracement between 38.2 and 61.8, then rebound to 113 - 141.4 percent of the XA leg. If it falters and continues to 78.6 or below this retracement, pattern may change to a Bullish Butterfly.

March Oats finally correctedMarch 2017 Oats finally retraced back to the 50% level of the last move. Look for rebound around the 50-61.8 level. Oats is still overbought, so potential to move sideways or further down from 61.8-78.6 possible. Still bullish to fill gaps from last year. Next move to 256 if bulls can keep control.

Predictive Analysis of the Next Megabull Cycle - Update 2Hey all, I have been pretty busy lately and found the time to give you all an update! After visiting $445 we revisited the bottom of the triangle at $400-405 which strongly held as no sellers were to be found to take us to $320. Bears failed and Bulls won that last round. Which leads us to a big potential for the megabull cycle to occur on March 25-27th as we make our way to $435 (top of triangle).
Bulls:
After rearranging the fractal and aligning it properly with our current triangle we can see that were spot on the last pump within the triangle before we break out of the triangle. Initial top of triangle is $435 on Bitfinex and if all goes to plan we will blow past it to $450-448 then go back down to retest $426-421 before the megabull picks up steam and moons.
From there we have several potential targets but the fractal goes to $8100 per BTC which I find exaggerated.
My more conservative targets are: $680-700 and $900-850 and $1500 and $2500
Bears:
For now the bears do not have a case in my opinion as $400 held as support and we had no new lows. However, note that if March 27th passes (give it to March 31st max) and we fail to break the top of the triangle ($435) and reach $450, then it is highly likely that the megabull cycle failed again and bears will take over. If I see a change I will first post on my twitter account and then follow up with a new chart when I have time on TV.
I am here to help. Feel free to ask me questions or Private Message me directly.
Also follow me on Twitter: crd.ht
Where can I register and buy/sell/trade Bitcoin?
Bitfinex Signup: www.bitfinex.com (Accepts Worldwide users)
Okcoin Signup: www.okcoin.com (Accepts Worldwide users except US residents)
SimpleFX Signup: simplefx.com (Accepts Worldwide users)
Coinbase Signup: www.coinbase.com (Accepts US Residents Only)
BitMEX Signup: www.bitmex.com
You can support me by joining under my referral any of the above Bitcoin exchange. If you join Bitfinex under my referral you will get %10 discount on your trading fees the first month!

EURUSD HI LEVEL TRANDING P'LAN We find basicaly two main trades for this month. You can trade the buy in option A or B and deal with the sell trade with "I" trade (if trade A or B are finaly happenning)

Daily Tues March 24 2015Buy volume has increased but not as much as sales volume.
The price has begun with a sell volume 1/4 higher then previous with already 3x the price action.
3x day previous
hi 271
lo 255
previous swing
hi 271
lo 247
the day has already breached recent low's

Daily Mon March 2014Sale Volume spike on 03-18 decreased the price to 248
Recovery ever since as the market begins to emerge.
Fat Buy Candle on 3-22
3x prev
hi 270
lo 255
previous swing 3-16 to 3-19
hi 295
lo 246
