Ripple Buy Idea #xrpRipple is an interesting cryptocurrency that work with banks and with good partnerships.
Doble channel and a probability of a spike to 0.80 cntvs and a good bull market easly up to 1.50 cntvs
For HOLD trading: sell 20% in 5$
For meduim term trading: Sell 10% in 2.50$
For margin trading: Sell trade in 1.50$
Margin

BTCUSD long entry setup Long entry requirement.
*position size accordingly
1) Watch Volume to confirm successful breakout
2) Wait for price to retest the prior resistance trend line
3) Candle stick to close above the trendline
Good luck and safe trading.

$BTCUSD - Looking bearish short term, shorting opportunity$BTC has been unable to breach resistance, going sideways against it. If it continues to go sideways, eventually it will tire out and we'll drop to support; the next supports are around $7700, $6900, and $6300. Although there is no support line around the mid $6000s, it is fully possibly for a rebound around that area due to how cheap it is and close to the bottom.
On the 5m interval:


Short Yen Market Recovery TradeYen is uaually treated as a safe haven. Money may continue to flow out of JPY if the market continues to recover.
Good fundamental and technical tailwinds

BTC margin long volume vs price on BitfinexAfter calling the recent drop from 12k to 7.9k , I got the sense that BTC hasn't bottomed yet despite many calling the bottom. So I started looking for other indicators and pieces of data that may corroborate this hunch.
Initially I started looking at the long (BITFINEX:BTCUSDLONGS) and short (BITFINEX:BTCUSDSHORTS) positions on Bitfinex as a way to gauge when to exit my margin positions. However, as I went back over the data we had (which admittedly isn't a great deal as Bitfinex only started providing the data on the 20th of August 2017), I started to notice that we topped out at around 32k of BTC longs. This coincided with a couple of major selloffs, including the last drop from 12k, and the prior one from 20k.
Im not sure if this is a glass ceiling, or a hard cap, however it seems pretty clear to me that we are seeing divergence of BTC price vs number of long positions. ie. price is going down despite an increase in longs.
I feel this provides some evidence towards the idea that we will push considerably lower due to a "long squeeze".
I also mentioned a few days back in my prior post that if we close the week below the weekly 20EMA, we will head lower to the 50MA for support.
A few days back
Now
I believe we are going down to between ~6k (+/- 500).

Short term BTC long playI have been in USDT during this downtrend. Looking at the 4 hour we seem to have corrected. If you look back on the BTC chart during corrections. It loves the pattern known as Adam Eve. You can read about it here. thepatternsite.com It is a useful pattern to learn. Once you learn it you are able to spot it and make long plays. They dont always come off, but are a good indicator of a trend change. My target is shown on the chart and will re-evaluate whether to stay in BTC or change back to USDT at this point.

Steller short opportunity.I have been watching Steller for a while now, trying to learn stuff. See the linked idea of what i think its a triangle playing out that can go either way.
I am going to play a short here. I always lose on shorts so I will watch this and if it goes against me I'll close it. They can get out of hand and cost you money if you wait for them to turn around.
Going to enter on a short timeframe close to 4600 if I can.
Stoploss of 4750.
Target of 36/3300.
And if it goes down from the triangle, add to the short.


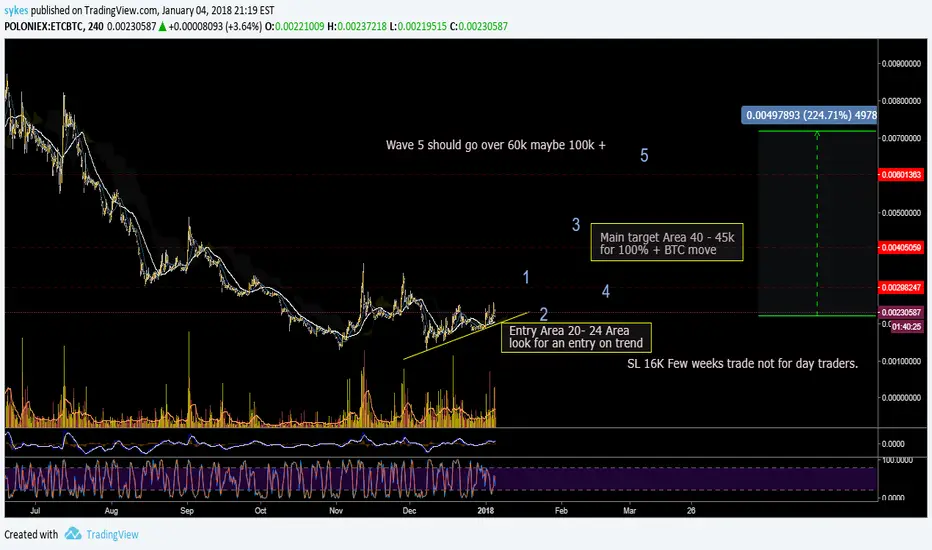
ETC - To the Moon in the first quarter.This is for the HAI charting comp. I am personally playing this one for the next couple of weeks / months.
I think we have started a new cycle with Ethereum Classic. Barring anything crazy happening and using smart stoplosses we can double or triple our BTC / Money with this coin. This is not a for people looking for quick profits. I think it is a good place to sit coins that are doing nothing for you. (I changed BTG for this)
Want to get an entry in from 20k to 24k. I will be comfortable with a stoploss of 16k (bought under 20k so 4kish SL)
Buy close to the trend. 20-24k - get a buy on the hour or 2 hour chart.
TP1 - 30K
TP2 - 40K
TP3 - 60K
SL - 3-4k from entry
Shorterm target is 28-32k
Main target is for 100% profit in the 40-45k region.
You can also take profit in that region and buy again on the retraces around the first target of 30k for wave 5.
Wave 5 I think will go past 60k,before a retrace. By that time we will have made 200% so, take profits and keep a few for some months and they could be worth $100's.

CTR 15min Short Channel Trade. 60% gain with a small risk.CTR Is trading in a channel. I've been trading it the past few days making dramatic gains by just buying at the dips. Right now its in heavy cosolidation so we may see a spike with a drastic short term gain.
Trade with caution. There was a large sell wall that been removed and we should see a massive spike shortly. All indicators are pointing toa breakout. Both CCI and Moving averages.

Bitcoin (XBTUSD on Bitmex) Short Term Target To $19,000+Bitcoin currently making an ABCDE (which is part of the 1-2 waves on elliot wave cycle) on 1 hour chart after it's ABC correction and is gearing up for it's 3rd wave up.
Top of the 3 could be the 1.618 or even higher. If it's the 1.618 fib extension line, could see bitcoin going to $19,000+ short term.


Bitcoin To $20,000 - New Impulsive Wave 3 Starting!I believe BTC has broken out of it's downtrending resistance on the 1 hour.
The correction from $20,000 seems like it has finished by painting an ABCDE correction and now it has started a new Elliot Wave set structure.
New target for this wave set on the 1 hour time frames = $24,000!

Fibs GaloreProbably should've published this when i first charted it to show how well this has been working.
Aw well, let us see how it plays out. I am bearish on BTC at the moment... Let us wait and see what tomorrows daily candle does.

ADL, NAAIM, AAII, MARGIN DEBT for SPX analysis ... NYSE ADL data, NAAIM data , AAII data and NYSE MARGIN DEBT data for SPX analysis ...


Cleared the major long term resistance - Looking for BTC to pass the historic structural resistance - if we do, we should see ATH tested .
Thoughts?

FCT GOING UP!With the update to the factom wallet, volume will be increasing. Bollinger bands are tightening with the candles closing above the midline. If the candles break and close above the top band, we are in for liftoff.


