a BUYSIDE setup at #EURUSD 📌 Market Insight: {#EURUSD }
⚠️ Risk Assessment: {High}
🚀 Approach:
EU Would be OK SAME as #GBPUSD ... we need momentum structure ...
#Ash_TheTrader #Forex #GBPJPY #MarketAnalysis #TradingSetup #RiskManagement #GOLD #Scalper #NQ #EURUSD
Market

$SPY $SPX Scenarios — Tuesday, Nov 11, 2025🔮 AMEX:SPY SP:SPX Scenarios — Tuesday, Nov 11, 2025 🔮
🌍 Market-Moving Headlines
🇺🇸 Veterans Day — U.S. bond market closed, equities open but expect thin liquidity and lower volume.
💬 Fed focus: Fed Governor Michael Barr headlines the day’s lone major event, speaking mid-morning on financial stability and supervision.
📉 Small-business sentiment dips: The NFIB Optimism Index slipped to 98.2 from 98.8, reflecting softer hiring plans and higher cost concerns.
⚠️ Shutdown delays: Broader federal data remains constrained this week — investors will continue watching Fed commentary for policy cues.
📊 Key Data and Events (ET)
⏰ 6:00 AM — NFIB Small Business Optimism (Oct) | 98.2 vs 98.8 prior
⏰ 10:25 AM — Michael Barr (Fed Governor) speech
📉 Bond market closed for Veterans Day; expect quieter sessions and possible afternoon drift in equities.
⚠️ Note:
No Tier-1 data today. With lighter volume and no Treasury trading, price action will likely be headline-driven. Keep an eye on Barr’s tone for any hints on post-shutdown policy or liquidity support.
⚠️ Disclaimer: Educational and informational only — not financial advice.
📌 #SPY #SPX #trading #Fed #MichaelBarr #NFIB #VeteransDay #markets #macro #liquidity #bonds

$SPY $SPX Scenarios — Week of Nov 10–14, 2025🔮 AMEX:SPY SP:SPX Scenarios — Week of Nov 10–14, 2025 🔮
🌍 Market-Moving Headlines
🚩 Shutdown overhang persists: Key October inflation and retail reports remain at risk of delay due to limited government data releases. Market direction may rely on Fed commentary and positioning shifts more than fresh data.
📉 Inflation in focus: The CPI (Thursday) remains the main event — if it releases — as traders gauge whether cooling prices justify the market’s aggressive rate-cut bets.
💬 Fed blitz: Nearly a dozen Fed officials speak this week, including Waller, Williams, Miran, and Bostic, providing clues on how close the Fed feels to easing.
🏦 Veterans Day week rhythm: With Tuesday’s bond market closure, liquidity may thin until the CPI print, creating potential for sharp post-data reactions.
📊 Friday volatility setup: Retail Sales and PPI (if released) will shape the final inflation read-through for Q4 spending momentum.
📊 Key Data and Events (ET)
MONDAY, Nov 10
— No major releases scheduled
TUESDAY, Nov 11 (Veterans Day, bond market closed)
⏰ 6:00 AM — NFIB Optimism Index (Oct)
⏰ 10:25 AM — Michael Barr (Fed Gov) speech
WEDNESDAY, Nov 12
⏰ 9:20 AM — John Williams (NY Fed) speech
⏰ 10:00 AM — Anna Paulson (Philadelphia Fed) speech
⏰ 10:20 AM — Chris Waller (Fed Gov) speech
⏰ 12:15 PM — Raphael Bostic (Atlanta Fed) speech
⏰ 12:30 PM — Stephen Miran (Fed Gov) speech
⏰ 4:00 PM — Susan Collins (Boston Fed) speech
THURSDAY, Nov 13 — CPI Day (High Impact)
⏰ 8:30 AM — Consumer Price Index (Oct) ⚠️ Subject to shutdown delay
• Headline CPI: +0.2% expected
• Core CPI (YoY): TBD
⏰ 8:30 AM — Initial Jobless Claims (Nov 8) ⚠️ May be delayed
⏰ 9:20 AM — John Williams (NY Fed) speech
⏰ 12:15 PM — Alberto Musalem (St. Louis Fed) speech
⏰ 12:20 PM — Beth Hammack (Cleveland Fed) speech
⏰ 2:00 PM — Federal Budget Statement (Oct) | $257.5B deficit
⏰ 3:20 PM — Raphael Bostic (Atlanta Fed) speech
FRIDAY, Nov 14 — Retail & PPI (High Impact)
⏰ 8:30 AM — Retail Sales (Oct) ⚠️ May be delayed
⏰ 8:30 AM — Producer Price Index (Oct) ⚠️ May be delayed
⏰ 10:05 AM — Jeff Schmid (Kansas City Fed) speech
⏰ 2:30 PM — Lorie Logan (Dallas Fed) speech
⚠️ Note:
All starred data (CPI, Jobless Claims, Retail Sales, PPI, Business Inventories) remain subject to delay under the continuing government shutdown. Markets may trade on Fed tone and yield movement in the absence of these releases.
⚠️ Disclaimer: Educational and informational only — not financial advice.
📌 #SPY #SPX #trading #Fed #CPI #RetailSales #inflation #bonds #macro #yields #markets #shutdown #Bostic #Waller #Williams #Logan

Nifty Short & Medium Term Support&Resistance_10-Nov-25 to 14-NovNifty Short & Medium Term Support&Resistance_10-Nov-25 to 14-Nov-25
Nifty 25492
Long call ( Buy) was given three weeks before at 24896, Nifty crossed 26000 two weeks before and fallen to 25337 and bounced back last week.
Long buy Call given three weeks before was reiterated last week with buy on dip for medium to long term perspective.
Quarterly results of companies are being released and so far have mixed results.
As the margins and revenue growth are concern, to be more cautious on picking the right stock and rebalance the portfolio.
Overall, the Qtrly Results and Tariffs deal will decide the future path till Dec - Jan for the Nifty. Since it is a Volatile situation SIP route or buy in multiple parcel route with a goal of 3-5 years will workout. 1st Feb budget and reforms if any will decide Nifty's path.
Some of the stocks to watchout are Warree Energies, HDFC AMC, NMDC, Apar, Sharda Crop, VRL Logistics, krishna Phos chem, Cipla, Dr Reddy and Natco ( Buy on Dip as still there is negative trend), Apl Apollo Tubes, Muthoot Finance ( On Dips) , tata Steel ( Contra Stock due to Business Cycle), Bank of Mah, BPCL, ICICI Bank. Shared for Analysis purpose only.
Hence the strategy can be shifted to long considering medium to long and use the opportunity to buy on dips similar to SIP.
Current Short Term Resistance are 25670 (Jun 2025 High) Should cross this resistance in short term decisively inorder to move up, 26000 and 26269 ( all time high). It need to break the resistance 26269 decisively to move up to 27000 target in med-long term.
Nifty Short Term Supports ( Multiple Supports are there between 25000-25500):
25300-25350 (Two Fibonacci resistance shown ) - Major Support
25500 ( 25441 Sep 18th 2025 High )
25450 ( 25442 is the Aug 2025 high)
25200 ( 25154 Aug 2025 high)
25000 ( Milestone)
Short Term Resistance
1.26098 ( Recent last week high)
2.26269 ( All time High)
Medium Term Support:
1.24700 (Trend Line as shown)
2. 24000-24170 (Fibonacci Retracements Supports- Two Supports in this zone 24116 & 24171 as shown)
3. 23500-23700 (Fibonacci Retracements Supports- Two Supports in this zone 23608 & 23707 as shown)
2. 23000
Medium Term Resistance:
1.27000 ( Need to decisively break 26269 all time high) This resistance is based on Fibonacci resistance at 27034
Long term resistance:
1.28000 ( Need to decisively break and move up 27000)This resistance is based on Fibonacci resistance at 28106
Long Term Support
1.22700-23000 ( Trend line and Mar 2024 High)
2.Big support at 20000 (Sep 2023 high)

$SPY $SPX Scenarios — Friday, Nov 7, 2025🔮 AMEX:SPY SP:SPX Scenarios — Friday, Nov 7, 2025 🔮
🌍 Market-Moving Headlines
🚩 Jobs Day: The October Employment Report headlines Friday, with payrolls expected at -60,000 and the unemployment rate rising to 4.5% — signaling labor market cooling.
📉 Policy implications: A weak print would reinforce expectations for multiple rate cuts in early 2026, while upside surprises could stall the dovish momentum.
💬 Fed watch: Morning remarks from Williams and Jefferson set the tone before the data drop; Miran rounds out the week with a late-day speech.
⚠️ Shutdown delays: The Employment Report and related labor metrics are at risk of delay pending government data releases, adding uncertainty to Friday’s open.
📊 Sentiment & credit check: U-Mich Consumer Sentiment and Consumer Credit round out the macro picture.
📊 Key Data and Events (ET)
⏰ 3:00 AM — John Williams (NY Fed) speech
⏰ 7:00 AM — Philip Jefferson (Fed Vice Chair) speech
⏰ 🚩 8:30 AM — U.S. Employment Report (Oct) — subject to delay
• Nonfarm Payrolls: -60,000
• Unemployment Rate: 4.5%
• Hourly Wages (MoM): 0.3%
⏰ 10:00 AM — UMich Consumer Sentiment (Prelim, Nov) | 53.0 expected
⏰ 3:00 PM — Consumer Credit (Sept) | $10.0B expected
⏰ 3:00 PM — Stephen Miran (Fed Gov) speech
⚠️ Note:
The Employment Report, Unemployment Rate, and Wage Data are flagged at risk of delay due to the government shutdown. All other releases are expected on time. Market volatility will hinge on whether the data prints or is postponed.
⚠️ Disclaimer: Educational and informational only — not financial advice.
📌 #trading #stockmarket #SPY #SPX #JobsReport #NFP #Fed #Jefferson #Williams #inflation #yields #macro #shutdown

$SPY $SPX Scenarios — Wednesday, Nov 5, 2025🔮 AMEX:SPY SP:SPX Scenarios — Wednesday, Nov 5, 2025 🔮
🌍 Market-Moving Headlines
🚩 First clean data of the week: After delays in earlier reports, Wednesday brings ADP Employment and ISM Services — the first confirmed macro prints to gauge real economic momentum.
📉 Labor tone check: ADP’s private payroll growth of 22,000 vs -32,000 prior suggests continued softness but potential stabilization ahead of Friday’s NFP.
💼 Services resilience: ISM Services expected to tick up slightly to 50.5, hovering near the expansion line — a critical signal for Q4 GDP trajectory.
💬 Market tone: With shutdown-delayed data still missing, traders focus on rate-cut odds, yields, and Treasury auctions for directional cues.
📊 Key Data and Events (ET)
⏰ 8:15 AM — ADP Employment (Oct) | +22,000 vs -32,000 prior 🚩
⏰ 9:45 AM — S&P Final U.S. Services PMI (Oct) | 55.2
⏰ 10:00 AM — ISM Services (Oct) | 50.5 expected, 50.0 prior 🚩
⚠️ Note:
Unlike earlier-week reports, all of Wednesday’s data are confirmed to release on schedule — making this the first meaningful macro catalyst since the FOMC. Expect intraday volatility around 8:15 AM (ADP) and 10:00 AM (ISM).
⚠️ Disclaimer: Educational and informational only — not financial advice.
📌 #trading #stockmarket #SPY #SPX #ADP #ISM #PMI #yields #Fed #inflation #bonds #economy #macro

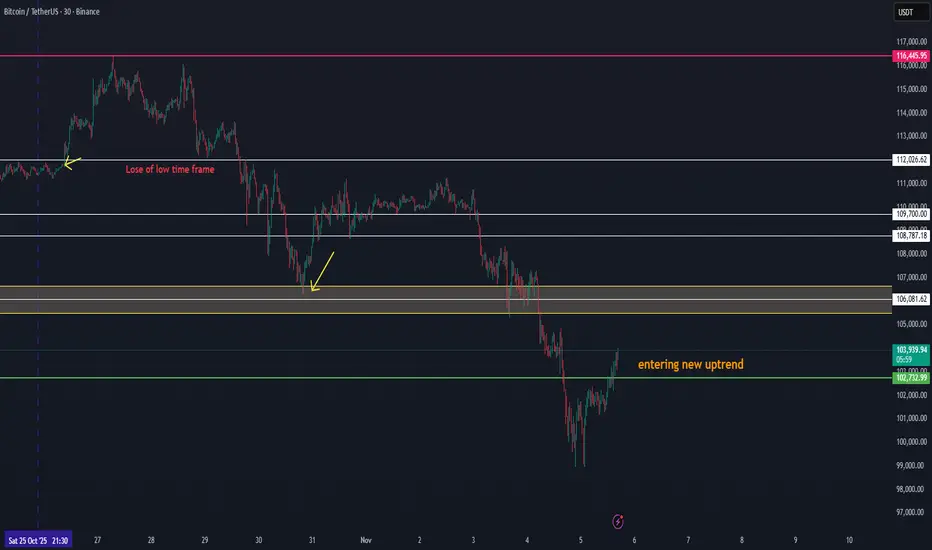
BTC Showing Early Signs of a New Uptrend Volume FormationBTC Showing Early Signs of a New Uptrend Volume Formation
Bitcoin is beginning to show new uptrend volume structure after a long corrective phase. This current movement around the 103K zone could be the first confirmation of renewed bullish momentum forming after the 110K area breakdown.
Here’s the technical context:
🔹 Structure: BTC has established a short-term higher low and is now attempting to build a new rising channel.
🔹 Volume Confirmation: The growing buy volume around 103K suggests early accumulation — this could mark the start of a new volume phase.
🔹 Targets: A sustained move above 103.8K–104.2K may confirm continuation toward 105K+, which would act as the first key resistance and validation of renewed market strength.
💡 Outlook:
If BTC maintains its current momentum and volume continues to rise, this could be the first stage of a new uptrend, with 105K+ as the initial upside target and potential re-entry toward the broader 110K recovery structure later.
$SPY $SPX Scenarios — Wednesday, Nov 5, 2025🔮 AMEX:SPY SP:SPX Scenarios — Wednesday, Nov 5, 2025 🔮
🌍 Market-Moving Headlines
🚩 First clean data of the week: After delays in earlier reports, Wednesday brings ADP Employment and ISM Services — the first confirmed macro prints to gauge real economic momentum.
📉 Labor tone check: ADP’s private payroll growth of 22,000 vs -32,000 prior suggests continued softness but potential stabilization ahead of Friday’s NFP.
💼 Services resilience: ISM Services expected to tick up slightly to 50.5, hovering near the expansion line — a critical signal for Q4 GDP trajectory.
💬 Market tone: With shutdown-delayed data still missing, traders focus on rate-cut odds, yields, and Treasury auctions for directional cues.
📊 Key Data and Events (ET)
⏰ 8:15 AM — ADP Employment (Oct) | +22,000 vs -32,000 prior 🚩
⏰ 9:45 AM — S&P Final U.S. Services PMI (Oct) | 55.2
⏰ 10:00 AM — ISM Services (Oct) | 50.5 expected, 50.0 prior 🚩
⚠️ Note:
Unlike earlier-week reports, all of Wednesday’s data are confirmed to release on schedule — making this the first meaningful macro catalyst since the FOMC. Expect intraday volatility around 8:15 AM (ADP) and 10:00 AM (ISM).
⚠️ Disclaimer: Educational and informational only — not financial advice.
📌 #trading #stockmarket #SPY #SPX #ADP #ISM #PMI #yields #Fed #inflation #bonds #economy #macro

AFTER THE BREAKDOWN 105K IS THE KEY LEVEL FOR RECOVERYWe have seen an unexpected breakdown in BTC, even despite the positive news about the China deal. BTC continued to decline further, although the data has generally been pointing in the right direction.
At the moment of writing, BTC is still in a downtrend. However, the $105K level could be a key point that triggers a potential recovery, depending on how the upcoming data unfolds.
We will continue to monitor whether BTC can enter the $105K zone in the coming time frames.

$SPY $SPX Scenarios — Tuesday, Nov 4, 2025🔮 AMEX:SPY SP:SPX Scenarios — Tuesday, Nov 4, 2025 🔮
🌍 Market-Moving Headlines
🚩 Jobs data on deck: Tuesday’s focus is on labor demand — the JOLTS report remains a key barometer for wage pressure, though it may not print due to the shutdown.
⚠️ Data blackout continues: The Trade Balance and Factory Orders are both delayed government releases, keeping markets dependent on Fed tone and price action.
💬 Fed-speak pre-jobs: Vice Chair Bowman’s early-morning remarks will frame policy bias ahead of ADP and Friday’s NFP.
💻 Volatility compression: With few confirmed reports, traders watch AMEX:SPY ’s range behavior and TVC:VIX positioning before the labor-data surge mid-week.
📊 Key Data and Events (ET)
⏰ 6:35 AM — Michelle Bowman (Fed Vice Chair) speech
⏰ ⚠️ 8:30 AM — U.S. Trade Deficit (Sept) — may not print
⏰ ⚠️ 10:00 AM — Factory Orders (Sept) — may not print
⏰ ⚠️ 10:00 AM — Job Openings (JOLTS, Sept) — may not print
⚠️ Note:
All three macro reports are subject to delay under the continuing government shutdown. Expect headline-driven trading and low data-volume volatility until Wednesday’s ADP and ISM Services releases.
⚠️ Disclaimer: Educational and informational only — not financial advice.
📌 #trading #stockmarket #SPY #SPX #Fed #Bowman #JOLTS #TradeBalance #FactoryOrders #bonds #yields #economy #shutdown #macro

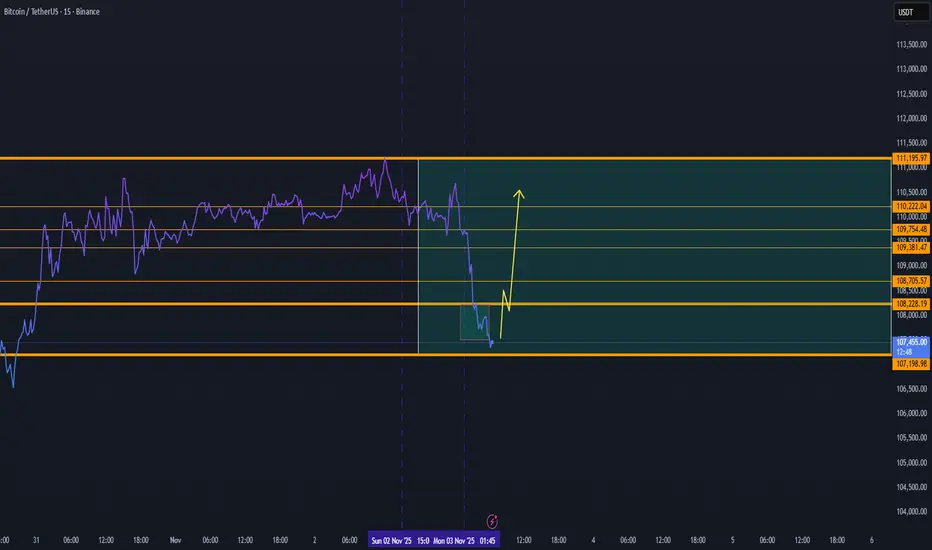
BTC Reversal Momentum — Targeting 110K+ Zone ( DAY VIEW)Bitcoin is showing early signs of a potential short-term reversal after consolidating near the 107K–108K support area. The chart structure indicates a possible recovery wave that could push BTC back toward the 110K+ resistance range in the coming sessions.
Here’s the current structure breakdown:
🟢 Support Zone: 107K remains the key pivot base — holding this area keeps the potential for an upside bounce intact.
📈 Reversal Projection: If momentum builds from the current range, BTC could retest resistance levels at 109.3K → 110.2K → 110.7K.
⚠️ Invalidation: A breakdown below 107K would delay this upward move and reintroduce downside pressure.
Outlook:
Bitcoin is currently stabilizing after a local dip, with buying volume gradually returning. The next impulsive move could drive price action toward 110K+, potentially marking the start of a new short-term uptrend if confirmed by higher lows.
🕒 Summary: As long as BTC maintains structure above 107K, a recovery toward 110K+ remains a strong daily scenario.
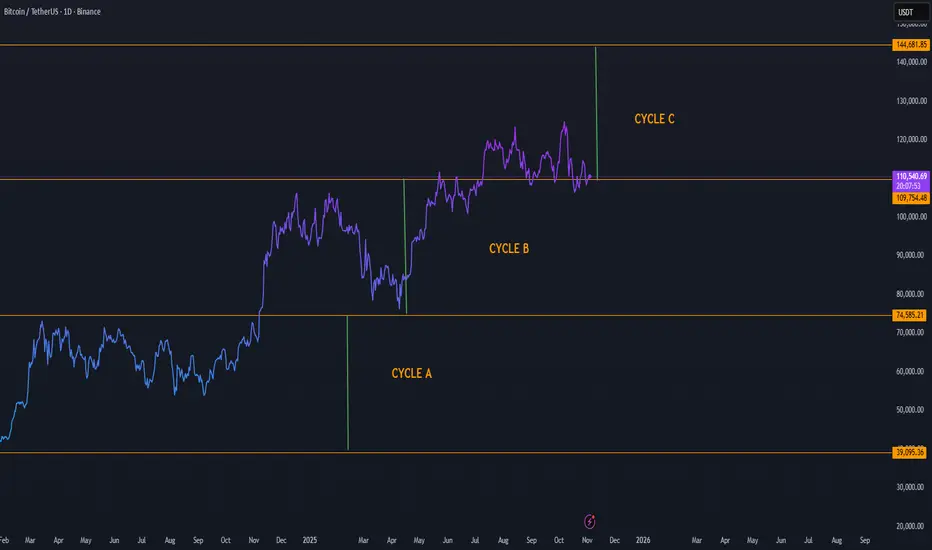
Depending on our study BTC can enter a new cycle to 143K in 2025
Bitcoin Cycle Analysis Entering Cycle C with Target Toward $144KBitcoin’s long-term market structure continues to evolve in well-defined phases, as visible through Cycle A, Cycle B, and the current Cycle C formation. Each previous cycle has followed a similar pattern: accumulation, expansion, correction, and new leg upward — and Cycle C appears to be following this same rhythm.
Here’s what the structure shows:
Cycle A: Represented the deep accumulation zone and base formation, bottoming near $39K–$75K.
Cycle B: Brought a strong recovery and expansion phase, establishing a stable mid-level support around $110K.
Cycle C (Current): Price is consolidating around the $110K area, likely preparing for the next expansion wave.
If Bitcoin maintains this cyclical rhythm, the next major target lies near $144K, aligning with the top boundary of Cycle C. This zone represents the next major resistance level and potential completion point of the current macro cycle.
Key observations:
Holding above $109K keeps Cycle C active and healthy.
Increasing volume during the next upward move could confirm a breakout continuation.
A successful push beyond $120K would strengthen momentum toward the $144K region.
$SPY $SPX Scenarios — Week of Nov 3 → Nov 7, 2025🔮 AMEX:SPY SP:SPX Scenarios — Week of Nov 3 → Nov 7, 2025 🔮
🌍 Market-Moving Headlines
🚩 Post-FOMC digestion: After Powell’s Oct 29 presser, traders watch whether yields and the dollar cool or extend higher.
📈 Labor-week spotlight: Friday’s Jobs Report (NFP, wages, unemployment) anchors the week — rate-path odds hinge on those prints.
💬 Fed tone in focus: Multiple governors and regional presidents hit the circuit after the FOMC — every nuance matters for December guidance.
⚠️ Shutdown watch: Several BEA and Census releases (Factory Orders, Trade Balance, GDP components) may not print on time if the government remains partially shuttered.
💻 Earnings taper off: Final big-cap names and sector leaders wrap Q3 results, shaping sentiment into mid-November.
📊 Key Data and Events (ET)
Mon Nov 3
⏰ ⚠️ 8:30 AM — Durable Goods Orders (Sept) | Ex-transportation subset — BEA report; possible delay
⏰ 10:00 AM — Factory Orders (Sept) ⚠️ possible delay
Tue Nov 4
⏰ 9:00 AM — S&P Case-Shiller Home Price Index (Aug)
⏰ 10:00 AM — Consumer Confidence (Oct) 🚩
Wed Nov 5
⏰ ⚠️ 8:30 AM — Advanced Trade Balance in Goods (Sept) | Retail and Wholesale Inventories — Census; may be delayed
⏰ 10:00 AM — Pending Home Sales (Sept)
⏰ 🚩 2:00 PM — FOMC Rate Decision
⏰ 🚩 2:30 PM — Fed Chair Powell Press Conference
Thu Nov 6
⏰ 🚩 8:30 AM — Initial Jobless Claims (Oct 25) expected on schedule
⏰ 🚩 8:30 AM — GDP (Q3, Advance) ⚠️ BEA data; delay possible
⏰ 9:55 AM — Fed Vice Chair Michelle Bowman speaks
Fri Nov 7
⏰ 🚩 8:30 AM — PCE and Core PCE (Sept) along with Personal Income, Spending, and Employment Cost Index ⚠️ BEA risk
⏰ 9:45 AM — Chicago PMI (Oct)
⏰ 12:00 PM — Cleveland Fed President Hammack and Atlanta Fed President Bostic remarks
⚠️ Note:
Shutdown risk applies to BEA and Census releases marked with ⚠️
Confirmed live data include Jobless Claims, FOMC decisions, and Fed speeches — these will drive most of the week’s price action.
Friday’s PCE print (if released) remains the key inflation gauge.
⚠️ Disclaimer: Educational and informational only — not financial advice.
📌 #trading #stockmarket #SPY #SPX #Fed #Powell #FOMC #PCE #GDP #JoblessClaims #inflation #bonds #yields #economy #macro

WIF/USDT – Accumulation Phase Before Potential RecoveryWIF continues to consolidate after an extended downtrend, currently trading around $0.53 within a well-defined range between $0.45 (support) and $0.85 (resistance).
The structure shows signs of base formation, with steady accumulation and reduced volatility — a setup that often precedes directional movement.
Support zone: $0.45 remains the key demand area where buyers are consistently stepping in.
Resistance zone: The main resistance to watch is near $0.85 — a breakout above could confirm trend reversal.
Volume behavior: Gradually increasing volume hints at potential momentum build-up for an upward move.
If market sentiment improves, WIF could attempt a return toward the $0.75–$0.85 zone, marking a mid-term recovery phase. For now, holding above $0.50 keeps the structure constructive for a bullish continuation.

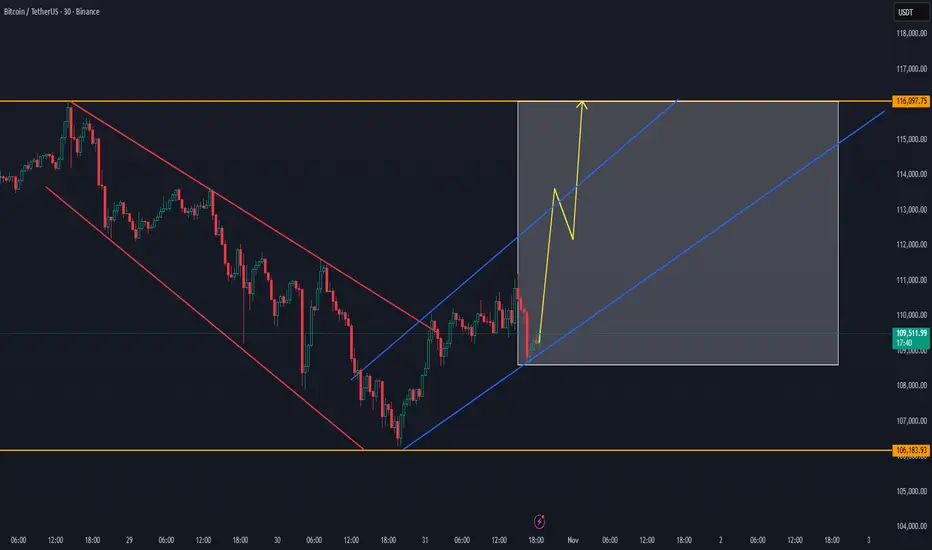
BTC Weekend Setup — Possible Volume Push Toward 116KBTC Weekend Setup — Possible Volume Push Toward 116K 🔥
Coinbase effect + China can play an important role for the breakout of 116K+
Bitcoin has broken out of its descending channel, reclaiming structure and showing early signs of strength.
Momentum is gradually building within the new ascending trend, suggesting that the weekend could bring a volume expansion targeting the 116K zone.
📈 Technical Outlook:
BTC successfully flipped the 106K–108K area into support.
The new uptrend channel is forming higher lows and showing a steady recovery pace.
Volume remains low but is expected to increase into the weekend, often a period of volatility and directional moves.
🎯 Targets:
First resistance: $112K–$113K
Main target zone: $115K–$116K
If volume confirms, a push to 116K could complete this short-term recovery cycle.
⚠️ Risk note:
Failure to hold above $108.5K could slow momentum, bringing price back to retest lower trendline support.
💬 Summary:
BTC is positioned for a potential weekend volume push, with a clear channel structure guiding price toward the 116K resistance zone. Momentum is cautiously bullish — watching for confirmation through weekend trading activity.
Bitcoin Weekend Volume Could Exceed 116K as Smart Money Accumula📊 Market Update
Bitcoin has been building strength since the 106K–107K level, showing signs of a new uptrend. Both the lower time frames and the main trend are currently positive. There’s a strong possibility that BTC will target 112K as the first level, with 116K+ also possible depending on the weekend trading volume.
🔹 Market Structure
The market structure is gradually building, suggesting smart money inflows into BTC over the last 10 hours. We’ll continue tracking this development closely further

BTC Building Momentum — 112K+ Zone ON WAY.Bitcoin has held strong within the recent volume area, showing solid support and renewed buying pressure.
After rebounding from the lower levels near $106K–$108K, BTC is now pushing upward and appears on track toward the first target zone around $112K–$114K.
📈 Market Outlook:
Strong recovery from the volume area confirms short-term buyer control.
Resistance lies between $111.6K and $113.3K, marking the first target zone for this upward move.
Sustained momentum above $109.8K could trigger acceleration toward $114K+ in the next sessions.
📊 Observation:
Volume has started to align with bullish movement — if this continues, BTC could retest upper resistance and possibly extend toward $116K.
However, a pullback below $108.6K would suggest consolidation before another attempt higher.
💬 Summary:
BTC is on its way toward the first target zone above $112K, showing growing strength after reclaiming key volume support. Momentum remains positive as long as price holds above the mid-range.

BTC Showing Early Signs of a Possible New UptrendBTC Showing Early Signs of a Possible New Uptrend 🚀
The key is to follow the trend. BTC can return from this point back up 109K
Bitcoin has bounced from the lower range near $107K, holding support after several strong rejections to the downside.
The current structure suggests that momentum could be shifting upward, as the market forms a potential new base for recovery.
There is a good chance that the secure whale trend could use 107K as support for entering on a later time frame to a new cycle
📈 Current outlook:
Support has been confirmed around $107K–$108K, where buyers stepped in with volume.
Short-term resistance remains at $111.6K–$113.3K — a breakout above could confirm a trend reversal.
The price is now trading in the mid-range, building strength for a possible push higher.
📊 Observation:
If BTC manages to reclaim and hold above $113K, the next leg up toward $116K could begin, signaling the start of a new uptrend cycle.
Failure to hold this recovery base would risk another test of the $107K zone.
💬 Summary:
BTC has shown strong recovery signs after defending support — momentum now points toward a possible new uptrend if it sustains above key resistance levels.

Nifty Short & Medium Term Support&Resistance_30-Oct to 7-Nov-25Nifty Short & Medium Term Support&Resistance_30-Oct to 7-Nov-25
Nifty 25909
Long call ( Buy) was given three weeks before at 24896, Nifty crossed 26000 last week and this week.
Recently china was announced 100% additional tarrif for rare earth restriction by china, but after meeting XI, trump reduced current tarrif from 57% to 47%
Quarterly results of company released so far are average expecting GST 2.0 and festive sale to boost in Q3, HDFC Bank posted 10% profit, ICICI Bank posted 5% profit, Reliance posted 10% profit.
HDFC AMC, Persistent Systems,Dixon, Waaree Energies, Waaree Renewables, KEI, Polycab, Havells, Indian Renewable, NMDC, Bank of Mah, ICICI Lombard and ICICI Pru posted good results. Few stocks are already gone up and PE is high.
Overall, the Qtrly Results and Tariffs deal will decide the future path of the Nifty. Since it is a Volatile situation SIP route or buy in multiple parcel route with a goal of 3-5 years will workout.
Pending Qtrly results and Tarriff Deal ill take the Index Further.
Hence the strategy can be shifted to long considering medium to long and use the opportunity to buy on dips similar to SIP.
Current Short Term Resistance are 26000 and 26269 ( all time high). It need to break the resistance 26269 decisively to move up to 27000 target in med-long term.
Nifty Short Term Supports ( Multiple Supports are there between 25000-25670):
1.25900 ( Trend line support)
2. 25670 ( Jun 2025 High) Should cross this resistance in short term decisively inorder to move up.
3. 25500 ( 25441 Sep 18th 2025 High )
4.25450 ( 25442 is the Aug 2025 high)
5.25350 ( Fibonacci resistance shown )
6.25200 ( 25154 Aug 2025 high)
7.25000 ( Milestone)
Short Term Resistance
1.26098 ( Recent last week high)
2.26269 ( All time High)
Medium Term Support:
1.24700 (Trend Line as shown)
2. 24000-24170 (Fibonacci Retracements Supports- Two Supports in this zone 24116 & 24171 as shown)
3. 23500-23700 (Fibonacci Retracements Supports- Two Supports in this zone 23608 & 23707 as shown)
2. 23000
Medium Term Resistance:
1.27000 ( Need to decisively break 26269 all time high) This resistance is based on Fibonacci resistance at 27034
Long term resistance:
1.28000 ( Need to decisively break and move up 27000)This resistance is based on Fibonacci resistance at 28106
Long Term Support
1.22700-23000 ( Trend line and Mar 2024 High)
2.Big support at 20000 (Sep 2023 high)

BTC Still in Breakdown ZoneBTC Still in Breakdown Zone ⚠️
Bitcoin remains inside the breakdown structure, consolidating under pressure after failing to reclaim the upper range near $116K.
The current setup continues to show bearish volume behavior, suggesting that the market is still in a controlled downtrend phase.
📉 Current outlook:
Breakdown zone spans $116K – $110K.
Price continues to trade mid-range around $113K, with limited bullish momentum.
The breakdown volume indicates ongoing distribution — sellers remain active.
📊 Observation:
BTC is holding slightly above $112.5K, but without strong buying confirmation.
If this consolidation breaks lower, the next liquidity target sits around $110K, marking the bottom of the breakdown zone.
💬 Summary:
BTC is still in the breakdown phase, with selling pressure dominating short-term structure.
Until price reclaims $116K with volume, risk remains tilted toward the $110K region.

DIA enters breakdown trendDIA has officially entered a breakdown phase after losing its key short-term structure and falling back into the breakdown volume zone.
The sharp rejection from the $0.86 level triggered heavy selling pressure, confirming a shift in short-term trend momentum.
📉 Current outlook:
Price is now consolidating between $0.60 – $0.38 within the breakdown range.
Volume is elevated, suggesting distribution rather than accumulation.
Unless DIA reclaims $0.65+, the trend remains bearish.
📊 Observation:
This move resembles a post-hype correction where early buyers exit and liquidity thins out.
The next key level to monitor for reaction sits near $0.38 support — a potential short-term base if selling slows down.
💬 Summary:
DIA is currently trading in a breakdown trend, with risk leaning to the downside until structure rebuilds above $0.65.

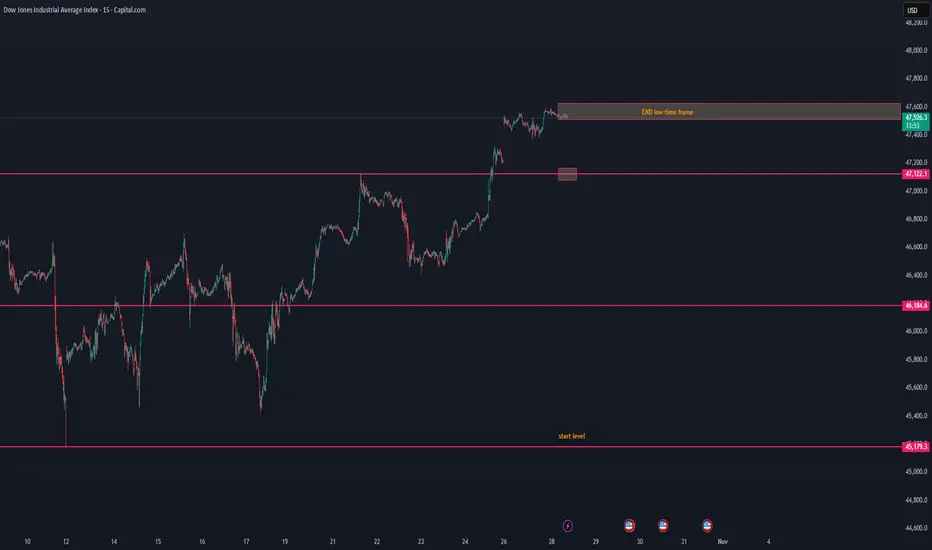
US30 lost its low time frame — possible breakdown aheadUS30 lost its low time frame — possible breakdown ahead ⚠️
US30 has lost its low time frame structure, showing early signs of weakness after the recent push to 47.5K.
The current price action suggests that momentum is fading, and sellers may start to take control.
📉 Short-term view:
Structure break below 47.5K zone confirms loss of bullish control.
The next visible support area sits around 47.1K, followed by 46.1K.
With time, price could continue to drift down toward the start level near 45.1K if buyers fail to defend.
📊 Observation:
Volume has started to cool off, and price is trading below the short-term EMA range — a typical setup before a gradual downward retrace.
💬 Summary:
US30 lost its low time frame momentum and looks to break down step by step toward the start level zone. We’ll monitor if buyers can react near 47.1K or if this becomes a broader correction phase.
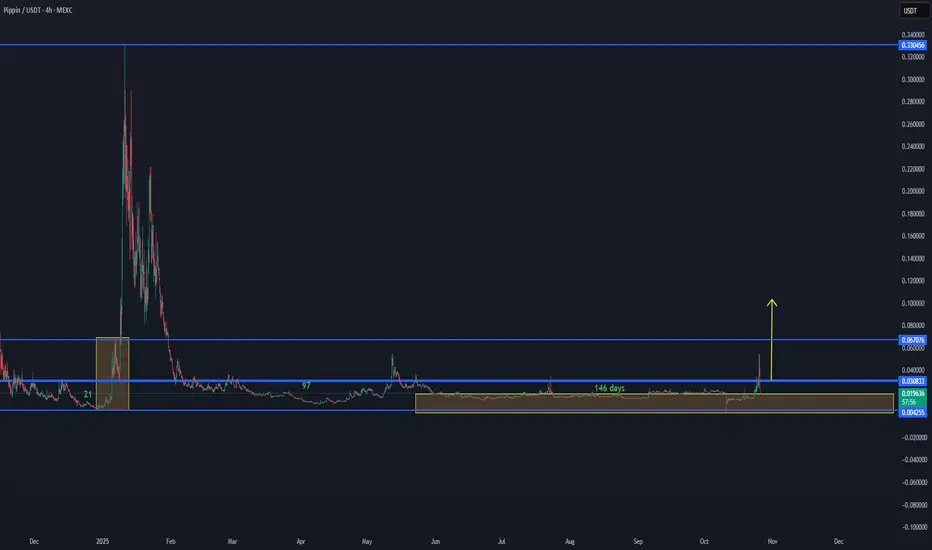
PIPPIN:USDT Market Outlook – Volume Range Formation💠 PIPPIN:USDT Market Outlook – Volume Range Formation
PIPPIN:USDT is showing early signs of new volume activation after an extended 146-day accumulation period within the lower range between 0.0042 – 0.0308 USDT.
This current setup indicates a potential volume range development, similar to the previous expansion phase observed earlier in the chart.
If momentum continues to build and volume sustains, the next major resistance zone sits around 0.067 USDT, followed by a broader target area toward 0.33 USDT on higher timeframes.
At this stage, stability above 0.018–0.020 USDT would confirm the base structure and strengthen the bullish outlook.
📊 Summary:
Range support: 0.0042 – 0.018 USDT
Key activation zone: 0.018–0.030 USDT
Target zones: 0.067 → 0.33 USDT
Structure: Accumulation → Early volume build-up
🔎 Focus: Watching for continuation of volume inflow and break above 0.0308 USDT to confirm next phase expansion.