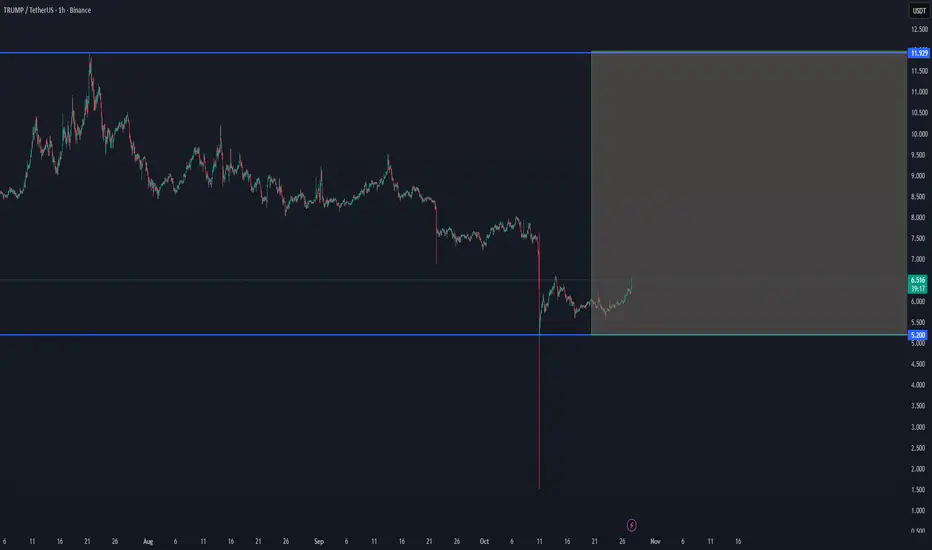
TRUMP/USDT — Reversal Signs After Deep CorrectionTRUMP/USDT — Reversal Signs After Deep Correction ⚡
After a heavy decline, TRUMP is showing early recovery signs from the $5.20 support zone.
If momentum continues, a push toward the $11.90 resistance range could form a short-term bounce setup.
📊 Support: $5.20
📈 Upside Target Zone: $11.90
Market
JELLY/USDT — Building Momentum Inside Volume BoxJELLY is stabilizing within the $0.075 – $0.12 volume box, signaling a potential accumulation zone before expansion.
A clean breakout and hold above $0.12 could confirm strength and open targets toward $0.16+ in the short term.
📊 Volume Zone: $0.075 – $0.12
📈 Breakout Target: $0.16

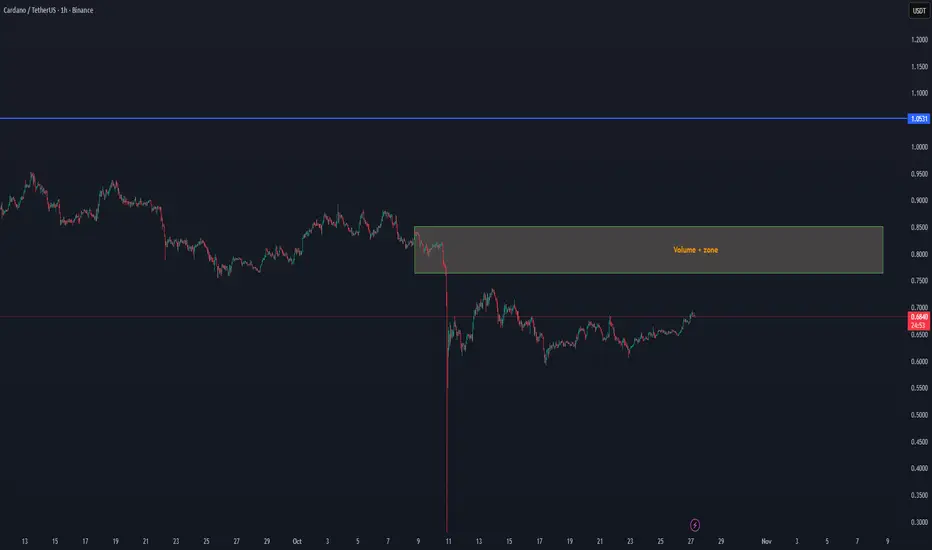
ADA/USDT – Volume Zone Retest Setup🔹 ADA/USDT – Volume Zone Retest Setup
ADA is showing early signs of strength after recovering from the last drop and is now building momentum below the Volume+ Zone between $0.75 – $0.85.
The current structure shows stable volume forming on lower time frames, which can indicate accumulation before a possible retest of the upper range.
If momentum continues, ADA can look to re-enter the volume zone, where the next confirmation area will define continuation potential toward $1.05 resistance.
For now, we follow volume development — a clean breakout and hold above the zone would confirm the next expansion phase.
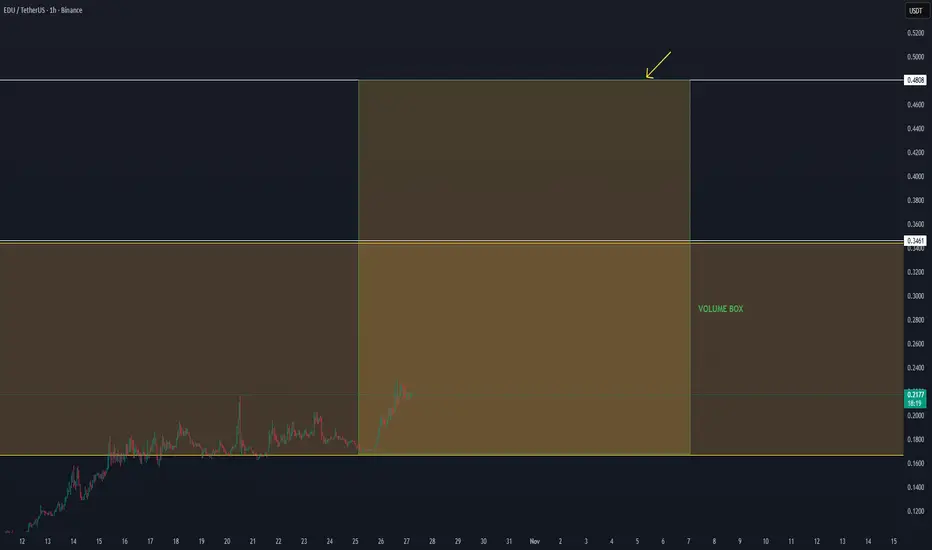
EDU/USDT – Volume Expansion Setup🔹 EDU/USDT – Volume Expansion Setup
EDU continues to show strong structure after the last move up, holding steady inside the volume box. The pair is building momentum with consistent volume increase on the lower time frames, showing clear accumulation signals.
If the current structure remains stable, EDU can continue this short-term uptrend and target the next resistance zone around $0.48, where the main reaction level is expected.
We follow the data and volume development closely — as long as the price stays supported inside the box, the momentum remains valid for a potential breakout continuation toward the upper range.
AAVE/USDT – New Volume Box Activation🔹 AAVE/USDT – New Volume Box Activation
AAVE is forming a new volume box structure between $203 – $385, showing renewed momentum after the last low recovery. Price is currently stabilizing around the lower range with growing volume, suggesting early accumulation activity.
As long as AAVE holds above the $200 support zone, we follow for a possible continuation inside this box. The first target for structure development sits around $322, followed by $385 as the main breakout resistance level.
The setup remains active as long as the current momentum and volume stay consistent — confirmation on lower time frames will define the strength of the next move.

BTC/USDT — Pre-Cycle Range Breakout📊 Market Update
Bitcoin entering up on the low time frame with strong volume — we are now in an area where BTC is building a new uptrend cycle with the last trend view.
Remember, BTC can always change trend unexpected, and when that data comes, we will share it fast. For now BTC still holding positive around the support at 108K.
🔹 Market Structure
Last 4 days+ BTC been building uptrend, and as long this stays consistent we can speak about positive trend.
Important zone is 117K, we will see if BTC can reach there soon.
We continue daily updates as always — everything is possible in the market.

BTC Market Update – New Volume Activation - $114K📈 BTC Market Update – New Volume Activation
BTC continues to show strong momentum within the current structure.
Price action remains bullish, with no clear signs of breakdown at this stage.
From the current zone (~111.4K–111.7K), there’s visible new volume activation, suggesting renewed interest and potential continuation toward the $114K target zone.
As long as BTC holds above the support range, the main trend remains intact.
If a structural change occurs, it will be highlighted in the next update.
Focus: Continuation toward $114K while maintaining volume support.

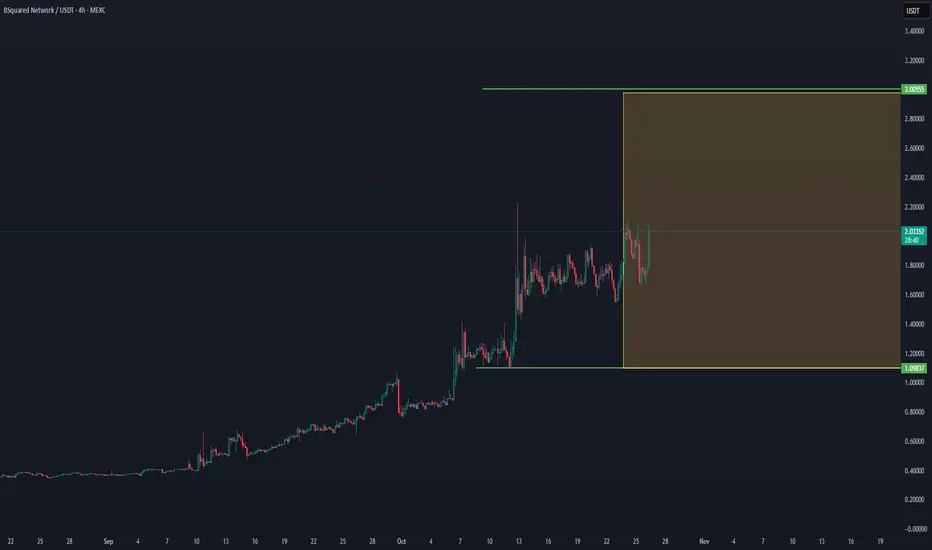
B2USDT Market Update – Range Formation & Volatility WatchB2USDT is currently consolidating after its previous strong impulse move.
The price has been trading in a defined range between 1.09 and 3.00 USDT, forming a mid-term sideways structure.
At the moment, no confirmed breakout is visible — price action remains neutral to slightly bullish as long as it holds above the 1.09 support zone.
Sustained closes above the 2.05 level could indicate the start of a range expansion toward the 3.00 zone, but confirmation requires clear volume increase and momentum continuation.
If BTC continues upward, B2 may benefit from secondary momentum; however, a lack of fresh volume could keep it ranging within this zone for longer.
📊 Summary:
Support: 1.09 USDT
Range resistance: 3.00 USDT
Mid-zone control: ~2.00 USDT
Structure: Sideways / accumulation
Bias: Neutral to bullish, awaiting confirmation
🔎 Focus: Watching for break and hold above 2.05 to confirm a potential continuation setup.
PIPPIN/USDT — Dip Buying Zone Formed After BreakdownPIPPIN/USDT — Dip Buying Zone Formed After Breakdown 💎
After the recent breakdown, PIPPIN has entered its volume zone, which often acts as a re-accumulation area before a potential rebound.
If the price can stabilize and build strength here, this level could represent a dip-buying opportunity with the possibility of a return toward previous highs.
📊 Key Range: $0.015 – $0.024
💡 Focus: Watching for a volume confirmation or strong reversal candle to signal a bounce

EDU/USDT Update - Cycle TokenEDU is now trading inside the volume box area. After the last move up, the price is holding stable with volume increase on the 4H.
As long as EDU stays inside this range, we follow for a possible move to the top of the box around $0.34, where we expect first resistance.
If BTC stays stable, EDU can continue this short-term trend move to test the upper box level.

BTC/USDT — Holding Strength Above Low Time Frame, Eyeing 114K BTC/USDT — Holding Strength Above Low Time Frame, Eyeing 114K Zone 🚀
Bitcoin continues to show positive structure, trading above the low time frame support and aligning with the broader uptrend momentum.
The recent stabilization and gradual rise in volume indicate that buyers are maintaining control, keeping BTC in a constructive phase toward the $114,000 target zone.
As long as Bitcoin sustains above $109,700–$110,000, the trend remains bullish, with higher-timeframe confirmation aligning in favor of continuation.
📊 Technical Overview:
Support Zone: $109,700 – $110,000
Resistance Target: $114,000
Trend: Positive continuation above low TF
Bias: Bullish
Momentum and volume remain healthy — suggesting BTC could attempt another push into the 114K region if current structure holds.
📈 Outlook: Uptrend continuation
🎯 Target: $114,000+

AIA/USDT — Volume Box Reaccumulation Could Lead to New 2025 ATHAIA/USDT — Volume Box Reaccumulation Could Lead to New 2025 ATH 🚀
DeAgentAI (AIA) is developing a solid volume reaccumulation zone between $1.40–$2.15, showing early structural strength after a prolonged consolidation phase.
The pattern suggests that AIA is preparing for a major expansion cycle, with the next key breakout area sitting around $3.65, followed by a potential move toward the $5.00 region — its previous all-time high.
As AI-focused narratives regain strength heading into 2025, AIA could become one of the top performers if this volume box breakout confirms with sustained momentum.
📊 Technical Overview:
Support (Volume Box): $1.40 – $2.15
First Target Zone: $3.65
Major Target / ATH Zone: $5.00+
Bias: Accumulation → Expansion
With strong fundamentals and renewed volume build-up, the structure points to a potential 2025 new ATH scenario, once the $2.15–$3.65 range is reclaimed with volume.
📈 Outlook: Bullish mid-term setup
🎯 Targets: $3.65 → $5.00+

ZECUSD - Oh no are we in bear market since 2 weeks ? want to finish on a good working idea before stoping publishing hehe
this double bottom formation has been seen too much time lately
I entered now
SL : 340 for now, will update lower at 310 when white trendline broke down
Also depends on BTC reaction but i think daddy is going to see 100k or sub 100k first before going a bit up (last rejection made me switch bear for some days)
first TP : 155
second TP : 60/70
Cheers not advice

IS BSV READY FOR NEW CYCLE MOVE TO $100 - 2025Bitcoin SV is showing on the short-term view a trend that can have an upcoming increase in volume. Further checking if SV is going to confirm the $25-28, which can lead to a breakout back to up $40 level.

EURUSD, technical analysis 1WHellou traders,
We bring you an important technical analysis of the EURUSD currency pair.
The value of this asset reached the key level of 1.19, where was a significant reaction. According to Elliott waves, we can see that the abc structure is complete, absolutely perfectly 1:1 = A:C. The RSI indicator also indicates a bearish divergence. The downtrend in the long term also persists. Liquidity was taken.
One unclear fact in the chart is still unfilled price GAP - we must be careful and cannot just ignore it, it is theoretically possible that the price will come through it.
The conclusion is that the chart shows all the parameters leading to a downtrend.
What do you think about it?
We will gradually bring you more current analyses from other charts and time frames.
So don't forget to follow us!
Thanks
WavePulse

THE RETURN OF AVNTDepending on the low time frame, this coin shows an increasing view, which data shows that there is a high chance this coin will return, we will follow the confirmations in the coming time frames

JST/USDT — Major Reversal Setup Forming, 200% Potential AheadJST/USDT — Major Reversal Setup Forming, 200% Potential Ahead 🚀
JST is showing early signs of a trend reversal after an extended accumulation phase. The price is stabilizing around $0.032, with visible compression and increasing volume — both classic signals of an upcoming breakout move.
The next major resistance level sits around $0.10, representing a potential +200% move from the current range if momentum confirms. A breakout above $0.035–$0.040 could serve as the first confirmation of strength, leading to a rapid extension higher.
📊 Technical Overview:
Support Zone: $0.026
Breakout Zone: $0.035–$0.040
Main Target: $0.10 (+200%)
Structure: Long-term accumulation nearing breakout
JST remains in a strong position for a multi-week breakout if current support holds and short-term buyers maintain momentum.
📈 Bias: Bullish
🎯 Targets: $0.040 → $0.065 → $0.10

MEMECORE/USDT — Range Recovery Forming, Watching Higher levelsMEMECORE has shown a steady rebound from the lower range near $2.00, regaining short-term momentum as it attempts to reclaim the $2.34 zone, which has acted as a strong resistance multiple times.
A confirmed breakout above $2.34 would signal a shift in momentum and open the path toward the range high at $2.53, where the next major liquidity zone sits.
📊 Technical Overview:
Range Support: $2.00
Range Resistance: $2.34
Breakout Target: $2.53
Bias: Neutral → Bullish above $2.34
If MEMECORE continues to hold above the $2.00 base with rising volume, the structure suggests potential for a range breakout and short-term trend reversal.
📈 Outlook: Building strength inside range
🎯 Targets: $2.34 → $2.53

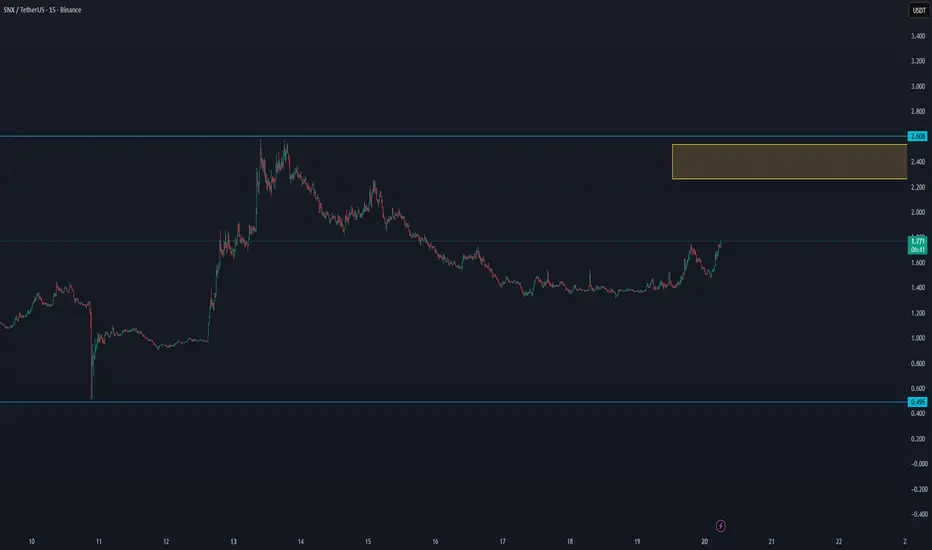
SNX/USDT INCREASE VOLUME On the lower time frames, SNX is showing signs of increasing volume, which could build up over time. For this reason, it’s worth watching SNX closely to see if the trend can break.
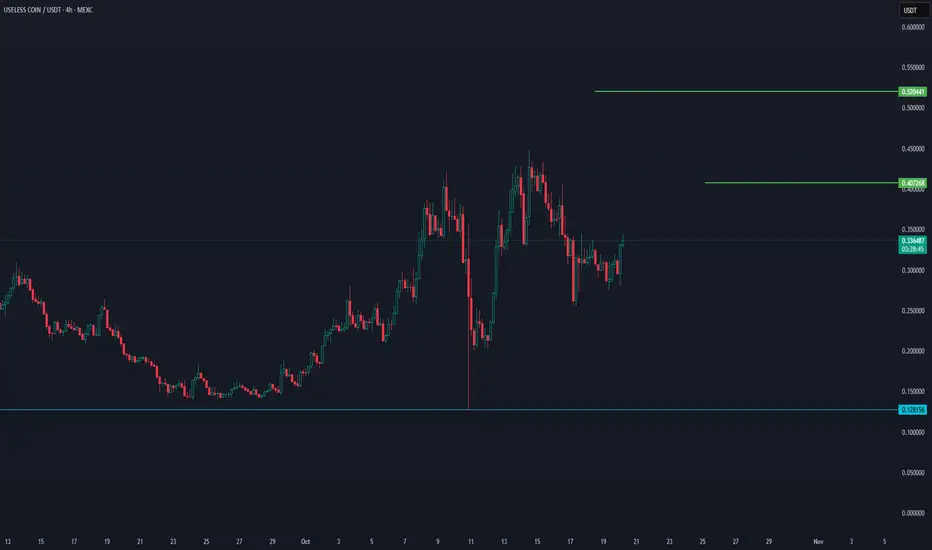
Useless Coin (USDT Pair) – 4H Chart Update📊 Useless Coin (USDT Pair) – 4H Chart Update
Current Price: $0.3424
Change (Last 4H): +3.6%
Volume: 456K
The price is currently attempting to recover from a recent downtrend, showing some short-term strength as it moves upward from the local support area.
🔹 Support Level: $0.128 – This remains the key bottom support and has held firmly in the previous correction.
🔹 Immediate Resistance: $0.407 – This is the first resistance to watch; a confirmed breakout above could trigger further bullish momentum.
🔹 Next Target Zone: $0.520 – This would be the next major resistance area if volume continues building and the current trend holds.
Market Structure:
The structure is neutral to slightly bullish — the market is forming higher lows, suggesting buyers are gradually stepping in.
However, there is still a lack of strong follow-through volume, which means the uptrend is not yet confirmed.
Summary:
Useless Coin shows early signs of a potential recovery with higher lows forming, but it remains in a consolidation phase. A close above $0.407 on strong volume would confirm a short-term bullish continuation toward the $0.52 level. Failure to hold above $0.30 could reopen the downside toward $0.20 or even $0.128.
THE RETURN OF BTC TO 110K ON WAY..There is high chance in the coming time we can see a BTC breakout return to 110K in the coming time. Today Sunday, can be an important day before the start of the weekly chart.
106K can become an important secure zone for the next increase in volume

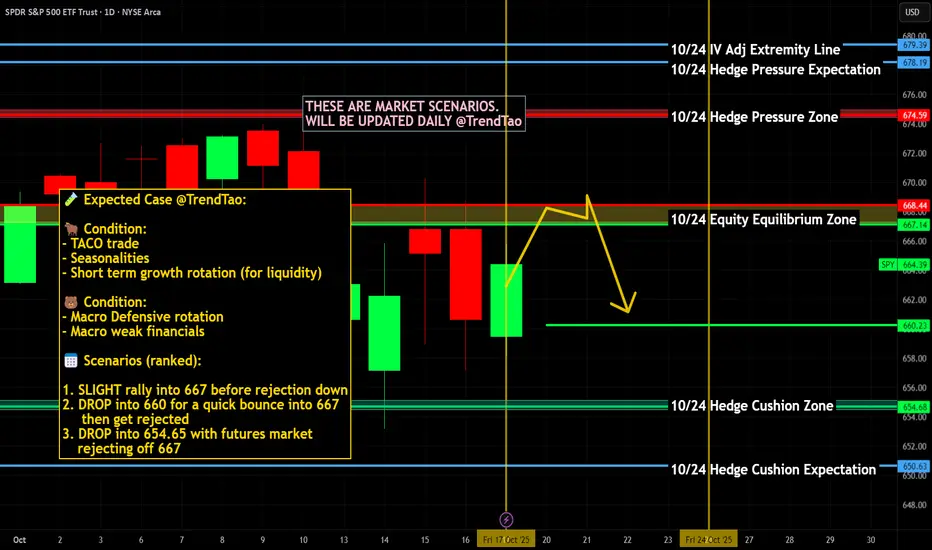
$SPY / $SPX Scenarios — Week of Oct 20 → Oct 24, 2025🔮 AMEX:SPY / SP:SPX Scenarios — Week of Oct 20 → Oct 24, 2025 🔮
🌍 Market-Moving Headlines
🚩 Inflation week: The delayed CPI release on Friday could be the first key data drop since the shutdown began — all eyes on price momentum and Fed expectations.
📉 Jobless Claims live feed: The only consistent macro signal right now — still reporting despite shutdown; any uptick could rattle yields and growth sentiment.
💬 Fed tone matters more: Policymakers continue to speak through the data void; expect market sensitivity to even minor policy hints.
💻 Earnings peak week: Roughly 80+ S&P 500 names report, including several mega-caps — likely to set the tone for AMEX:SPY and $QQQ.
📊 Key Data & Events (ET)
Mon 10/20
⏰ No major scheduled data
Tue 10/21
⏰ No major scheduled data
Wed 10/22
⏰ No major scheduled data
Thu 10/23
⏰ 🚩 8:30 AM — Initial Jobless Claims (Oct 18) — only active weekly macro indicator
⏰ 10:00 AM — Existing Home Sales (Sept) (may be delayed due to shutdown)
Fri 10/24
⏰ 🚩 8:30 AM — Consumer Price Index (CPI & Core CPI, Sept) (delayed release expected)
⚠️ Note:
With most official data frozen, Jobless Claims and CPI carry extra weight. Expect sharp intraday swings on any surprise readings or leaks.
⚠️ Disclaimer: Educational / informational only — not financial advice.
📌 #trading #stockmarket #SPY #SPX #CPI #JoblessClaims #Fed #inflation #bonds #yields #shutdown #earnings #economy #megacaps #datawatch
ZEUS/USDT NEW INCREASE VOLUMEThe last data shows that Zeus has an upcoming volume, which can break in the coming time frames. This token is worth adding to the watchlist to follow the coming trends
