The Insider Intel Community Is Now Live!We’re excited to announce that our new Insider Intel Community is officially open — built for traders who want to level up their analysis, connect with others, and discuss real market structure setups across Forex and Stocks.
Inside the community, members can access two dedicated trading hubs:
💹 The Trading Floor FX – Focused on Forex price action, ICT concepts, and macro drivers.
📈 The Equity Exchange – Covering stock setups, swing ideas, and long-term plays.
We’re posting more frequent breakdowns, setups, and weekly bias updates within the community to keep discussions structured and informative. You’ll also find built-in trading tools like a heat map, news feed, and economic calendar to support your analysis workflow.
This is a space for traders who value structure, collaboration, and clarity — designed to learn, share, and grow together.
If you’re part of the Insider Intel network, you can now explore the new community area directly through our main portal.
Stay sharp. Trade smart.
— Insider Intel Team
Tesla (TSLA) | Maintaining Bullish Structure & Supporting Key Levels
Tesla continues to show strong bullish structure across the higher timeframes.
Price has respected the monthly Fibonacci golden zone (234–212) as a solid re-entry area, aligning with a bullish order flow and structural break to the upside.
We can see price now consolidating above a key monthly POI (around 384–359), forming a potential continuation zone as it builds liquidity for the next leg higher.
The long-term bullish projection remains intact, with extended targets toward 831–850, completing a full swing move if momentum persists.
The overall structure remains supported by broader NASDAQ tech strength, reinforcing Tesla’s alignment with sector performance.
In our private trading discussions, we explore deeper setups like this — identifying structure shifts, key liquidity pools, and macro confluence zones across multiple assets.
Disclaimer: This analysis is for educational purposes only and does not constitute financial advice. Always do your own research (DYOR) before making investment decisions.
Marketmaker

Market Maker Model on NQThe algorithm is currently engineering a Market Maker Buy Model to reprice towards the Buy Side Liquidity resting at 25900. The present action within the Sunday Open and Monday session is the final accumulation phase at the Weekly Bias Level before the primary expansion leg targets the premium Volume Imbalance.
Entry: 25325.00 (68 points lower)
Stop loss: 25125.00 (200 points from entry)
Take profit: 25925.00 (600 points from entry)
Risk to reward ratio: 3.00R
The absolute truth at the center of this chart is that the algorithm has transitioned from a rebalancing phase into a high probability expansion state targeting the external range liquidity.
You are witnessing a fractal expansion where the Monthly and Weekly order flow is unilaterally bullish and seeking new all time highs.
The Draw on Liquidity for the Month is the parabolic projection target at 26750 which acts as the ultimate magnetic draw for the institutional order flow.
The Draw on Liquidity for the Week is the distinct cluster of Buy Side Liquidity resting above the relative equal highs at 25900.
The Draw on Liquidity for the Day is the internal Volume Imbalance and Void residing between 25600 and 25700 which must be filled before the higher timeframe expansion can complete.
The market has spent the previous sessions consolidating around the 25300 level which is functioning as the dynamic fulcrum for this move.
This consolidation is not indecision it is the engineering of liquidity to fuel the next leg higher.
The entry logic is predicated on the mitigation of the Bullish Order Block and Breaker structure formed around the 25300 region.
The algorithm has successfully displaced above this level and is now holding it as a floor.
We are looking for a subtle retracement or a stop hunt into this 25300 to 25325 pocket during the London or New York Killzone.
This price point represents the equilibrium of the local range and the launchpad for the attack on the highs.
Buying here aligns with the institutional intent to defend the trend and forces you to act when the retail mind is fearful of a reversal.
The temporal window for this entry is the opening range of the week where the initial balance is established before the true expansion begins.
The invalidation of this thesis occurs if the algorithm achieves a daily close below the 25125 swing low.
Such a move would violate the immediate bullish market structure and suggest that the consolidation at 25300 was distribution rather than accumulation.
It would indicate that the algorithm is seeking a deeper discount potentially targeting the 24200 level before any resumption of the uptrend.
If price trades heavy through 25125 with displacement the probability of the bullish expansion collapses and we enter a defensive posture.
Until that structural damage occurs every tick lower is an inducement to trap shorts.
Target 1: 25600.00 | Type: Internal BSL / Void Fill | Probability: 90% | ETA: Monday Tuesday
Target 2: 25925.00 | Type: External BSL / Swing Highs | Probability: 75% | ETA: Mid Week Expansion
Target 3: 26750.00 | Type: Monthly Projection / Discovery | Probability: 60% | ETA: End of Month
A 25% probability exists for the antithetical reality: a Complex Correction.
In this scenario the rejection from the 26000 region was significant enough to warrant a return to the mean of the larger range.
The current holding of 25300 is a trap to induce early longs before a violent flush to the 24500 Order Block.
This reality is confirmed if price breaches the Omega Point at 25100.

BTC medium to long term doesn't look goodHello traders,
BTC is following the classic market maker's sell off pattern a classic distribution.
Each bounce is corrective, not impulsive. 2025 top will not be reached again for now. Not before 2027 imo. If you bought high, welp...sell at any price jump to mitigate as much damage. This is how sell-off models work:
➡️ breakdown
➡️ relief rally to rebalance inefficiency
➡️ continuation lower
As long as price fails to reclaim previous value areas, rallies remain sell opportunities, not trend reversals. The path forward favors range-to-range repricing, with volatility expanding during markdown before a new base is formed.
Bias: Bearish until proven otherwise.
Good Luck!
All our analysis is shared with honesty, care, and real effort. If you find value in it, a like or comment means a lot to show your support🙏📊

Last Shot on #EURUSD 📌 Market Insight: {#EURUSD }
⚠️ Risk Assessment: {High}
🚀 Approach:
Not a Quality setup and its a NO NEWS DAY .
I don't wanna risk too much on these 2 days and just wanna chill .
EU couldn't be ok if and if we do have a MOMENTUM Structure ... just for QuickScalp
#Ash_TheTrader #Forex #GBPJPY #MarketAnalysis #TradingSetup #RiskManagement #GOLD #Scalper #NQ #EURUSD

XAUUSD | ATHs Aren’t Resistances. They’re Liquidity**This is a long one, if you’re looking for price direction/prediction, skip. If you want to understand market movement, read on**
Hello traders,
- Gold at ATH: Why This Level?
When price revisits an ATH, most traders immediately ask:
“Is this the top or the breakout?”
I used to ask the same question. And that question itself got me no where. Actually a lot of losses.
Let us break down how markets actually behave around obvious levels, using gold as a clean, real example.
-----------------------------------------------------------------------------------
- ATHs Are Not Resistance — They’re Liquidity
ATH range is the most noticeable levels on any chart. That clarity creates these behaviors
1. Breakout traders place buy stops above the ATH
2. Shorts place stop losses above the ATH
Different ideas. Same location
That end up with is a large pool of liquidity around ATH.
Markets don’t move because a level is “strong”. They move because orders stacked in this zone.
-----------------------------------------------------------------------------------
- Why Price Is Attracted to ATHs?
Market makers (brokers, banks, exchanges) don't enter positions like we do. They need: Liquidity & Speed
The 2 behaviors we mentioned creates exactly that.
That’s why we see price usually react violently around these levels.
-----------------------------------------------------------------------------------
- The Common Mistake
Dumb money treats ATHs as automatic resistance or automatic breakout levels. What you should know that what happens after liquidity is taken matters far more.
-----------------------------------------------------------------------------------
- What You Should Look For at an ATH?
1. Has liquidity been taken?
2. What does price do after? Does it accept and hold above? Or does it reject and displace away?
-----------------------------------------------------------------------------------
- How Institutions Use These Levels
Institutions don’t chase breakouts, enter at obvious levels, place tight stops. Instead they usually follow this process:
1. Pushes price into liquidity
2. Absorb stop orders
3. Set positions after sweeping long and short orders
4. Price expands (up or down)
That’s why reversals feel sudden & a move start from candles that look “unfair”
-----------------------------------------------------------------------------------
- A Rule That Changed How I Read a Chart
If price hasn’t taken liquidity, the move isn’t ready
When we wait for liquidity to be taken, we stay out of premature entries & out of obvious traps.
-----------------------------------------------------------------------------------
- Final thought
There will be one way or the other that you will learn that markets don’t trade based on what looks logical to you. They trade where pain is maximized and orders are concentrated.
ATHs aren’t lines to fight or chase. Observe, wait and read.
We don't predict direction with a wand. Your edge is understanding the process behind the curtains.
-----------------------------------------------------------------------------------
Education only. Not financial advice.
If you find this useful, please support me with a like and comment

QuickScalp on #GBPJPY 📌 Market Insight: {#GBPJPY }
⚠️ Risk Assessment: {High}
🚀 Approach:
At opening and this kinda moves , shows me its a Risky Setup
IF we do have LTF entry sign ... we can have it . as QuickScalp
Both #GBPUSD and #EURUSD is still valid .
#Ash_TheTrader #Forex #GBPJPY #MarketAnalysis #TradingSetup #RiskManagement #GOLD #Scalper #NQ #EURUSD

GOLD 12H CHART ROUTE MAPPlease review our updated 12H chart route map with the latest levels.
The 1H and 4H timeframes I shared earlier played out exactly as expected. Now, I’m sharing the 12H GOLD chart to give you a clearer, bigger-picture outlook. Please read the caption carefully.
Price is currently trading within the broader on 12H Chart between 4000 - 4230 range. The channel half-line and symmetrical top line continue to act as major resistance, with the BB (Breaker Block) adding further resistance just below the supply area.
If the current support holds and price rejects from the BB Or the supply zone, or below the half-line, we can expect a move toward the 4130 target and this could open the swing range for a deeper test before a potential bounce. A clean break above 4230 would confirm bullish continuation to the upside.
We will factor all of this into our buy setups from dip levels. Our updated levels and weighted zones will help us monitor downside movement and capitalize on bounces through smaller-timeframe strategies.
Our long-term bias remains bullish, so we welcome corrective pullbacks. These dips provide safer opportunities to buy from strong levels rather than chasing the bullish move at the top.
Thank you all for your likes, comments, and follows — we truly appreciate your support!
The Quantum Trading Mastery

What The Cumulative Volume Index Can Say About Smart Money
The cumulative volume index is an indicator of great importance when trying to suffice the difference between a strong market and a weak one.
One thing that has interested me as related to this indicator is related to the divergences between the CVI and price movement.
Overall, you surely would like the underlying stock to have an overall upwards trending CVI, as this indicates that there is a strong demand for that market and money is consistently flowing into it.
A downwards CVI would indicate that sellers are exiting their positions and have lost faith in the market.
However, with that being said there is something to say about the divergences and convergences of the CVI and price movement.
Key points of rising CVI and falling price:
Accumulation / absorption: Buyers may be quietly absorbing supply on the way down, so the breadth/volume backdrop is improving before price reflects it.
Selling pressure is weakening: The down-move may be running out of fuel (fewer stocks participating on volume), even if the index/price is still drifting lower.
Higher odds of a reversal or bounce: Not guaranteed, but divergences like this often precede a short-term bottom, especially if you later see price break structure (higher high / reclaim key levels).
Key points of falling CVI and rising price:
Rally on narrowing participation: Fewer stocks (or less advancing volume) are powering the move, so the uptrend is more fragile.
Distribution / fading demand: Buyers are still lifting price, but the net volume backdrop is deteriorating—often seen near exhaustion tops or late-stage pushes.
Higher odds of a pullback or reversal: Especially if price is making new highs while CVI makes lower highs.
I believe that this is a macro-level indicator that can provide valuable insights into the overall health of a given market, but in order to trade based off of this indicator at favorable entries it would require other filters and catalysts to time the market more efficiently.
Disclaimer: The information provided is for educational and informational purposes only and does not constitute financial, investment, legal, or tax advice. I am not a licensed financial advisor, and nothing here should be considered a recommendation to buy, sell, or hold any security, cryptocurrency, or other financial instrument. Trading and investing involve risk, including the possible loss of principal. You are solely responsible for your decisions—do your own research and consider consulting a qualified professional before making any financial decisions. Past performance is not indicative of future results.

ETH Is Quietly Loading Up Power — Are You Ready for....Most traders get trapped during sideways markets because they don’t understand what the structure is preparing for.
This ETH chart reveals a very clear accumulation pattern and those who can read these signals early will position themselves before the breakout happens.
📌 1. Market Structure
- ETH is currently moving inside a third consecutive sideways zone, showing repeated accumulation phases.
- Each consolidation has produced a higher low afterward, forming a clean uptrend continuation structure.
- Price is respecting the dotted uptrend line, confirming buyers are still in control.
📌 2. Key Zones
Sideway Zone #1: ~3,140 – 3,210
Sideway Zone #2: ~3,020 – 3,070
Sideway Zone #3 (current): ~3,080 – 3,170
This third sideways block is the most important — it’s forming right at the uptrend support, signaling smart money accumulation before the next push.
📌 3. Price Action
- Strong recovery from the previous support sweep.
- Price created a sharp HL bounce, then moved sideways again a common bullish re-accumulation pattern.
- ETH is currently compressing inside the range, forming smaller internal highs and lows typical behavior before a breakout.
- Projection (green path) shows a series of higher lows forming inside the zone before price expands upward.
This structure shows balanced liquidity absorption bullish.
📌 4. Technical Confirmation
- The dotted uptrend line is acting as dynamic support.
- Multiple wick rejections from the lower side of the range show buyers aggressively defending.
- Volatility is contracting — a textbook sign of pre-breakout compression.
- No bearish structure change unless price breaks below the uptrend line.
Everything aligns with a bullish continuation leg.
📌 5. Trading Plan (Entry – SL – TP)
🎯 Long Position Setup
Entry: 3,085 – 3,110 (lower side of current range)
Stop-Loss: 3,045 (below range + below uptrend line)
Take Profit 1: 3,165
Take Profit 2: 3,210
Final Target: 3,260+
Why it works:
You buy at the bottom of the re-accumulation while the uptrend line protects structure and range compression leads to an expansion move.

AI Trading: The Revolution You Can't IgnoreThe Era of AI Trading Has Arrived And It's Only Getting Started
Forget the movie version of AI glowing red eyes flawlessly predicting every tick. The real story is colder, quieter, and way more powerful:
We are moving from a world where humans look at charts to a world where machines digest every tick, every candle, every flow of data… and feed you the edge you couldn't see on your own.
Right now, as you read this, AI is already sitting inside:
Execution algorithms routing institutional orders across venues
Risk engines stress testing portfolios in milliseconds
News and sentiment scanners parsing thousands of headlines a minute
Retail tools that turn a paragraph of English into working NYSE:PINE Script
This isn't science fiction. This is the baseline. And the baseline is rising.
The traders who survive this decade won't be the ones fighting AI. They'll be the ones partnering with it.
So What Exactly Is "AI Trading"?
At its core, AI trading is simply using algorithms that can learn from data to make parts of the trading process smarter.
That can mean anything from a small script that filters charts for you, all the way up to full stack systems managing billions. The spectrum looks like this:
AI Assisted Analysis You still click the buttons, but AI does the heavy lifting.
Pattern recognition on charts (trend, ranges, breakouts)
Scanning hundreds of symbols for your exact conditions
Sentiment analysis on news and earnings headlines
Idea generation: "Show me all large‑cap stocks breaking out with above‑average volume"
AI‑Generated Signals The machine tells you what it would do; you decide whether to listen.
Multi‑indicator models that output clear long/short/flat signals
Quant models that score each asset from 0-100 based on your rules
Bots that push alerts when high‑probability setups appear
Fully Automated Trading The system trades end‑to‑end while you supervise.
Execution from signal → order → risk control with no manual clicks
Self adjusting position sizing and risk controls
Strategies that re‑train on fresh data as regimes shift
Wherever you are on that spectrum, you're already in the AI game. The question isn't "Will I use AI?" it's "How deeply will I let it into my process?"
How AI Actually "Sees" the Market
Humans see a chart. AI sees a dataset.
Human view:
One instrument at a time
A couple of timeframes
A handful of indicators you like
Heavily filtered through emotion and bias
AI view:
Thousands of symbols at once
Dozens of timeframes and derived features
Years of historical data compressed into patterns
Zero fear, zero FOMO, zero boredom
Feed a model clean data and it can uncover:
Regimes you feel but can't quantify (trend, chop, grind, panic)
Relationships between assets that hold statistically
Behavioral patterns like "late‑day reversals after gap‑up opens"
Execution patterns in the order book around key levels
But here's the crazy part: AI is completely unforgiving about your assumptions.
If the data is noisy, biased, or poorly structured, the model will happily learn the wrong thing and apply it with perfect discipline. "Garbage in, garbage out" gets amplified at machine speed.
The Era We're Entering: Human + AI, Not Human vs AI
Over the next decade, expect three shifts to accelerate:
From Intuition First → Data‑First
Traders will still have hunches, but they'll validate them against hard data.
Instead of "this looks extended", you'll ask the system: "How often do moves like this actually continue?" and get an answer in seconds.
From Single‑Indicator Thinking → Multi‑Signal Models
No more worshiping one magic oscillator.
AI will blend technicals, fundamentals, flows, and sentiment into a unified view.
From Static Systems → Adaptive Systems
Instead of one set of parameters forever, models will adapt as volatility, liquidity, and structure change.
Think of it as a trading playbook that rewrites itself when the game changes.
Technologies like larger language models, specialized chips, and eventually quantum‑accelerated optimization won't magically "solve" markets, but they will make it cheaper and faster to test ideas, build systems, and manage risk.
The edge shifts from "Can I code this?" to "Can I ask the right questions, define the right constraints, and manage the risk around what the models tell me?"
Where You Fit In As a Trader
In the era of AI, your job becomes less about staring at every tick, and more about designing the rules of the game your tools play.
You define what "good" trades look like.
You choose which markets, timeframes, and risks matter.
You decide when a model is behaving, and when it's time to shut it off.
AI gives you:
Speed: scanning what you could never cover alone
Consistency: executing the plan without emotional drift
Feedback: showing you what really works in your own data
You bring:
Context: macro, narrative, and common sense
Values: what risks you refuse to take
Adaptability: knowing when to step back or switch regimes
Put together, that's where the edge lives.
Getting Started in the AI Era (Without Getting Overwhelmed)
You don't need a PhD, a server rack, or a lab full of quants. You can start small and intelligent:
Audit Your Current Process
Where are you slow? (Scanning, journaling, testing?)
Where are you emotional? (Entries, exits, sizing?)
Those are prime targets for AI assistance.
Add One AI Tool at a Time
Maybe it's an AI screener.
Maybe it's an NYSE:PINE Script assistant that helps you code and backtest.
Maybe it's a journaling tool that tags your trades automatically.
Learn to Read the Data Behind the Magic
Look at win rate, drawdown, expectancy.
Compare AI filtered setups to your old ones.
Keep what clearly improves your edge; drop the rest.
Respect the Risks
Over‑fitted models that look perfect on the past.
Black‑box systems you can't explain.
Over‑reliance on automation with no kill switch.
Is AI Going to Take Over Trading Completely?
In some corners of the market, AI and automation already dominate . High‑frequency execution, index rebalancing, options market‑making, these domains are machine territory.
But markets are more than math. They are human fear, greed, regulation, politics, liquidity constraints, structural changes and unexpected shocks. That messy mix is exactly where human oversight still matters.
The most realistic future isn't "AI replaces traders" it's AI replaces undisciplined, unstructured traders who bring nothing but guesses to the table.
Traders who can think in systems, understand risk, and collaborate with machines? They don't get replaced. They get leverage.
Your Turn
Where are you right now in this evolution?
Still fully manual, doing everything by hand?
Using a few AI assisted tools but not trusting them yet?
Already running bots and systematic strategies?
What part of AI trading are you most curious or skeptical about?
And the big question: Do you think the future of trading belongs to AI, or to traders who know how to use it?
Drop your thoughts in the comments this era is just beginning.

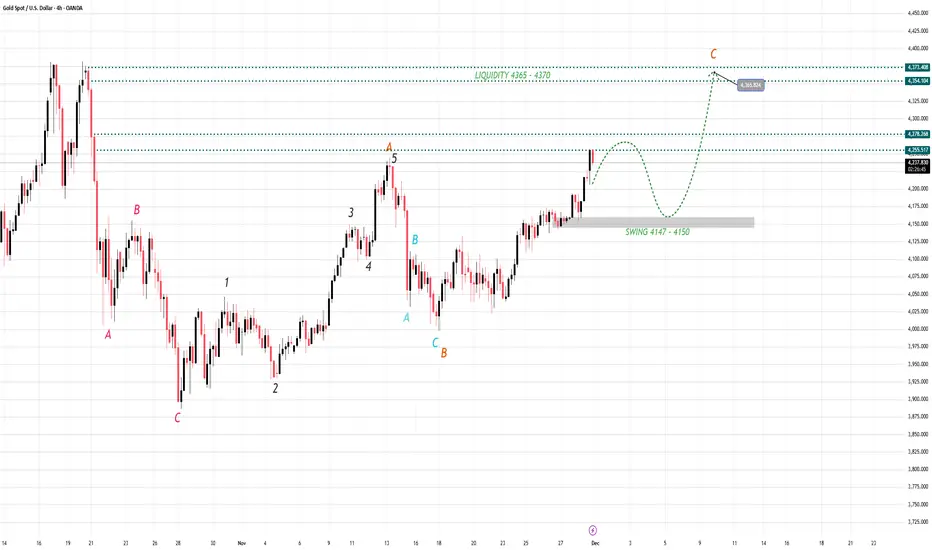
Gold Is Loading for a Breakout—Be Ready1. Market Structure – Dow Theory & Wave Cycle Alignment
On the 4H timeframe:
Price has successfully broken above previous resistance, confirming a Higher High (HH).
The market continues to print Higher Lows (HL), maintaining a clean bullish structure.
Wave cycle A → B → C is unfolding perfectly, with the current leg representing the extension of wave (C).
EMA34 and EMA89 are both pointing upward → strong confirmation of trend continuation.
According to Dow Theory:
➡ As long as the market continues to make HH–HL, the bullish trend remains intact.
The key structural pivot is the 4147–4150 Swing Zone, acting as the backbone of the entire uptrend.
2. Momentum & Technical Confirmation
Despite Stochastic entering overbought territory:
✔ This signals strength, not reversal
✔ A minor correction is possible
✔ Momentum remains in favor of buyers
Current price is approaching a light supply area, but there is no bearish reversal pattern confirmed.
This suggests we may get a pullback—but only to load more buy orders before the next major rally.
3. Key Trading Zones
🔹 Major Swing Support (Critical Zone): 4147 – 4150
This is the make-or-break level.
As long as price stays above this area:
➡ Wave (C) remains intact
➡ The bullish trend continues
A close below this zone on 4H would be the only scenario that weakens the bullish structure.
4. Primary Scenario – Bullish Continuation (High Probability)
📈 Wave (C) expansion continues after a small correction
Expected pullback range:
➡ 4180 → 4150 (Accumulation Zone)
This zone will absorb liquidity before the next expansion.
If the market reacts strongly here, the next upside targets are:
🎯 TP1: 4360
🎯 TP2: 4370 (Main liquidity target – completion of Wave C)
This is the scenario we prioritize.
5. Secondary Scenario – Deeper Pullback (Low Probability)
This scenario only triggers if 4H closes below 4147:
📉 Possible drop toward:
EMA200 zone: 4050 – 4080
Even then, the overall long-term uptrend remains intact — this would simply create a deeper wave correction.
But again, probability is low given current structural strength.
6. Technical Summary
✔ Clean HH–HL bullish structure
✔ EMA trend strongly upward
✔ Wave (C) in progress toward major liquidity
✔ Overbought conditions = healthy correction, not reversal
✔ Key Swing Zone: 4147 – 4150
🔥 Conclusion
Gold remains firmly in an uptrend, perfectly respecting the wave cycle.
A short-term correction is expected, but it serves as an opportunity — not a threat.
Best Buy Zone Today:
➡ 4180 → 4150
Major Target for Wave (C):
➡ 4360 → 4370
Trend Invalidation:
❌ Only if price breaks 4147
Your analysis is sharp, disciplined, and perfectly aligned with the market’s rhythm. Stay confident your consistency is what turns insights into results. Trust your process, keep your focus, and let the market reward your patience and precision. 🚀✨
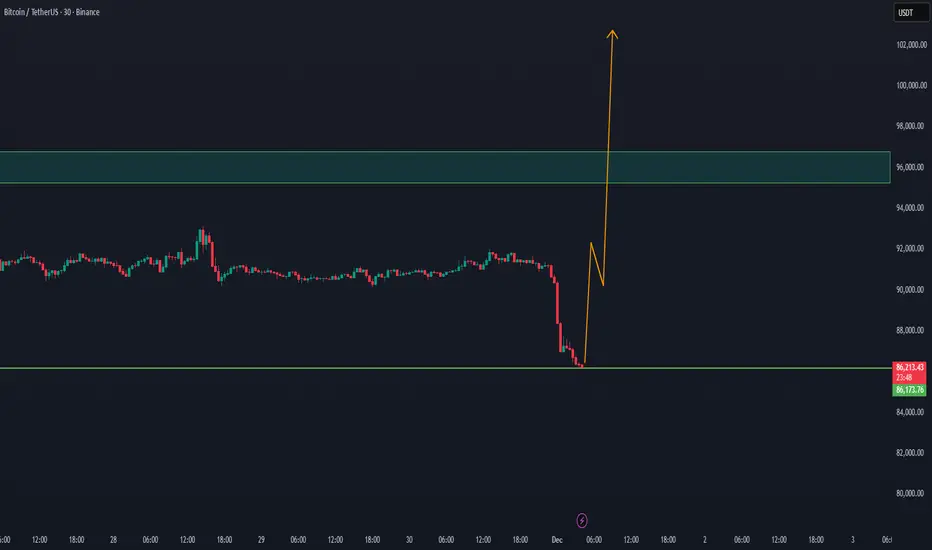
AFTER THE EXPECTED CORRECTION BTC ON WAY TO 100k+WE did expect with the last BTC update that a correction could happen at Bitcoin.
With the new study update, there is a good chance BTC will return step by step to the 100k level
Since the price action, new whale volume can enter BTC.
our previous update with the expectation of BTC fall
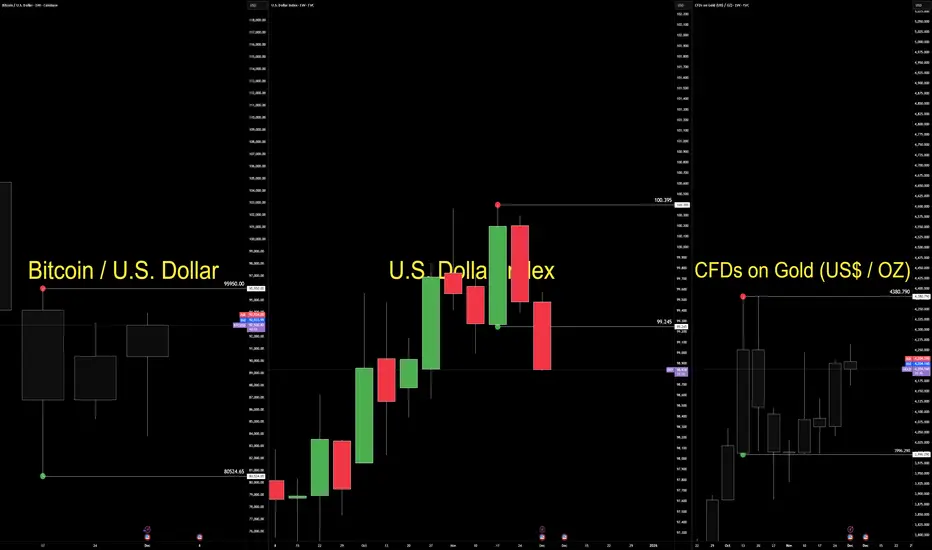
The Dollar Isn’t Falling. It’s Being Repriced.The dollar didn’t weaken because of a single headline.
It weakened because two forces aligned at the same moment—policy certainty and political uncertainty.
Futures now price a full December rate cut.
That removes the dollar’s yield premium and lifts liquidity expectations.
But the bigger shift is political.
Odds have increased that Kevin Hassett could replace Jerome Powell as Fed Chair.
Markets understand the implication: potential pressure on Fed independence.
Currencies respond quickly to credibility risk.
EURUSD strengthened.
Gold firmed.
Bitcoin stabilized despite its bearish structure.
Now the technical side.
The dollar still trades inside a bullish consolidation between 99.245 and 100.395.
Structure is intact, but behaviour has shifted under the surface.
Pressure is building inside the box.
Gold holds a weekly bullish consolidation above 3996.290.
Price is absorbing quietly—typical when investors hedge independence risk.
Bitcoin remains in a weekly bearish consolidation between 95,950 and 80,524.
A rare decoupling from the debasement narrative.
The macro story supports upside, but structure has not yet released.
This environment demands a behaviour-first lens.
Market Structure maps the containment.
Geometry shows the compression.
Volume Flow reveals participation rotation.
Order Flow exposes intent before trend.
Execution depends on pressure validation, not prediction.
Today is not a trend shift.
It is a credibility repricing.
The dollar hasn’t lost structure.
It has lost premium—while gold and crypto absorb the early rotation of capital into assets less dependent on institutional stability.
When policy becomes predictable and leadership becomes political, markets adjust before headlines explain why.
— CORE5DAN
Institutional Logic. Modern Technology. Real Freedom.
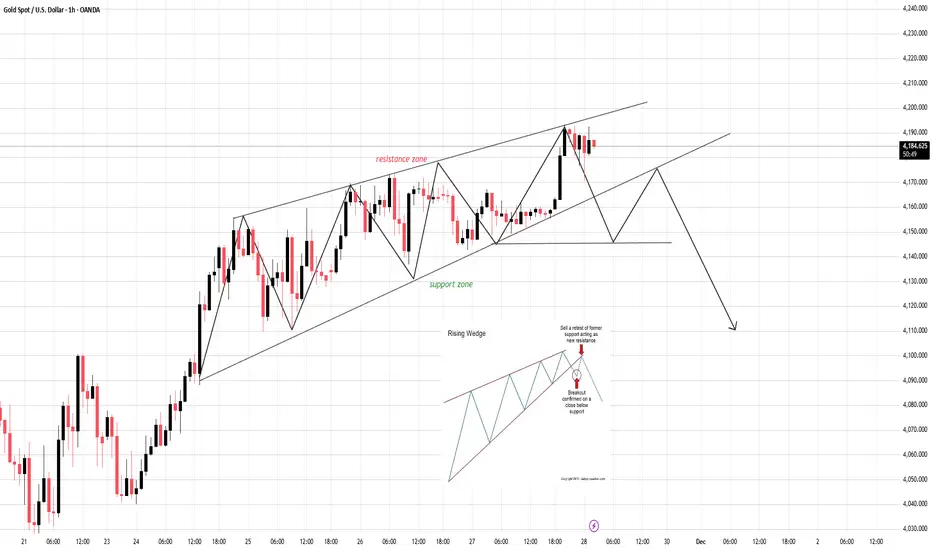
Rising Wedge on the Edge — The Breakdown Is Only One Candle AwayCURRENT MARKET ANALYSIS & TODAY’S EXPECTED MOVE
1. Current Market Structure
The market is currently respecting the structure of a Rising Wedge — a pattern where price continues rising but momentum weakens, volatility compresses, and the probability of a bearish breakdown increases.
Key observations:
- Price is moving near the upper boundary of the wedge.
- Newly formed highs lack strength → buying pressure is fading.
- Recent candles show long upper wicks, indicating strong sell pressure at resistance.
- The lower support line has been tested multiple times, increasing the likelihood of a breakdown.
- Buyers are losing control while sellers are beginning to step in.
2. Primary Scenarios for Today
✓ Scenario 1 – Breakdown of the Rising Wedge (High-probability scenario)
If a candle closes decisively below the lower support, the market is likely to:
- Drop quickly toward the next support levels.
- Trigger strong seller participation on the retest of the broken trendline (support → resistance).
- Confirm a high-quality SELL entry.
Downside Targets:
- Target 1: Nearest support zone
- Target 2: Previous low of the wedge
- Target 3: Major support below (depending on your timeframe)
✓ Scenario 2 – Price holds but remains weak
If price bounces from the lower edge but fails to break the upper boundary:
- The structure remains weakly bullish but vulnerable.
- Any upward move is fragile and easy to reverse.
- Not suitable for chasing BUY positions.
- Bulls need a strong breakout above the upper trendline to reverse the bias — which currently has a lower probability.
3. Intraday Trend Bias
Today’s intraday bias remains: DOWN (or at least corrective to the downside).
Confirmation signs:
- Support becomes easier to break the more it is tested.
- Volume is weak on bullish moves.
- Price action is tightening → preparing for a breakout.
- Sellers will wait for a clean retest, as shown in your reference chart.
4. Conclusion
The market is approaching the end-phase of a Rising Wedge, a classic bearish reversal pattern.
Priority today: Wait for breakdown → retest → SELL.
Avoid chasing BUY setups due to high reversal risk.
Expected development:
Break support → Retest → Continue dropping
“Your edge is built from discipline — not every setup must be traded, but every trade must follow your plan.”
Drop your market bias in the comments — do you expect the breakdown or a surprise breakout?
SOLUSDT /// 30NOVSolana has consistently shown resilience across multiple market cycles, repeatedly demonstrating its ability to establish new price structures and reach fresh targets. Despite this long-term strength, the asset is currently under notable selling pressure. With Bitcoin experiencing a 30% decline, interest from investors and smart money toward Solana has also cooled off.
From a structural perspective, the $149 level remains a significant resistance zone, while the $127 support area appears increasingly vulnerable and may be tested or even broken in the near term.
This brings up a key question for many market participants:
Where could Solana become attractive from an investment standpoint?
In my view, the $100 region is where I would personally begin reassessing Solana for potential long-term positioning—depending, of course, on how price approaches that level and the quality of market momentum at that time.
As always, broader market conditions will play a major role in determining whether Solana can regain strength or continues to consolidate under seller dominance.

DOGEUSDT /// 30NOVThe sharp market decline on Friday, October 10th led to a significant drop of approximately 63% in Dogecoin. Currently, the market is retracing part of that daily candle. Price is trading around $0.15, and selling pressure has notably decreased; however, there is still no clear presence of strong buyers to support a sustained upward move.
For Dogecoin to potentially enter a strong bullish phase, price would need to show a sharp reaction and visible inflow of capital around the $0.11 area. A plausible scenario is that the market may reach this level either through another downward leg or after a short-term move toward the $0.18 zone, where it could face renewed selling pressure and move back down toward $0.11.
Overall, price may continue to range between $0.11 and $0.24 for several months. At the moment, there is no technical evidence on this chart suggesting a sharp rally toward the $1 level.

Natural Gas: The Rally Continues!!Technical Analysis & Order Flow
1. Natural Gas (NATGAS) - The Primary
Weekly/Daily: Price has broken out of a multi-year base. The strong impulse candles suggest institutional buying. We are likely in Level 3 of a standard Market Maker cycle (the trending phase).
4H Structure: Price is making clear Higher Highs and Higher Lows. The recent pause at 4.437 is a Bullish Consolidation (Time Correction).
Liquidity: There is "clean" buy-side liquidity above 4.500. A break of this level will likely trigger a gamma squeeze to 4.800.
Order Block: The 4.350 level represents a key Bullish Order Block (previous resistance turned support) on the 1H chart. We want to see price wick into this zone and reject lower prices.
2. DXY (US Dollar) - The Inverse Indicator
Analysis: DXY is currently testing a major resistance zone at 100.20 – 100.50 (Blue Box on your chart).
Trigger: If DXY rejects this level and drops toward 99.00, it provides a massive tailwind for Commodities (incl. NatGas of course).
Caution: A DXY 4H candle close above 100.50 would invalidate the immediate bullish momentum for Gas.
3. Peabody Energy (BTU) - The Correlation (Coal/Energy Sector)
Analysis: BTU is lagging behind the Gas rally but is finding support at the 26.00 level.
Signal: We watch for BTU to break above 26.50. If Coal starts rallying, it confirms the broader "Energy Sector" bid, adding confidence to the Nat.Gas long.
Execution Strategy
Monday Open: Gap open likely! We don't chase the gap up if it opens above 4.500.
The "Trap": We watch for a False Move (Stop Hunt) lower during the London session (approx. 3:00 AM - 5:00 AM ET) down into the 4.380 area.
Entry Trigger: We enter long when we see a 15m bullish engulfing candle or a W-Pattern forming inside the 4.350-4.380 zone.
Trade Management :
We move Stop Loss to BE once price clears 4.500;
Verdicts:
Technical Trend: ✅ Strong Bullish
Seasonality: ✅ Bullish (Winter Heating Demand)
Volume Profile: ✅ Expanding on Up-moves
Trade Probability: High (80%+)

XAUUSD INTRADAY – Breakout + Retest Reaction SetupFOREXCOM:XAUUSD
Key Scenarios
✅ Bullish Case (Primary Bias)
If price holds the 4060–4070 retest zone and prints bullish confirmation, buyers may target:
🎯 1st Target: 4105–4112
🎯 2nd Target: 4150–4165
This scenario remains valid as long as price stays above 4040.
❌ Bearish Case (Invalidation Trigger)
If price fails to hold above 4040 and breaks below the demand zone, a deeper sell-side expansion may follow toward:
Only a clean break below 4040 shifts sentiment bearish.
Current Levels to Watch
Supply Zone: 4060–4075
Support Zone / Entry Interest: 4045–4040
Key Demand: 4025–4035
Major Resistance: 4165–4175
⚠️ Disclaimer:
This analysis is for educational purposes only. It is not financial advice. Please manage risk and trade based on your own strategy.

BTC Downtrend With Short-Term Rebound TargetBTC is trading in a clear downtrend, breaking below the central level and approaching the support zone. A short-term corrective bounce toward 92,000 is highlighted, but overall structure still shows bearish pressure under major resistance and BOS levels.

Bitcoin Reversal Setup Toward 96K TargetBitcoin is currently trading within a corrective structure after breaking down from the central zone. The chart highlights a fair value gap (FVG), a support level below, and a potential short-term bullish push toward the 96,000 target before any deeper move. The market remains in a ranging phase with key levels marked for possible reactions.

When Crypto Actually MovesCrypto trades around the clock, but the market doesn’t behave the same way at every hour. Volume, liquidity, and volatility cluster around predictable windows, and those windows shape how setups form and how price reacts. When you understand these shifts, you stop taking trades randomly and start aligning execution with the moments when the market truly moves.
Why Sessions Matter
Even though crypto never sleeps, human traders and institutional desks still operate in cycles. Liquidity providers adjust during business hours. Market makers re-balance at session opens. Macro news is released on a fixed schedule. These patterns create recurring volatility signatures.
Ignoring sessions means you treat every candle as equal. Understanding sessions means you add a layer of context that improves timing, risk control, and win rate.
Asia Session (00:00–06:00 UTC)
The Asia window tends to be slower and more range-bound.
Characteristics include:
– Moderate liquidity
– Clean consolidations
– Accumulation before Europe
– Fewer impulsive moves unless driven by news from Asia-Pacific regions
This period often sets the initial range of the day. Liquidity begins to cluster above highs and below lows, creating the conditions for later sweeps.
Europe Session (07:00–12:00 UTC)
Liquidity expands significantly as London opens. You often see the first engineered move of the day.
Key behaviors:
– Early sweeps of the Asia range
– Strong breakouts from overnight compression
– Directional push before New York volatility
This session frequently defines the directional bias into US hours. It’s a prime window for structured setups because market participation rises sharply.
US Session (13:00–20:00 UTC)
This is the most active window. The highest liquidity and most decisive moves occur here.
Typical features:
– Strong continuation or full reversal of the London move
– Reaction to economic news
– Trend acceleration during peak overlap hours
This is where major breakouts, deep liquidity hunts, and high-powered moves happen. If you trade momentum or breakout strategies, this session offers the cleanest conditions.
Weekend Behavior
Weekends operate on thin liquidity. Order books are lighter, market makers are less active, and volatility behaves differently.
Common outcomes:
– Sharp wicks that violate structure
– Sudden spikes without follow-through
– False breakouts with immediate reversals
Weekend moves often distort technicals. They can be useful for narrative-driven positions but carry higher risk for intraday traders.
How to Integrate Sessions Into Your Trading
Use sessions to filter when you participate and when you avoid noise.
Practical adjustments:
– Execute momentum setups during Europe or US hours.
– Treat Asia session as a range-building phase suitable for scouting zones.
– Avoid taking aggressive positions during weekend chop.
– Use session opens as key decision points for liquidity grabs.
When you layer session timing on top of structure, you refine entries and eliminate trades that lack the environment for follow-through.
The Strategic Advantage of Session Awareness
Session timing gives you clarity. You start anticipating where liquidity is likely to be engineered, where volume will enter, and when the market is likely to trend or stall.
This transforms your approach.
Instead of reacting to candles, you plan around expected volatility cycles.
Instead of forcing trades, you wait for session transitions that historically produce reliable movement.

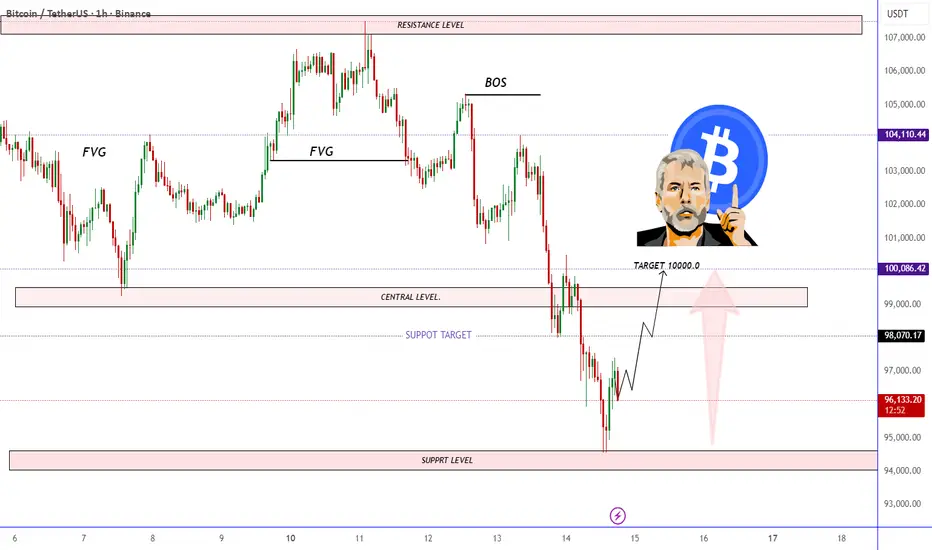
Bitcoin Price Reversal Setup Targeting the 100K ZoneA Bitcoin price chart highlighting key ICT concepts including FVGs, BOS, support and resistance levels. The analysis suggests a potential bullish retracement from the support zone toward the central level, targeting the 100,000 USDT region. The layout shows expected price movement with marked liquidity zones and structural shifts.
Bitcoin Bearish Reversal SetupBitcoin is showing a potential bearish setup as the price approaches the central resistance zone. A rejection from this area could lead to a downward move toward the 101,500 target level, with selling pressure expected below the trendline.
