Gold Price Targets $4,005 Amid Uptrend SupportGold price is trading near $3,984, maintaining support above the ascending trendline. The chart suggests a potential bullish move toward the $4,005 target if the uptrend holds, with key support around $3,963.
Marketmaker

Gold Price Breakout Above Trendline Targets 3980 Gold (XAU/USD) is showing bullish momentum, breaking above the trendline resistance around 4000. Price is currently near 4008, with potential pullback targets around 3980 and 3965 if retracement occurs. Trend remains positive above the rising trendline.

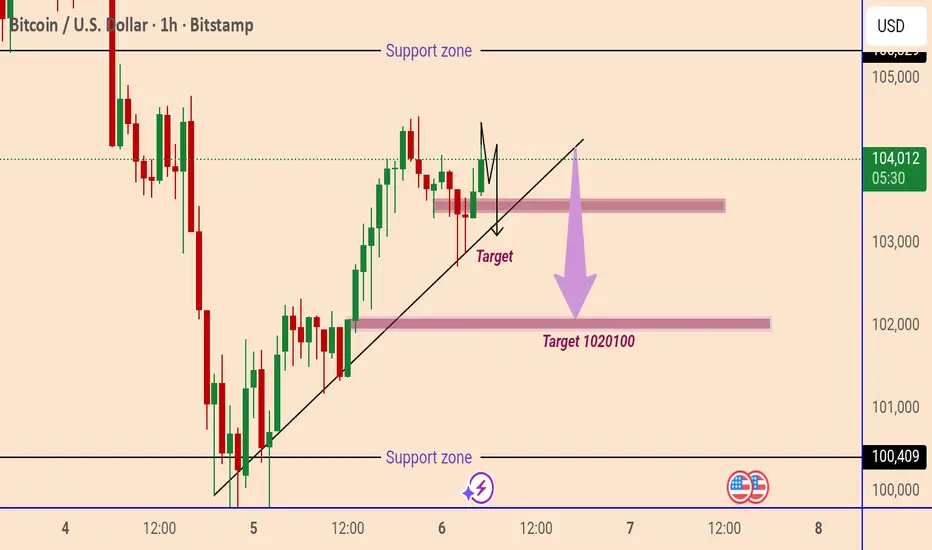
Bitcoin Trendline Breakdown SetupBitcoin (BTC/USD) is trading around $104,010, showing a mild bullish correction. However, the chart suggests a potential downward move if price breaks below the trendline support. The next targets are around $103,000 and $102,000–$102,100, with a major support zone near $100,400.
EUR/USD Bullish Reversal Toward 1.1510 TargetEUR/USD is trading near 1.1483, holding above the 1.1468 support zone. A bullish move is expected if the pair stays above support, with potential targets at 1.1500 and 1.1510.

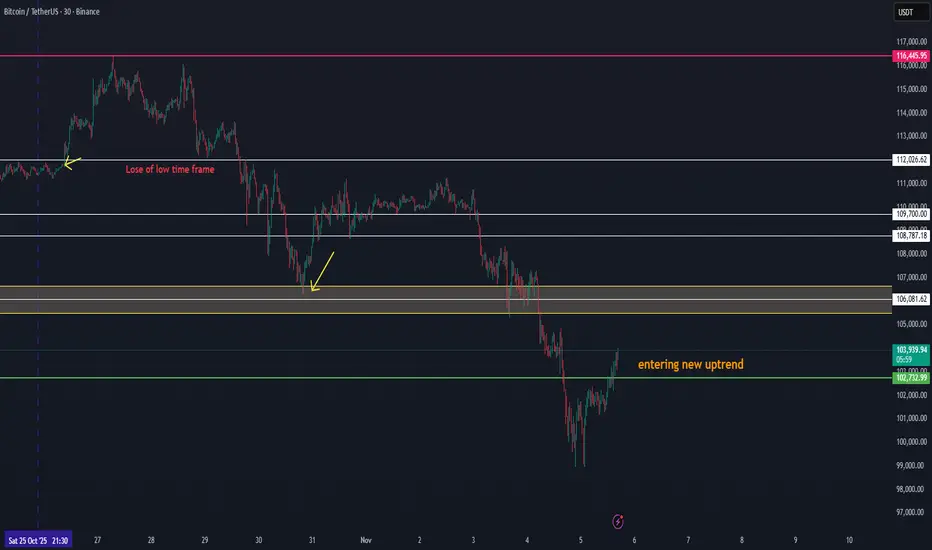
BTC Showing Early Signs of a New Uptrend Volume FormationBTC Showing Early Signs of a New Uptrend Volume Formation
Bitcoin is beginning to show new uptrend volume structure after a long corrective phase. This current movement around the 103K zone could be the first confirmation of renewed bullish momentum forming after the 110K area breakdown.
Here’s the technical context:
🔹 Structure: BTC has established a short-term higher low and is now attempting to build a new rising channel.
🔹 Volume Confirmation: The growing buy volume around 103K suggests early accumulation — this could mark the start of a new volume phase.
🔹 Targets: A sustained move above 103.8K–104.2K may confirm continuation toward 105K+, which would act as the first key resistance and validation of renewed market strength.
💡 Outlook:
If BTC maintains its current momentum and volume continues to rise, this could be the first stage of a new uptrend, with 105K+ as the initial upside target and potential re-entry toward the broader 110K recovery structure later.
Gold Price Targets 3990 After Support ReboundGold (XAU/USD) is trading around 3966, showing bullish momentum after rebounding from the support zone near 3928. The price is moving within an ascending channel, with a short-term target set at 3990. A breakout above this level could push prices toward the next resistance near 4006.

Bitcoin Rebounds Toward 103,500 Target ZoneBitcoin (BTC/USDT) on the 1-hour chart shows a rebound from the support zone around 99,900, forming a bullish move toward the target area at 103,500. A break above the mid-resistance zone could confirm further upside momentum.

BTC Entering New Uptrend —Weekend Volume Could Drive Price $116+BTC Entering New Uptrend — Weekend Volume Could Drive Price Above 116K +🚀
Bitcoin is showing strong signs of recovery after stabilizing at the lower support zone near 106K. The current structure indicates that BTC is entering a new uptrend, with higher lows forming and momentum gradually building.
📊 Market Structure:
BTC successfully held the volume support area and has begun to reclaim key short-term levels.
A break above 112K would confirm the shift in market momentum toward bullish continuation.
The next key resistance and target zone sits around 116K–117K.
💥 Weekend Outlook:
Volume is expected to increase through the weekend, which could fuel a strong upward move toward the 116K+ region.
With sentiment recovering and liquidity returning to the market, BTC appears positioned for a potential weekend breakout.
⚙️ Scenarios to Watch:
Holding above 109K–110K keeps the structure bullish and supports continuation toward 116K+.
Rejection below 109K could lead to a short pullback before another attempt upward.
💬 Summary:
BTC has entered a new uptrend phase, supported by strengthening volume and structure.
If momentum continues, a push beyond 116K during the weekend looks increasingly likely.

ZKUSDT - Don't waste this opportunity!Did you know that ZK dropped more than 98.5% from its peak in December 2024 until October 10, 2025?
If you can’t imagine what that means, let me explain:
Coins that experience such a massive drop usually get delisted and die off—they rarely recover.
But ZK surged over 1,300% from its October 10 bottom in less than 23 days and is now about to break a major resistance at the 0.618 Fibonacci level.
And I want to point out something:
ZEC and ZK sound similar, and even their letters resemble each other—definitely a hint at the market makers’ codes.
Best Regards:
Ceciliones🎯

WIF/USDT – Accumulation Phase Before Potential RecoveryWIF continues to consolidate after an extended downtrend, currently trading around $0.53 within a well-defined range between $0.45 (support) and $0.85 (resistance).
The structure shows signs of base formation, with steady accumulation and reduced volatility — a setup that often precedes directional movement.
Support zone: $0.45 remains the key demand area where buyers are consistently stepping in.
Resistance zone: The main resistance to watch is near $0.85 — a breakout above could confirm trend reversal.
Volume behavior: Gradually increasing volume hints at potential momentum build-up for an upward move.
If market sentiment improves, WIF could attempt a return toward the $0.75–$0.85 zone, marking a mid-term recovery phase. For now, holding above $0.50 keeps the structure constructive for a bullish continuation.

BTC Showing Early Signs of a Possible New UptrendBTC Showing Early Signs of a Possible New Uptrend 🚀
The key is to follow the trend. BTC can return from this point back up 109K
Bitcoin has bounced from the lower range near $107K, holding support after several strong rejections to the downside.
The current structure suggests that momentum could be shifting upward, as the market forms a potential new base for recovery.
There is a good chance that the secure whale trend could use 107K as support for entering on a later time frame to a new cycle
📈 Current outlook:
Support has been confirmed around $107K–$108K, where buyers stepped in with volume.
Short-term resistance remains at $111.6K–$113.3K — a breakout above could confirm a trend reversal.
The price is now trading in the mid-range, building strength for a possible push higher.
📊 Observation:
If BTC manages to reclaim and hold above $113K, the next leg up toward $116K could begin, signaling the start of a new uptrend cycle.
Failure to hold this recovery base would risk another test of the $107K zone.
💬 Summary:
BTC has shown strong recovery signs after defending support — momentum now points toward a possible new uptrend if it sustains above key resistance levels.

When the Dollar bleeds, Gold breathes stronger.A clear structural divergence is unfolding between XAUUSD and DXY —
Gold has printed a clean bullish market structure, while the Dollar Index mirrors it with a progressive bearish flow.
This inverse rhythm isn’t coincidence — it’s the pulse of global liquidity.
As capital rotates out of USD strength into hard assets, we’re witnessing how smart money hedges exposure against monetary uncertainty.
Each push in Gold aligns perfectly with weakness in DXY —
a synchronized dance that often precedes macro repricing in risk assets.
💭 The key insight?
Gold’s rise isn’t simply technical — it’s the market’s vote of confidence against the Dollar’s future yield.
📊 MMFLOW TRADING Insight:
“Liquidity never lies — when one side inflates, the other exhales.”

Master Correlation Strategies in Financial MarketsIntroduction
In the dynamic world of financial trading and global markets, mastering correlation strategies is a cornerstone of risk management, portfolio diversification, and strategic profit-making. Correlation — the statistical relationship between two or more assets — reveals how price movements are interconnected. Understanding these relationships enables traders, investors, and portfolio managers to forecast market behavior, hedge risks, and enhance returns. In an era dominated by algorithmic trading, quantitative analysis, and global interdependence, mastering correlation strategies has become an indispensable skill for professionals in finance.
1. The Concept of Correlation in Financial Markets
Correlation measures the degree to which two securities move in relation to one another. It is expressed as a correlation coefficient ranging from -1 to +1:
+1 (Perfect Positive Correlation): The two assets move in the same direction. For example, the S&P 500 Index and a major U.S. technology ETF often exhibit a high positive correlation.
-1 (Perfect Negative Correlation): The two assets move in opposite directions. For instance, gold and the U.S. dollar often show a negative correlation.
0 (No Correlation): The movements of the two assets are unrelated.
By analyzing correlations, traders can understand how assets behave under varying market conditions — bullish, bearish, or volatile.
2. Importance of Correlation in Trading and Investment
Mastering correlation allows investors to build robust portfolios that can withstand market shocks. The importance of correlation can be summarized as follows:
Risk Management:
Correlation analysis helps identify how portfolio components interact. High correlations among holdings increase risk exposure, while low correlations enhance stability.
Diversification:
Diversification reduces unsystematic risk. By combining assets that are not highly correlated, investors minimize losses if one segment of the portfolio declines.
Hedging:
Traders can use negatively correlated assets as hedges. For example, when equity markets fall, investors may shift funds to bonds or gold.
Macro Market Analysis:
Correlation helps identify inter-market relationships — such as between currencies, commodities, and equities — offering insights into global economic trends.
Algorithmic Strategy Development:
Quantitative traders use correlation matrices to design algorithmic models that exploit patterns and mean-reversion opportunities between correlated assets.
3. Types of Correlation in Financial Markets
There are multiple forms of correlation that traders must understand:
Static Correlation:
The traditional correlation coefficient that remains constant over a fixed time period.
Dynamic or Rolling Correlation:
Correlations are not stable; they change over time due to macroeconomic events, liquidity shifts, and investor sentiment. Rolling correlation examines relationships across moving time windows (e.g., 30-day or 90-day).
Cross-Asset Correlation:
Measures how different asset classes — such as equities, bonds, and commodities — interact. For example, bond yields often have an inverse correlation with stock prices.
Intermarket Correlation:
Tracks relationships across international markets. For example, the performance of the U.S. dollar influences emerging market equities and commodities.
Sectoral Correlation:
Within equities, correlations can vary by sector. Technology and consumer discretionary sectors may rise together during economic booms but diverge in recessions.
Lagged Correlation:
Sometimes one asset’s price movement precedes another. For instance, movements in crude oil prices often precede those in airline stocks due to cost impacts.
4. Building Correlation-Based Strategies
Mastering correlation requires applying the concept in strategic, data-driven ways. Below are several powerful correlation-based trading and investment approaches.
A. Pair Trading (Statistical Arbitrage)
Pair trading is one of the most common correlation strategies. It involves identifying two historically correlated assets. When their correlation temporarily diverges — one asset becomes undervalued while the other is overvalued — traders short the outperforming asset and go long on the underperforming one, betting that prices will converge again.
Example:
Suppose Coca-Cola (KO) and PepsiCo (PEP) typically move together.
If KO rises 5% while PEP remains flat, traders might buy PEP and short KO, expecting their prices to realign.
This strategy is market-neutral, meaning profits can be generated regardless of market direction, as long as the correlation reverts.
B. Cross-Asset Hedging
Traders often hedge exposure by using correlated assets. For instance:
A trader long on the NASDAQ 100 might short S&P 500 futures to offset systemic risk.
Commodity traders hedge oil exposure through correlated instruments like energy-sector ETFs or refining stocks.
This technique reduces portfolio volatility by offsetting correlated risks.
C. Intermarket Analysis
Correlation helps traders interpret how different markets influence each other. Examples:
A strengthening U.S. dollar often leads to falling commodity prices.
Rising Treasury yields may indicate future stock market corrections.
Increasing oil prices can signal inflationary pressures affecting currency values.
By monitoring these correlations, traders anticipate market moves before they occur.
D. Portfolio Diversification Optimization
Portfolio managers use correlation matrices to identify assets that provide maximum diversification benefits.
For instance, combining U.S. equities with gold, real estate, and bonds reduces overall portfolio variance because these assets have historically low or negative correlations with one another.
E. Volatility and Correlation Trading
In derivative markets, correlation strategies are applied using correlation swaps or dispersion trades:
A correlation swap allows traders to speculate directly on the average correlation between assets in an index.
Dispersion trading involves buying options on individual stocks while selling options on an index, profiting from the difference between implied and realized correlation.
These advanced techniques are primarily used by institutional traders and hedge funds.
5. Tools and Methods to Measure Correlation
Mastering correlation requires analytical tools and quantitative methods:
Correlation Coefficient (Pearson’s r):
A standard measure ranging from -1 to +1, used to identify the strength and direction of a linear relationship.
Spearman Rank Correlation:
Measures monotonic relationships (useful when data is not normally distributed).
Rolling Correlation Analysis:
Using statistical software or trading platforms, traders compute rolling correlations to observe how relationships evolve.
Heatmaps and Correlation Matrices:
Visual tools that show correlations between multiple assets simultaneously, allowing easy identification of diversification opportunities.
Regression Analysis:
Used to model dependencies and predict how one asset’s returns affect another’s.
Machine Learning Techniques:
Advanced models like Principal Component Analysis (PCA) or clustering algorithms help detect non-linear correlations across large datasets.
6. Challenges in Applying Correlation Strategies
While correlation is a powerful concept, it is not without limitations:
Correlation is Not Causation:
A high correlation doesn’t necessarily imply one asset influences another. Spurious correlations may lead to false signals.
Dynamic Market Behavior:
Correlations fluctuate due to macroeconomic shifts, policy changes, or crises. For example, during global recessions, correlations across assets tend to rise sharply, reducing diversification benefits.
Tail Risk and Black Swan Events:
Extreme market events often break historical correlations. During the 2008 financial crisis, previously uncorrelated assets suddenly moved together.
Overfitting in Quant Models:
Excessive reliance on historical data can lead to models that fail under real-world conditions.
Liquidity and Execution Risks:
In pair or correlation trades, slippage and liquidity constraints can erode profitability.
7. Correlation Dynamics in Different Market Environments
Understanding how correlations evolve under various conditions is key to mastering this strategy.
Bull Markets:
Equity correlations tend to decrease as investors pursue diverse risk assets.
Diversification benefits are more visible, and pair trading strategies perform well.
Bear Markets:
Correlations across asset classes often increase as investors move to safe havens.
Portfolio diversification becomes less effective, and hedging becomes essential.
Volatile or Uncertain Markets:
Dynamic correlation tracking helps traders detect sudden changes in market relationships.
Correlation-based hedging and volatility arbitrage strategies become valuable.
8. Role of Correlation in Algorithmic and Quantitative Trading
Quantitative funds and algorithmic trading systems rely heavily on correlation analysis:
High-Frequency Trading (HFT): Algorithms detect microsecond-level correlation changes to exploit arbitrage opportunities.
Machine Learning Models: Predictive models use multi-asset correlation patterns to forecast market direction.
Portfolio Optimization Algorithms: Quant funds use correlation matrices to rebalance holdings dynamically.
Correlation Arbitrage: Institutional players identify mispriced assets using multi-dimensional correlation structures.
9. Case Studies: Correlation in Action
A. Gold and U.S. Dollar
Historically, gold and the U.S. dollar exhibit strong inverse correlation. When the dollar weakens due to inflation or monetary easing, gold tends to rise as investors seek protection against currency devaluation.
B. Crude Oil and Equity Markets
Oil prices often move in tandem with equity markets in growth periods but diverge during inflationary shocks or geopolitical disruptions.
C. Bitcoin and Tech Stocks
Recent data show Bitcoin increasingly correlated with technology equities, reflecting its risk-on asset behavior in global liquidity cycles.
10. The Future of Correlation Strategies
The future of correlation strategies is shaped by technology, globalization, and behavioral finance.
Machine learning, big data analytics, and artificial intelligence are enabling real-time correlation tracking across vast datasets, enhancing predictive power. Cross-asset and inter-market relationships are becoming increasingly complex due to algorithmic participation and geopolitical dynamics.
Moreover, deglobalization trends, supply chain shifts, and digital assets are creating new correlation structures that traders must monitor closely. As financial systems evolve, mastering dynamic, adaptive correlation strategies will remain a decisive advantage.
Conclusion
Mastering correlation strategies is not merely a technical skill; it is a comprehensive approach to understanding market interconnectivity, risk, and opportunity. By studying how assets move in relation to one another, traders and investors can craft resilient portfolios, design profitable arbitrage models, and navigate volatility with confidence.
In essence, correlation is the language of relationships within global finance. The true mastery lies in not only recognizing those relationships but also anticipating when they will shift — turning statistical insight into strategic foresight.
Introduction and Types of Financial MarketsIntroduction to Financial Markets
Financial markets form the backbone of any modern economy, serving as a bridge between investors seeking returns and borrowers in need of capital. Essentially, a financial market is a marketplace where buyers and sellers trade financial instruments such as stocks, bonds, currencies, and derivatives. These markets facilitate the allocation of resources efficiently, ensuring that funds flow from those who have surplus capital to those who can utilize it productively.
Financial markets are integral to economic growth. They not only provide a mechanism for raising capital but also aid in price discovery, risk management, liquidity creation, and wealth management. By providing transparency and efficiency, financial markets reduce the cost of capital for firms and promote economic stability.
Key Functions of Financial Markets
Capital Formation: Financial markets enable firms and governments to raise funds by issuing securities, which can then be used for expansion, infrastructure, or social development.
Price Discovery: They provide a platform where the prices of financial assets are determined through supply-demand interactions.
Liquidity: Investors can quickly convert their securities into cash, enhancing market confidence.
Risk Management: Derivative markets allow participants to hedge against risks like fluctuations in interest rates, commodity prices, and currencies.
Efficient Resource Allocation: By channeling funds from savers to productive investments, financial markets ensure that capital is allocated to sectors promising the highest returns.
Classification of Financial Markets
Financial markets can be classified in multiple ways depending on the instruments traded, the maturity of instruments, and the nature of participants. Broadly, they are categorized into money markets, capital markets, derivative markets, foreign exchange markets, and commodity markets.
1. Money Market
The money market deals with short-term debt instruments with maturities of one year or less. It is crucial for maintaining liquidity in the financial system. The primary participants in the money market are commercial banks, central banks, corporations, and government entities.
Key Features:
Short-term instruments (up to 1 year)
High liquidity
Low risk compared to long-term securities
Primarily used for managing working capital
Instruments in the Money Market:
Treasury Bills (T-Bills): Government-issued securities with maturities ranging from a few days to one year. They are low-risk instruments used for short-term financing.
Commercial Papers (CPs): Unsecured promissory notes issued by corporations to meet short-term funding needs.
Certificates of Deposit (CDs): Bank-issued instruments for fixed deposits with short maturities, offering liquidity and moderate returns.
Repurchase Agreements (Repos): Short-term borrowing agreements for selling and repurchasing government securities.
The money market ensures stability by providing a channel for short-term funds and helps in implementing monetary policy by regulating liquidity.
2. Capital Market
The capital market focuses on long-term financial instruments with maturities exceeding one year. It is vital for raising long-term funds for business expansion, infrastructure development, and national projects. The capital market is divided into primary markets and secondary markets.
a) Primary Market (New Issue Market):
This is where new securities are issued directly to investors. Companies raise funds by issuing equity (shares) or debt (bonds). The process of issuing new securities is commonly known as an Initial Public Offering (IPO) for equity.
b) Secondary Market (Stock Exchanges):
Here, previously issued securities are bought and sold among investors. Stock exchanges like the New York Stock Exchange (NYSE) or National Stock Exchange (NSE) in India provide a platform for liquidity, price discovery, and risk-sharing.
Instruments in the Capital Market:
Equities (Shares): Represent ownership in a company, entitling shareholders to profits in the form of dividends.
Bonds/Debentures: Long-term debt instruments issued by corporations or governments to raise capital.
Mutual Funds: Pooled investment vehicles that invest in stocks, bonds, or other securities, offering diversification to small investors.
Significance of Capital Markets:
Mobilize savings for productive use
Facilitate wealth creation for investors
Support economic growth through capital formation
3. Derivative Market
Derivatives are financial contracts whose value derives from underlying assets like stocks, bonds, currencies, or commodities. The derivative market allows participants to hedge against risks or speculate for potential gains.
Key Types of Derivatives:
Futures Contracts: Agreements to buy or sell an asset at a predetermined price on a future date.
Options Contracts: Contracts that give the buyer the right (but not obligation) to buy or sell an asset at a specified price within a certain period.
Swaps: Agreements to exchange cash flows or other financial instruments between parties, commonly used for interest rate or currency risk management.
Functions of Derivative Markets:
Hedging against price or interest rate fluctuations
Enhancing market liquidity
Enabling price discovery for underlying assets
While derivatives can be used to manage risk, excessive speculation in this market may introduce volatility.
4. Foreign Exchange (Forex) Market
The foreign exchange market is a global decentralized market for trading currencies. It determines the relative value of one currency against another and supports international trade and investment.
Key Features:
Operates 24/7 across different time zones
Facilitates currency conversion for trade and investment
Influences inflation, interest rates, and trade balances
Major Participants:
Commercial banks
Central banks
Multinational corporations
Hedge funds and retail investors
Functions:
Provides exchange rate mechanism
Manages currency risk through hedging instruments like forwards and options
Supports global liquidity and capital flows
5. Commodity Market
The commodity market deals with trading physical goods such as metals, energy products, agricultural produce, and more. Commodity markets are split into spot markets (immediate delivery) and futures markets (contracts for future delivery).
Major Commodities Traded:
Agricultural Products: Wheat, corn, coffee, sugar
Energy Commodities: Crude oil, natural gas, coal
Metals: Gold, silver, copper
Significance:
Provides a hedging mechanism for producers and consumers
Helps in price discovery and risk management
Promotes efficient allocation of resources in the economy
6. Over-the-Counter (OTC) Market
In addition to organized exchanges, many financial instruments are traded directly between parties in OTC markets. This includes derivatives, currencies, and bonds. OTC markets are less regulated than exchanges but provide flexibility in contract terms and counterparty customization.
Emerging Trends in Financial Markets
Financial markets are evolving rapidly due to technology, globalization, and regulatory reforms. Some notable trends include:
Digital Trading Platforms: Online stock brokers and mobile apps have made investing accessible to retail investors worldwide.
Algorithmic and High-Frequency Trading: Automated systems now execute trades at millisecond speeds, enhancing market efficiency.
Cryptocurrency and Blockchain: Digital currencies like Bitcoin and Ethereum are creating decentralized markets independent of traditional financial systems.
Sustainable Finance: ESG (Environmental, Social, and Governance) investing is growing, promoting socially responsible investment practices.
Global Integration: Capital flows across borders are increasing, creating interconnected markets that respond rapidly to international economic events.
Conclusion
Financial markets are the lifeblood of any economy, serving as a conduit for savings, investment, and capital formation. By facilitating efficient resource allocation, providing liquidity, enabling risk management, and supporting economic growth, these markets create opportunities for individuals, corporations, and governments alike.
From the short-term money market to the long-term capital market, from derivatives and forex trading to commodity markets, each segment serves a unique function, contributing to the stability and growth of the financial ecosystem. With technological advancements and globalization, financial markets continue to evolve, providing innovative tools and opportunities for investors while shaping the future of economic development.
Understanding the structure and function of these markets is crucial for policymakers, investors, and businesses, as it enables informed decisions, better risk management, and strategic planning in a dynamic global economy.
XAUUSD (GOLD) 15 Min – Bullish Setup Forming TVC:GOLD
Market Overview
Gold has recovered beautifully after the pullback and is now consolidating just above the demand base. The structure shows a potential higher-low formation, signaling bullish momentum buildup. If price breaks above 4,165, continuation toward the top resistance zone (around 4,178) is expected.
Key Scenarios
✅ Bullish Case 🚀 → Possible rally continuation toward 🎯 4,165 → 🎯 4,178
❌ Bearish Case 📉 → Invalidation below the demand zone near 4,132
Current Levels to Watch
Resistance 🔴 : 4,165 – 4,178
Support 🟢 : 4,132 – 4,145
⚠️ Disclaimer: This analysis is for educational purposes only. Not financial advice.

GOLD (1H) – Bullish Continuation SetupTVC:GOLD
🚀
Structure | Trend | Key Reaction Zones
Price has perfectly respected previous demand zones and formed higher highs & higher lows 🔼
After reaccumulation near 4100–4120, momentum remains bullish with a clean structure breakout.
Current move is building pressure toward the Top Rejection Zone (4178–4185) where next liquidity lies.
Market Overview
Gold continues to trade within a strong bullish environment. The recent demand zone at 4100–4120 acted as a perfect base for institutional re-entry, fueling fresh upside pressure. As price consolidates above 4150, breakout confirmation above 4166 will open clean traffic toward the 4180–4200 resistance zone. Buyers remain dominant while the structure supports continuation.
Key Scenarios
✅ Bullish Case 🚀 → 🎯 Target 1: 4178 → 🎯 Target 2: 4188 → 🎯 Target 3: 4200
❌ Bearish Case 📉 → Invalidation below 4130
Current Levels to Watch
Resistance 🔴: 4178 – 4188 – 4200
Support 🟢: 4130 – 4100
⚠️ Disclaimer: This analysis is for educational purposes only. Not financial advice.

Difference Between Forward and Futures Forex Markets1. Definition and Basic Concept
Forward Market:
A forward forex contract is a private agreement between two parties to buy or sell a specific amount of a currency at a predetermined rate on a future date. It is a customizable contract where the terms—such as amount, delivery date, and exchange rate—are negotiated directly between the buyer and the seller.
Futures Market:
A futures forex contract, on the other hand, is a standardized agreement traded on an organized exchange (such as the Chicago Mercantile Exchange - CME) to buy or sell a currency at a set price on a specific future date. Futures contracts are governed by exchange rules and are not negotiable between individuals.
Example:
If an Indian importer knows they must pay $1 million in three months, they can lock in today’s rate with a forward contract negotiated with their bank. Alternatively, they could use a futures contract on the exchange to hedge the same exposure, but under standardized terms.
2. Trading Venue and Regulation
Forward Market:
The forward forex market is Over-the-Counter (OTC), meaning trades occur directly between parties—usually through banks, brokers, or large financial institutions. It is unregulated compared to futures markets, giving flexibility but also introducing counterparty risk.
Futures Market:
Futures contracts are traded on regulated exchanges, ensuring transparency, standardized contract sizes, and proper oversight by authorities such as the Commodity Futures Trading Commission (CFTC) in the U.S. This makes the futures market more secure and trustworthy for investors.
Key Difference:
OTC forward markets offer privacy and customization, whereas futures markets emphasize standardization, regulation, and transparency.
3. Contract Customization
Forward Market:
Forward contracts are fully customizable. Parties can decide the exact amount, currency pair, settlement date, and method of delivery. This flexibility suits businesses and institutions with specific hedging needs.
Futures Market:
Futures contracts are standardized in terms of contract size, maturity dates (e.g., March, June, September, December), and settlement procedures. Traders must accept these fixed terms, which can limit flexibility but make trading easier for speculative purposes.
Example:
A company wanting to hedge €2.5 million in three months can easily set that amount in a forward contract. In contrast, a futures contract might have a fixed lot size (say, €125,000 per contract), so the company would need to trade multiple contracts to approximate the desired amount.
4. Settlement and Delivery
Forward Market:
Settlement occurs on the agreed future date, and most forward contracts end in actual delivery of the currencies. However, some may be settled in cash based on the difference between the agreed rate and the spot rate at maturity.
Futures Market:
Most futures contracts are cash-settled before expiry, as traders often close their positions before the delivery date. Only a small percentage result in physical delivery of the currencies.
Key Point:
Forwards typically end with physical delivery, while futures are mainly used for speculation and hedging without actual currency exchange.
5. Counterparty Risk
Forward Market:
Since forwards are private agreements, there is a high counterparty risk—the possibility that one party may default on the contract. There is no intermediary guaranteeing the trade.
Futures Market:
Futures contracts eliminate counterparty risk because the exchange clearing house acts as the intermediary, guaranteeing that both sides meet their obligations. Traders must maintain margin accounts to manage default risk.
Result:
Futures offer greater security due to exchange-backed settlement mechanisms.
6. Mark-to-Market and Margin Requirements
Forward Market:
Forward contracts are not marked to market, meaning profits or losses are realized only at the contract’s maturity. No margin or daily settlement is required.
Futures Market:
Futures contracts are marked to market daily, meaning gains and losses are settled every trading day. Traders must maintain margin accounts (initial and maintenance margins) to cover potential losses, ensuring market integrity.
Example:
If the exchange rate moves unfavorably in a futures position, the trader must deposit additional funds to maintain their margin. In forwards, the loss or gain is realized only at the end.
7. Liquidity and Market Participants
Forward Market:
Liquidity in forwards depends on the specific currency pair and the parties involved. It’s dominated by banks, multinational corporations, and institutional investors seeking to hedge specific exposures.
Futures Market:
The futures market is highly liquid due to standardized contracts and participation from a wide range of players—hedgers, speculators, and institutional traders. Continuous trading ensures tight spreads and efficient pricing.
In summary:
Forwards serve mainly for hedging; futures attract both hedgers and speculators due to liquidity and transparency.
8. Purpose and Usage
Forward Market:
Primarily used for hedging long-term exposures. Forwards protect against adverse currency movements for future transactions like exports, imports, or loans in foreign currencies.
Futures Market:
Used for both hedging and speculation. Hedge funds and traders use futures to profit from short-term price movements in currency pairs or to manage portfolio risk efficiently.
Example:
A corporate treasurer uses forwards to hedge a future payment, while a speculator might use futures to bet on the dollar strengthening against the euro.
9. Pricing and Cost Structure
Forward Market:
Forward prices are determined by the interest rate differential between the two currencies and the current spot rate. There are no exchange fees, but the pricing may include a bank’s spread or commission.
Futures Market:
Futures prices are also influenced by interest rate differentials but may deviate slightly from forward rates due to daily margin settlements and market expectations. Traders also pay exchange and brokerage fees.
Key Insight:
Forward pricing is customized and negotiated privately, while futures pricing is transparent and visible on exchanges.
10. Transparency and Accessibility
Forward Market:
Forward markets are less transparent, as prices and deals are not publicly available. Only large players like banks and corporations typically participate due to the high transaction size.
Futures Market:
Futures markets are highly transparent. Prices, trading volumes, and open interest data are publicly available in real time, enabling fair competition and analysis for all traders.
Final Comparison:
Transparency in futures ensures fairness and easier access for retail and institutional investors, while forwards remain largely institutional and relationship-based.
Conclusion
While both forward and futures forex markets allow participants to hedge or speculate on future currency movements, their structure, purpose, and participants differ greatly.
Forwards offer customization and flexibility but come with higher counterparty risk and limited liquidity.
Futures provide standardization, security, and transparency, making them ideal for speculative trading and risk management in a regulated environment.
In summary:
Aspect Forward Market Futures Market
Trading Venue OTC (Private) Exchange-Traded
Customization Fully customizable Standardized
Regulation Unregulated Regulated
Settlement On maturity Daily (mark-to-market)
Counterparty Risk High Minimal
Participants Corporates, Banks Traders, Investors
Transparency Low High
Liquidity Moderate High
Margin Requirement None Required
Usage Long-term hedging Hedging & speculation
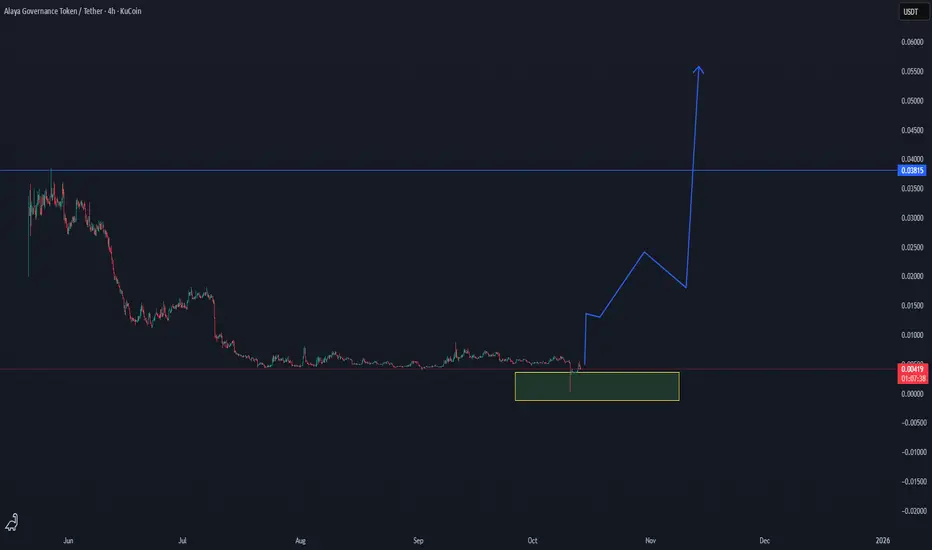
AGT/USDT — Breakout Formation from Accumulation Zone ImminentAGT/USDT — Breakout Formation from Accumulation Zone Imminent 🚀
AGT has entered a strong accumulation zone after a prolonged downtrend, showing the first technical signs of a potential trend reversal. The current consolidation within the highlighted support block suggests that buyers are stepping in, preparing for a possible breakout phase.
Low time frame confirmation is here
📊 Current Price: $0.0042
🟢 Accumulation Zone: $0.0038 – $0.0045
🔹 Breakout Target: $0.038
The chart shows a typical bottoming structure, with a long accumulation base forming under historical resistance. Once AGT confirms a breakout above $0.006, momentum could accelerate rapidly — targeting the $0.02 → $0.038 zones.
This setup mirrors classic early-cycle patterns seen before major upward expansions in similar low-cap assets. A strong breakout candle with volume will serve as confirmation of the next phase.
📈 Technical Outlook:
Accumulation structure in place
Breakout trigger above $0.006–$0.007
Main breakout target around $0.038
Summary:
AGT/USDT is building strength at the bottom of its range. If volume confirms, a major reversal cycle could be underway, opening the path toward a breakout to $0.038 and beyond.
🎯 Targets: $0.02 → $0.038
📊 Bias: Bullish — Breakout Setup Forming
BTCUSD 2H – Demand Reaction, Bullish Continuation Expected BITSTAMP:BTCUSD
Structure | Trend | Key Reaction Zones
BTC completed a strong liquidity grab near the supply rejection zone, confirming heavy distribution.
Price has now dropped into the strong demand box, aligning perfectly with the previous accumulation area.
Structure remains corrective within a macro bullish context — looking for confirmation candles from demand.
Market Overview
Bitcoin faced rejection at the supply zone after multiple liquidity sweeps, sending it into a 6K-point decline. However, the current price is sitting on the key demand region around 109–111K, which previously acted as the launch base for a massive uptrend. Market structure suggests potential absorption and re-accumulation here — a clean setup for a bullish continuation once buyers confirm strength.
Key Scenarios
✅ Bullish Case 🚀 → 🎯 Target 1 : 114K | 🎯 Target 2 : 118K | 🎯 Target 3 : 120K
❌ Bearish Case 📉 → 🎯 Target 1 : 109K | 🎯 Target 2 : 108K
Current Levels to Watch
Resistance 🔴 : 114K – 118K
Support 🟢 : 109K – 108K
⚠️ Disclaimer: For educational purposes only. Not financial advice.

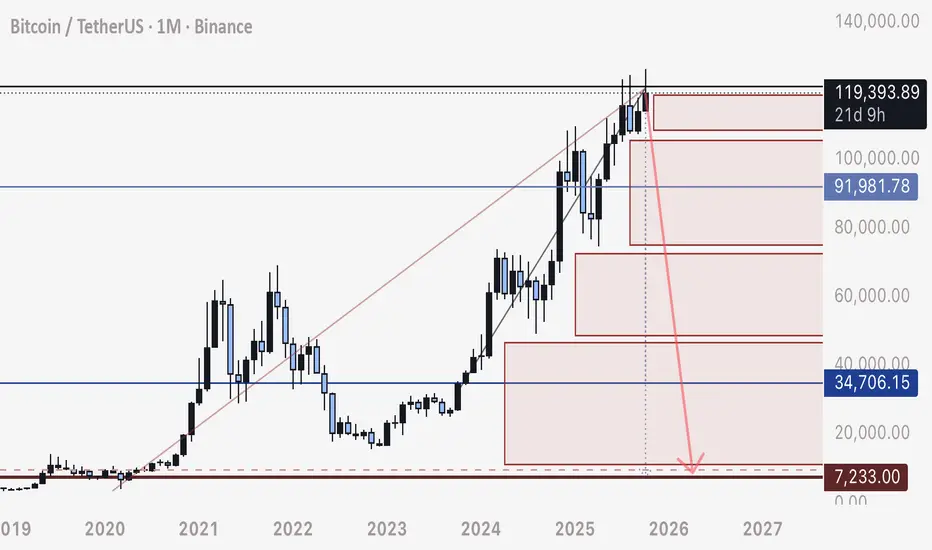
Why BTC will drop at EXTREME SPEED to 8,000This is a Segway off of all my recent posts, and here we will apply the same understanding of stop loss and liquidation order blocks to the 1 Month.
Bitcoin has been moving in a straight upwards consolidation with no actual retrace since Dec 2022.
What this does, is attract mass amount of stop loss orders, intact and left in place, through the whole movement.
These stop loss orders will create a natural cascading drop as they all fill, exponentially moving more and more liquidity out of BTC and into USD/ USDT.
Bitcoin will drop, at exceptional speed, and the chart tells us the whole story.
Be safe.
- DD
Currency Convertibility Issues in the Global MarketIntroduction
Currency convertibility is one of the fundamental pillars of the global financial system. It determines how freely a nation’s currency can be exchanged for foreign currencies, influencing trade, investment, and international economic stability. In a world increasingly interconnected through globalization, the concept of currency convertibility is central to understanding how nations engage in global commerce and finance. However, the issue of currency convertibility is complex and often tied to a country’s monetary policy, balance of payments, capital control measures, and overall economic health.
This essay explores the concept of currency convertibility in the global market, its types, significance, challenges, and the major issues that affect countries’ decisions to make their currencies fully convertible. It also examines case studies of economies that have struggled or succeeded with convertibility and provides an outlook on how currency convertibility impacts the global financial ecosystem.
1. Meaning of Currency Convertibility
Currency convertibility refers to the ease with which a country’s currency can be converted into another currency or gold. It represents the degree of freedom that individuals, businesses, and investors have in exchanging domestic currency for foreign currencies for trade, investment, or travel purposes.
Essentially, convertibility is an indicator of how open an economy is to international financial flows. When a currency is fully convertible, it can be freely exchanged without restrictions for any purpose. When it is partially convertible, certain limitations exist—usually to control capital outflow or to stabilize the domestic economy.
2. Types of Currency Convertibility
Currency convertibility is generally categorized into two main types:
a. Current Account Convertibility
This allows the exchange of domestic currency for foreign currency for trade in goods and services, interest payments, and remittances. It ensures smooth international trade and reflects a country’s openness to global commerce.
Most nations, including India, have achieved current account convertibility. This means residents can pay for imports or receive export payments in foreign currencies freely.
b. Capital Account Convertibility
This involves the freedom to convert domestic financial assets into foreign assets and vice versa. It allows unrestricted movement of capital across borders—such as investment in foreign stocks, bonds, real estate, or repatriation of profits.
While this form of convertibility attracts foreign direct investment (FDI) and portfolio flows, it can also expose the domestic economy to external shocks and speculative capital movements.
3. Importance of Currency Convertibility in the Global Market
Currency convertibility plays a vital role in integrating national economies into the global system. Its importance can be highlighted through several key dimensions:
Facilitating International Trade:
Convertibility enables smooth cross-border transactions, reducing transaction costs and delays. Exporters and importers can easily settle payments in international currencies like the US dollar or euro.
Encouraging Foreign Investment:
Foreign investors prefer investing in economies where they can easily convert their earnings into other currencies. Full convertibility signals economic openness and financial maturity.
Enhancing Market Confidence:
A convertible currency reflects the stability and credibility of a nation’s monetary policy. It builds confidence among traders, investors, and international partners.
Improving Resource Allocation:
When funds can flow freely across borders, resources are allocated more efficiently, and economies can tap into global capital pools.
Promoting Globalization:
Convertibility supports global integration, allowing citizens and companies to participate more actively in the international economy.
4. Challenges and Risks of Currency Convertibility
While currency convertibility brings several advantages, it also presents significant challenges and risks, especially for developing economies.
a. Exchange Rate Volatility
Full convertibility can expose a nation’s currency to global market fluctuations. Speculative attacks and sudden changes in capital flows can destabilize the exchange rate, leading to inflationary pressures or currency depreciation.
b. Capital Flight
When investors lose confidence in a country’s economy, unrestricted capital convertibility can lead to massive capital outflows. This can drain foreign exchange reserves and weaken the domestic currency.
c. Loss of Monetary Control
With full capital account convertibility, central banks may find it difficult to manage monetary policy effectively, as large inflows and outflows can disrupt domestic liquidity and interest rates.
d. External Shocks
Global crises, such as the 2008 financial meltdown, highlight how interconnected financial markets can transmit risks rapidly. Countries with fully convertible currencies may face contagion effects more severely.
e. Inflation and Economic Instability
Sudden currency depreciation due to speculative pressures can raise import costs, leading to inflation and economic instability, particularly in countries dependent on imports for essential goods.
5. Case Studies: Global Experiences with Currency Convertibility
a. India
India has achieved current account convertibility since 1994 but still maintains partial capital account convertibility. The Reserve Bank of India (RBI) exercises control over capital flows to prevent volatility and speculative attacks. The cautious approach helped India withstand crises such as the Asian Financial Crisis (1997) and the Global Financial Crisis (2008).
b. China
China’s yuan (CNY) has been gradually moving toward greater convertibility. While trade-related transactions are largely convertible, capital account restrictions remain. China maintains tight control over capital flows to manage its exchange rate and protect economic stability.
c. Argentina
Argentina’s experience serves as a cautionary tale. In the 1990s, it adopted full convertibility by pegging its currency to the US dollar. While initially stabilizing inflation, it later led to economic collapse due to inflexible policies, capital flight, and loss of competitiveness.
d. Developed Economies (U.S., U.K., Eurozone)
Fully convertible currencies like the US Dollar, Euro, and British Pound dominate global trade and finance. Their stable economies, robust institutions, and deep financial markets enable them to sustain full convertibility with minimal disruption.
6. The Role of International Institutions
International organizations like the International Monetary Fund (IMF) and the World Bank play crucial roles in guiding countries toward managed currency convertibility.
The IMF’s Article VIII encourages member nations to remove restrictions on current account transactions but advises caution regarding capital account liberalization. It promotes gradual, sequenced reforms to avoid destabilizing the economy.
7. Factors Influencing a Country’s Currency Convertibility Decision
A nation’s decision to move toward full convertibility depends on several economic and political factors:
Macroeconomic Stability:
Low inflation, sustainable fiscal deficits, and stable growth are prerequisites for safe convertibility.
Foreign Exchange Reserves:
Adequate reserves ensure that the country can handle fluctuations in capital flows.
Financial Market Depth:
Developed financial markets can absorb capital movements efficiently without destabilizing the economy.
Exchange Rate Regime:
Flexible exchange rate systems are generally better suited for managing convertibility risks.
Institutional Strength and Governance:
Transparent regulatory systems and strong institutions reduce corruption and speculative behavior.
8. The Debate: Full vs. Partial Convertibility
Economists often debate whether developing nations should pursue full convertibility.
Proponents argue that it boosts foreign investment, promotes efficiency, and integrates the economy globally.
Critics warn that premature convertibility can expose the economy to crises, as seen in Latin America and Southeast Asia during the late 20th century.
The consensus among policymakers today is that gradual liberalization, backed by strong macroeconomic fundamentals, is the safest path.
9. The Future of Currency Convertibility in the Global Market
As the world moves toward digital currencies, blockchain, and fintech innovations, the landscape of currency convertibility is rapidly evolving. Central Bank Digital Currencies (CBDCs), for instance, could simplify cross-border transactions and make convertibility more efficient and transparent.
Moreover, the rise of the Chinese yuan and the decline of dollar dominance could reshape how currencies are exchanged globally. Emerging markets are also exploring regional payment systems and currency swap agreements to reduce dependency on traditional reserve currencies.
However, the fundamental challenge remains the same: balancing openness with stability. Policymakers must ensure that liberalization does not come at the cost of economic security.
10. Conclusion
Currency convertibility is a cornerstone of international economic integration, enabling trade, investment, and global cooperation. Yet, it remains a double-edged sword. While full convertibility symbolizes economic maturity and confidence, it also requires strong institutions, sound fiscal management, and robust financial systems.
For developing economies, the path toward full convertibility must be gradual, strategic, and supported by macroeconomic stability. India, China, and several other emerging markets demonstrate that measured liberalization, rather than abrupt openness, provides the best results.
In the evolving global financial landscape—marked by digital transformation, shifting geopolitical alliances, and economic uncertainty—understanding and managing the issues surrounding currency convertibility will continue to be a defining factor in shaping the world’s economic future.

ETHUSD 1H – Bulls Gaining StrengthBITSTAMP:ETHUSD
📊 🚀
Structure | Trend | Key Reaction Zones
ETH retested the strong demand zone (4400–4450) and showed a clear bullish reaction, reclaiming short-term structure with higher lows forming.
Market Overview
After the sharp rejection from the 4750 resistance zone, ETH entered accumulation and tapped the key demand box. Price is now showing momentum recovery with bullish candles breaking back above the 4500 level, indicating potential continuation toward upper resistance levels.
Key Scenarios
✅ Bullish Case 🚀 → 🎯 Target 1: 4620 | 🎯 Target 2: 4670 | 🎯 Target 3: 4750
❌ Bearish Case 📉 → Break below 4450 may shift bias back toward 4400.
Current Levels to Watch
Resistance 🔴: 4620 – 4670 – 4750
Support 🟢: 4450 – 4400
⚠️ Disclaimer: This analysis is for educational purposes only. Not financial advice.

ETHUSD – 1H | Bullish Reversal from Demand ZoneBITSTAMP:ETHUSD
Structure | Trend | Key Reaction Zones
Market retested the 4,440–4,465 strong demand zone, respecting structure after a deep liquidity sweep.
Overall structure remains bullish, with previous accumulation and breakout zones aligning with channel support.
Market Overview
ETH completed a sharp correction after facing rejection near 4,758 resistance, tapping into the demand base where buyers previously stepped in. With liquidity cleared and demand reaction visible, a bullish continuation is likely if price holds above 4,465.
Key Scenarios
✅ Bullish Case 🚀 →
🎯 Target 1: 4,535
🎯 Target 2: 4,621
🎯 Target 3: 4,672 (major resistance retest)
❌ Bearish Case 📉 →
Invalidation below 4,413 (break of demand zone).
Current Levels to Watch
Resistance 🔴: 4,621 / 4,672
Support 🟢: 4,465 / 4,413
⚠️ Disclaimer: This analysis is for educational purposes only. Not financial advice.
