BTC STILL IN TREND FOR MORE.. UPDATE 04-10-2025📊 Market Update
Bitcoin (BTC):
Bitcoin is maintaining its main upward trend, which continues to define the overall bullish structure. At the moment, BTC is trading in a new lower time-frame zone and needs to hold above $121.6K to confirm a green (bullish) structure on the lower time frame.
Bitcoin is positive until now
Marketmaker

AFTER END OF CYCLE BTC CAN RETURN BELOW 110K - 90K📊 BTC/USDT Market Update
Current Price: ~$113,509
Cycle Recap: From the $84,000 low to the $114,000 high, BTC has completed what looks like an end of cycle phase (as marked on chart).
We did explain here the end of the cycle
There is a high chance in the coming time that BTC will break down below 110K and enter the correction zone.

US100 Trend Watch – Critical LevelsUS100 Update
On the low time frame, US100 is consolidating around the 24,603 – 24,655 zone after rejecting higher levels.
Key levels:
24,655 – 24,603 → short-term resistance zone. A breakout and hold above would confirm bullish continuation.
24,158 → main trend support. As long as this level holds, the broader bullish structure remains intact.
Upside scenario: If price breaks and sustains above 24,655, momentum could extend further to test 25,000+.
Downside risk: If price falls below 24,603 and especially under 24,158, risk increases for a deeper pullback toward 23,800 – 23,400.
📌 Summary
Above 24,655 → bullish continuation toward new highs.
Hold above 24,158 → uptrend structure remains safe.
Below 24,158 → deeper correction risk, next support at 23,400.

EUR/USD Trend Watch – Critical Supports & ResistanceEUR/USD Update
On the low time frame, EUR/USD is moving sideways around 1.1780, holding just below the 1.1810 zone.
Key levels:
1.1810 – 1.1846 → resistance zone. A breakout and hold above would confirm bullish continuation toward 1.1922.
1.1774 → immediate support on the low time frame. Losing this level increases pressure on the main trend.
Upside scenario: If EUR/USD can reclaim 1.1810+, momentum may shift bullish, with the next target at 1.1922.
Downside risk: Failure to hold above 1.1774 opens the door for a correction toward 1.1660 and possibly 1.1568 – 1.1530 cycle support.
Cycle support: 1.1530 – 1.1568 remains the must-hold long-term zone to keep the bullish cycle alive.
📌 Summary
Above 1.1810 – 1.1846 → bullish continuation toward 1.1922.
Below 1.1774 → risk of deeper correction, watch 1.1660 next.
Cycle zone 1.1530 – 1.1568 → critical long-term support.

XAU/USD UpdateXAU/USD Update
We use advanced data that counts the start of the cycle and all important key levels.
On the low time frame, Gold is showing strength after reclaiming the 3,664 – 3,657 zone, turning it into a support.
Key levels:
3,664 – 3,657 → support zone. Holding above this confirms continuation of the uptrend.
3,684 → current resistance being tested. A breakout above this level would confirm bullish momentum and open the way for a move toward higher targets (3,720+).
As long as price stays above the support, Gold remains bullish in structure.
Risk scenario: If price falls back below 3,657, downside pressure may return, with 3,463 as the next major support.
Cycle support: 3,267 is a critical long-term level. Gold must hold this area to maintain the broader green cycle trend.
📌 Summary
Above 3,664 – 3,657 → bullish continuation confirmed.
Break above 3,684 → opens further upside targets.
Below 3,657 → downside risk increases, watch 3,463 as key support.
3,267 → major cycle support for long-term trend.

Financial Market CoverageUnderstanding the Backbone of Modern Finance
Introduction
Financial markets are the lifeblood of the global economy. They provide the infrastructure for the allocation of capital, risk management, and wealth creation. However, the true power of financial markets lies not just in their existence, but in how they are observed, analyzed, and reported. This is where financial market coverage comes in—an essential mechanism that informs investors, regulators, policymakers, and the public about the constantly evolving financial ecosystem.
Financial market coverage is more than reporting stock prices or bond yields. It encompasses the analysis of macroeconomic trends, corporate performance, policy changes, market sentiment, and geopolitical events. Effective coverage ensures transparency, fosters confidence, and enables participants to make informed decisions. In this discussion, we will explore the scope, methods, challenges, and future of financial market coverage.
The Scope of Financial Market Coverage
Financial market coverage extends across multiple segments, each with its unique nuances and stakeholders. Key areas include:
1. Equity Markets
Equity markets, or stock markets, are arguably the most visible segment. Coverage here involves:
Stock Price Movements: Tracking real-time prices, indices, and market trends.
Company Analysis: Evaluating earnings, management strategies, mergers, acquisitions, and other corporate actions.
Sectoral Analysis: Comparing performance across sectors such as technology, healthcare, or energy.
Market Sentiment: Understanding investor psychology through trading volume, options activity, and news flow.
2. Fixed Income and Bond Markets
Bond markets are critical for funding governments and corporations. Coverage involves:
Yield Movements: Monitoring interest rate trends, yield curves, and bond spreads.
Credit Analysis: Assessing corporate and sovereign creditworthiness.
Policy Implications: Evaluating central bank actions and their effects on debt markets.
3. Derivatives and Commodities
Derivatives such as futures and options provide hedging and speculative opportunities. Coverage includes:
Price Volatility: Tracking commodity prices (oil, gold, agricultural products) and derivative contracts.
Market Structure: Observing open interest, options chains, and leverage trends.
Risk Indicators: Monitoring implied volatility indices like VIX.
4. Foreign Exchange and Currency Markets
The forex market is the largest and most liquid. Coverage includes:
Currency Pairs: Tracking movements in major and emerging market currencies.
Global Trade Impacts: Understanding how exchange rate fluctuations affect trade and investment.
Central Bank Interventions: Monitoring interest rate decisions and monetary policy adjustments.
5. Alternative Investments
Alternative assets such as private equity, hedge funds, and cryptocurrencies are increasingly covered due to their growing influence. Coverage examines:
Market Trends: Adoption rates, liquidity, and performance metrics.
Regulatory Risks: Monitoring government policies and enforcement actions.
Investor Interest: Tracking institutional and retail participation.
Methods and Channels of Financial Market Coverage
Financial market coverage employs multiple methods, tools, and media channels:
1. Traditional Media
Newspapers and Magazines: Financial dailies like The Wall Street Journal and Economic Times provide daily market summaries.
Television Channels: CNBC, Bloomberg TV, and local financial channels offer live analysis and expert interviews.
Radio and Podcasts: Financial talk shows provide commentary and insights for casual investors.
2. Digital Platforms
Financial Websites and Portals: Platforms like Bloomberg, Reuters, and Moneycontrol deliver real-time updates.
Mobile Apps: Trading apps and news apps provide push notifications and analytical tools.
Social Media: Twitter, LinkedIn, and specialized forums allow rapid dissemination and crowd-sourced sentiment.
3. Analytical Tools
Charting Software: Technical analysis relies on historical price charts and pattern recognition.
Financial Models: Fundamental analysis uses valuation models, discounted cash flows, and ratios.
AI and Big Data: Machine learning models analyze vast datasets to predict market trends and detect anomalies.
4. Institutional Reports
Brokerage Reports: Analysts provide in-depth research reports with buy/sell recommendations.
Investment Bank Publications: Macro and sectoral insights influence market perception and trading strategies.
Regulatory Disclosures: Filings such as 10-Ks, 10-Qs, and prospectuses provide authoritative information.
The Role of Financial Journalists and Analysts
Coverage is not just about raw data; interpretation is critical. Financial journalists and analysts bridge this gap:
Journalists: Provide context, highlight market-moving news, and summarize complex events in understandable language.
Analysts: Offer technical insights, forecasts, and actionable recommendations.
Influencers and Educators: Thought leaders shape sentiment and influence retail participation.
A balanced coverage ecosystem combines speed with accuracy, commentary with data, and local insights with global perspective.
Importance of Financial Market Coverage
1. Promotes Transparency
Timely coverage ensures that market participants have access to relevant information, reducing information asymmetry.
2. Enhances Market Efficiency
Markets respond more accurately when participants are informed, contributing to better price discovery.
3. Guides Investment Decisions
Coverage helps investors identify opportunities, manage risk, and adjust strategies in volatile conditions.
4. Supports Policymaking
Regulators and central banks monitor market coverage to gauge sentiment, liquidity conditions, and systemic risks.
5. Educates the Public
Effective reporting demystifies markets for retail investors, empowering financial literacy and participation.
Challenges in Financial Market Coverage
Despite its critical role, coverage faces several challenges:
1. Information Overload
The sheer volume of financial news can overwhelm investors, making it difficult to distinguish signal from noise.
2. Speed vs. Accuracy
In the digital age, the pressure to report first can compromise accuracy.
3. Bias and Conflicts of Interest
Analyst recommendations and media reporting may be influenced by corporate sponsorships or personal interests.
4. Complexity of Modern Markets
Derivatives, algorithmic trading, and decentralized finance (DeFi) make coverage increasingly technical and challenging.
5. Global Interconnectedness
Events in one country can trigger cascading effects worldwide, demanding comprehensive, real-time coverage.
Conclusion
Financial market coverage is far more than a reporting mechanism; it is a critical pillar of modern financial systems. It informs, guides, and protects the interests of investors, institutions, and regulators. In an era of rapid information flow, complex instruments, and interconnected economies, high-quality coverage ensures that markets remain transparent, efficient, and fair.
As technology evolves and markets become more sophisticated, the role of coverage will expand further, blending real-time data, advanced analytics, and global insights. For any market participant, understanding financial market coverage is no longer optional—it is an essential part of navigating the intricate world of finance.

THE BREAK OF NMR .. $30 - AI runingNMR has a high chance of breaking in the coming time
we will follow the trend step by step for confirmations.

“XAUUSD – Strong Sell Setup from All-Time High Resistance “XAUUSD – Strong Sell Setup from All-Time High Resistance 🚨📉”
Currently, gold has reached a strong resistance zone around 3575 – 3600, where price is showing signs of exhaustion after a strong bullish rally. This area is a key supply zone and could trigger profit-taking or fresh short entries.
From here, I am expecting a potential correction move.
1st Target: Around 3480 – 3450, where we can see a clear demand zone and previous consolidation.
If bearish pressure continues, the price may extend towards the final target at 3330 – 3320, which is also a key support point aligned with previous market structure.
Market structure shows a clear higher low formation earlier, which fueled this rally, but after tapping into resistance, a short-term pullback seems highly likely.
📌 Overall, short-term bias = bearish correction, while long-term trend remains bullish unless price breaks below the 3320 support zone.

EURUSD Technical Analysis (Educational Breakdown) EURUSD Technical Analysis (Educational Breakdown)
1. Market Structure Overview
The chart shows a clear downtrend phase that started after failing to break the major resistance around 1.1780 – 1.1820.
Price formed lower highs and eventually broke below a rising trendline, signaling a shift from bullish momentum to bearish control.
Recent movement shows a retracement toward a defined entry zone, suggesting a short-term pullback opportunity.
2. Key Levels
Resistance Zone (1.1780 – 1.1820): This area has acted as a strong supply zone in the past, rejecting bullish attempts and triggering heavy sell-offs.
Support Zone (1.1340 – 1.1380): A key demand area where previous reversals took place.
Current Entry Zone: Between 1.1697 – 1.1750, aligning with a minor resistance zone and previous supply reaction.
3. Price Action Insights
Fair Value Gap (FVG) identified earlier near 1.1700 served as a reaction zone before a push downward.
The price is now revisiting an area near the previous imbalance, which aligns with a confluence of resistance and short-term overbought conditions.
If price action rejects the entry zone, a bearish swing toward 1.1534 is likely.
4. Trade Setup Idea (Short Bias)
Entry: 1.1697 – 1.1750 (retest of broken structure).
Stop Loss: Above 1.1772 to avoid stop hunts beyond resistance.
Target: First take profit at 1.1534; extended target toward 1.1400 if bearish momentum persists.
5. Risk Management & Educational Note
This setup is based on supply & demand principles plus market structure shifts.
Always confirm entries with lower-timeframe rejection patterns before executing.
Protect capital with a maximum of 1–2% risk per trade and adjust lot sizes accordingly.
📌 Summary:
EURUSD is currently testing a high-probability short zone after a structural breakdown. If rejection occurs, sellers could push price toward mid-range support at 1.1534, and potentially deeper toward the 1.1400 zone. However, if bulls manage to reclaim and close above 1.1780, this bearish view becomes invalid.

"Gold’s Next Big Move? The Hidden Entry Zone Smart Money "Gold’s Next Big Move? The Hidden Entry Zone Smart Money is Watching!"
Gold (XAUUSD) is currently consolidating after a series of higher lows, signaling sustained bullish momentum from the strong support region around $3,280–$3,300. Price has respected key structural points, forming a clean market structure with:
BOS (Break of Structure) confirming bullish intent after reclaiming prior resistance.
Bullish FVG (Fair Value Gap) acting as a liquidity zone for potential re-entries.
Multiple Higher Lows, highlighting strong buyer defense levels.
The chart indicates a possible short-term retracement into the $3,350–$3,357 entry zone, which aligns with demand structure. From this zone, buyers are expected to push toward the $3,400–$3,415 resistance target.
Key technical levels:
Entry Zone: $3,350–$3,357 (demand area)
Stop Loss: Below $3,340 to protect against deeper pullbacks
Take Profit: $3,400 psychological level and $3,414 structural resistance
Market Sentiment:
The combination of a strong support base, sustained higher lows, and bullish imbalance zones suggests a favorable risk–reward setup for long positions. A clean breakout above $3,415 could trigger a larger bullish leg toward the $3,440 resistance zone.
📈 Bias: Bullish above $3,350
💡 Watch for a reaction at the entry zone before committing to positions.

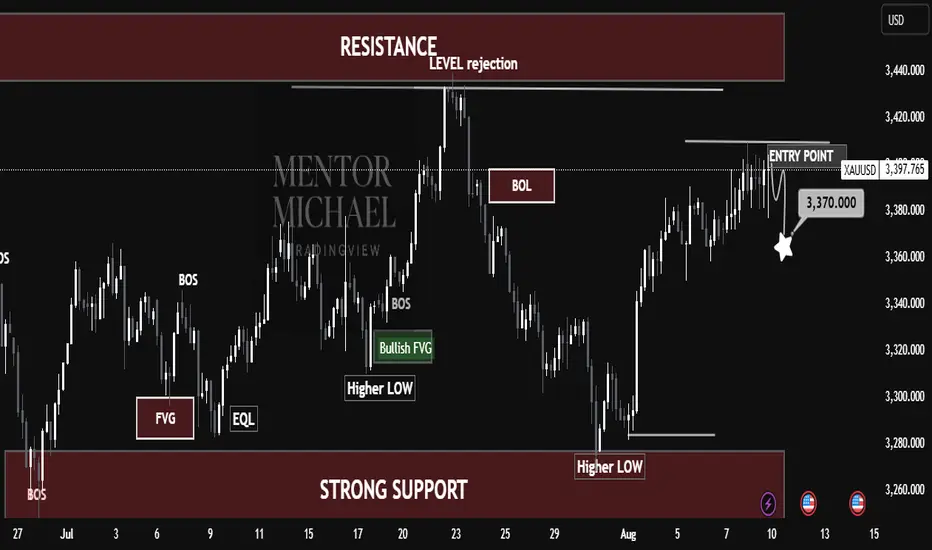
Gold on the Verge of a Big Move – Key Level in Focus!Gold on the Verge of a Big Move – Key Level in Focus!
Market Structure:
BOS (Break of Structure) signals have confirmed bullish momentum in prior swings.
Price created a Bullish FVG (Fair Value Gap) around mid-July, which provided demand for the next upward leg.
Consecutive Higher Lows indicate that buyers remain in control.
Key Levels:
Strong Support: $3,260 – A major demand area where buyers have stepped in multiple times.
Resistance Zone: $3,420–$3,440 – This is a significant supply area where price faced rejection earlier.
BOL (Breakout Level) around $3,390 – Price recently tested and is attempting to break above.
Trade Setup Highlighted:
Entry Point: $3,397 (short bias suggested by chart structure at resistance)
Potential Target: $3,370 – aligns with minor liquidity grab and possible retest of broken structure.
Market Logic:
Price is currently testing a resistance level rejection zone.
The expectation in this setup is a short-term pullback to collect liquidity before a possible continuation.
If $3,370 holds, bulls may resume toward the higher resistance zone at $3,420+.
Educational Takeaway:
BOS indicates a shift in control (bearish BOS = sellers taking over; bullish BOS = buyers taking over).
FVG is a gap in price that often acts as a magnet for retracement.
Higher Lows are key signs of a bullish trend.
Support & Resistance act as decision zones where traders can anticipate reversals or breakouts.
📌 Summary:
XAUUSD is in a bullish structure but is currently testing a resistance rejection zone. A short-term retracement to $3,370 is probable before any continuation higher. Swing traders should watch price behavior at support for a potential long continuation setup.
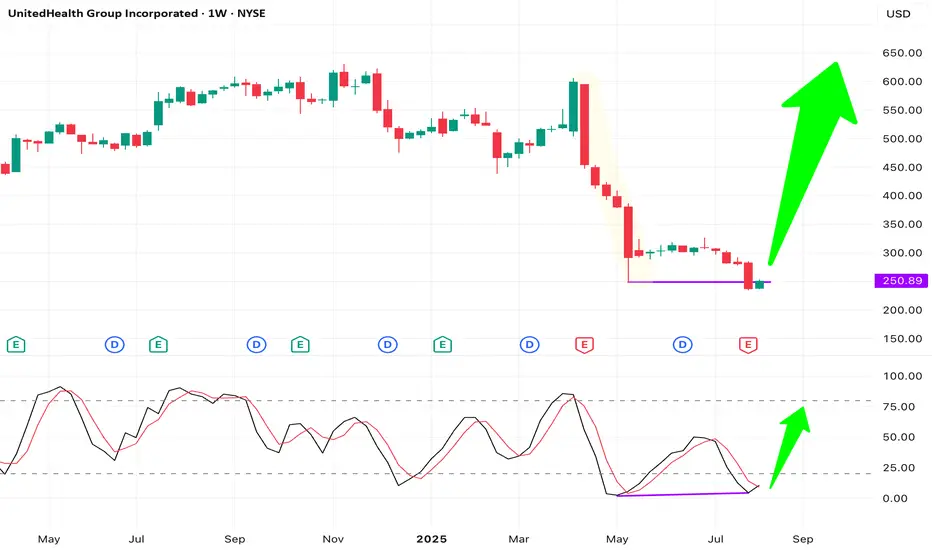
UNH – Force Bottom with Bullish Divergence at Support(Weekly Chart) NYSE: UNH remains a fundamentally strong company, even though healthcare is not currently the market’s leading sector. On the weekly chart, price action shows a force bottom (double bottom with take-out stops pattern), flushing stop-losses below the previous low at $248.88.
Last week, price closed back above the $250 support with a bullish candle. Price action and stochastic show a bullish divergence, with stochastic oversold and starting a golden cross. Risk-reward looks very favorable from this level.
ETH/USD Analysis – Smart Money Breakdown ETH/USD Analysis – Smart Money Breakdown & Rejection from Premium Zone
🔍 Key Breakdown:
✅ BOS (Break of Structure): The initial BOS on July 15 signaled a strong bullish shift in market structure, triggering a sustained upside rally.
💪 Strong Bullish Rebound: After the BOS, ETH experienced impulsive buying, confirming institutional order flow and liquidity injection.
🔺 Resistance Zone (Premium Area): The price formed a clear TOP at the resistance (near $3,950–$4,000), a common zone where smart money distributes positions.
📉 Reaction from Resistance: As ETH tapped into the resistance, price sharply rejected — a potential mitigation move or distribution phase.
⚠️ Current Price Structure: After the correction, ETH is retracing back into the resistance zone. The projected arrow indicates a possible lower high formation, followed by a continuation to the support zone ($3,300–$3,400).
🧠 Educational Takeaways:
Structure Is King: Market structure (HHs, HLs, BOS) is the foundation of SMC-based trading.
Premium vs. Discount Zones: Smart money sells in premium (resistance) and buys in discount (support).
Liquidity Reversal: Tops often trap late buyers before a reversal — watch for liquidity grabs at key zones.
Wait for Confirmation: Always wait for confirmation (candlestick or structure shift) before entering trades.
🎯 Potential Scenarios:
✅ Bearish Case: ETH forms a lower high and drops to support (~$3,350).
❌ Invalidation: Clean breakout and hold above $4,000 could open doors for further bullish continuation.

Gold 15-Min Breakout: Eyes on M30 Supply Zone & FVG RetestPrice is currently approaching a key M30 Supply Zone after a strong bullish impulse from the ascending trendline support.
🔹 Key Observations:
The price broke above a previous short-term resistance zone and is now retesting the Fair Value Gap (FVG) area marked in pink.
The 200 EMA acted as dynamic support, further fueling bullish momentum.
Structure shows a series of higher lows, confirming buyers in control on intraday timeframes.
🔹 Potential Scenarios:
✅ Bullish Continuation:
If the price respects the FVG as demand and forms bullish confirmation, continuation toward the M30 Supply Zone and the 3,399–3,400 region is likely.
⚠️ Pullback Risk:
A deeper retracement below FVG could retest the trendline or the 3,371 support near the 200 EMA before any further upside.
🔹 Trade Plan:
Watching for price action reaction inside the FVG. A clean rejection could offer entries targeting the upper supply zone.

U.S. Dollar Index (DXY) !!U.S. Dollar Index (DXY)
Long-Term Channel Support Held
The chart shows DXY moving within a rising parallel channel since around 2008.
Recent price action bounced right from the lower trendline (~98 zone), indicating strong structural support.
Bearish Pressure
DXY dropped below 100, currently around 98.72, down 1.32% this month.
Trading below the 200-month EMA, which suggests weakening long-term strength.
Bearish candlesticks forming near the lower channel indicate an increased risk of a breakdown if support fails.
Ichimoku Cloud Signal
Price below the Kumo (cloud) = bearish territory.
Cloud turning thin ahead — signaling potential indecision or transition.
What This Means for Markets
If the DXY breaks below this channel, it could trigger a broader USD sell-off, potentially bullish for cryptocurrencies, gold, and emerging markets.
If support holds, expect a rebound toward the 104–106 zone, especially if macro sentiment favors the dollar.
Stay updated and manage your risk accordingly.
DYOR | NFA

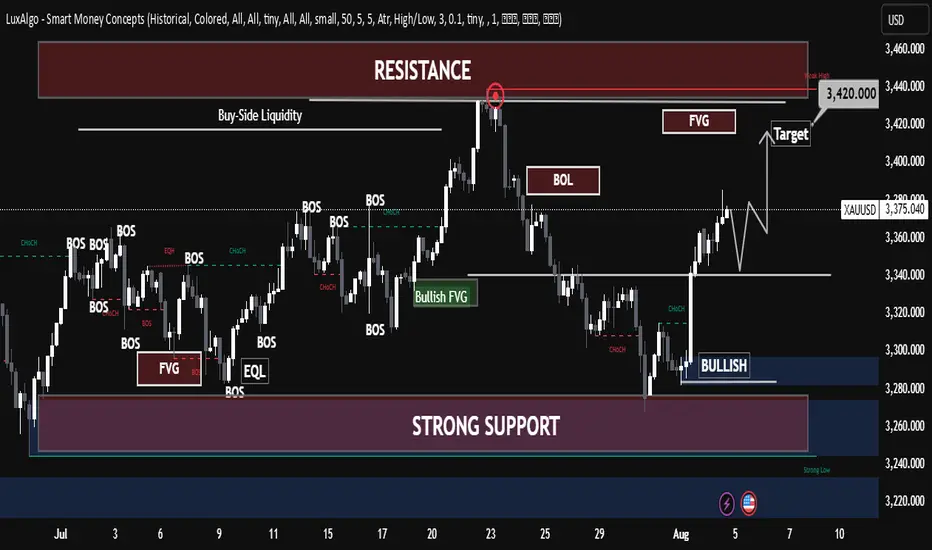
"Gold on Fire! Smart Money Bulls Aiming for Final Target🟡 "Gold on Fire! Smart Money Bulls Aiming for Final Target
Overview:
The XAUUSD chart presents a clear smart money structure, showing a bullish recovery from a strong demand zone and a current move toward a significant supply (resistance) area.
🔍 Key Technical Highlights:
Strong Support Zone
The price reacted powerfully from the well-marked strong support zone (~3,260), aligned with a previous Bullish Fair Value Gap (FVG) and BOS (Break of Structure), confirming bullish intent.
Bullish Market Structure
A clean CHoCH (Change of Character) confirmed the end of the previous bearish leg.
Multiple BOS followed, solidifying the bullish shift in momentum.
Liquidity Grab & Price Expansion
Price swept equal lows (EQL) and mitigated bullish FVG, collecting sell-side liquidity before reversing.
The breakout pushed toward the current level of ~3,380, targeting the Buy-Side Liquidity zone and resistance.
Resistance & Fair Value Gap
The final target is aligned at 3,427.83, situated inside a high-probability bearish FVG and resistance zone.
This area previously rejected price (noted with the red circle), making it a critical supply zone.
Partial Target Hit
Price has already achieved half of the projected move, indicating bullish strength and proper SMC execution.
The current consolidation near the mid-level suggests accumulation or re-accumulation before a final push toward the target.
📈 Educational Notes:
Fair Value Gaps (FVG) highlight inefficiencies in price delivery. These zones often act as magnets for price and reversal points, as seen here.
Break of Structure (BOS) and Change of Character (CHoCH) are crucial for identifying trend shifts. This chart reflects a textbook bullish transition.
Liquidity concepts (EQL, Buy-Side) emphasize institutional behavior. Price often hunts liquidity before moving to new highs or lows.
✅ Conclusion:
XAUUSD is playing out a well-structured bullish smart money setup, with price currently in mid-path toward the final target. Traders should monitor reactions at the 3,427 resistance zone, which will be critical for potential reversal or continuation scenarios.

Technical Breakdown (Smart Money Concepts-Based)📊 Technical Breakdown (Smart Money Concepts-Based):
🔹 Market Structure:
Multiple Break of Structure (BOS) signals show a bullish shift in momentum, especially after the recent CHoCH followed by BOS at the current price zone.
Strong bullish confirmation after reclaiming previous liquidity zones, indicating institutional interest.
🔹 Liquidity and Zones:
Buy-Side Liquidity above $3,420 is likely the short-term institutional target.
Price has clearly reacted from a strong support block near the $3,260–$3,280 area, confirming demand and institutional accumulation.
The highlighted Bullish FVG (Fair Value Gap) aligns with a mid-level retracement zone—ideal for potential pullbacks before continuation.
🔹 Key Supply & Demand:
Resistance Zone (3,420–3,450): Contains weak highs and unmitigated FVG—prime liquidity zone for a sweep.
Strong Demand Zone: Around $3,260 has shown repeated reaction; the base of bullish moves.
Imbalance Fill & Rejection Expected in FVG near $3,420.
🔮 Projection & Scenario:
Expected pullback toward $3,340–$3,350, followed by bullish continuation.
Targeting liquidity sweep at $3,420, aligned with Smart Money accumulation and distribution logic.
Monitor for reaction at $3,420 for either a rejection or a clean breakout, confirming further upside.
✅ Conclusion:
This setup suggests institutional buy-side pressure with targets on resting liquidity around $3,420. Smart Money is likely driving price toward that level to grab orders before the next big move.
DOGEUSDT Technical Analysis – Bullish Reversal Anticipated DOGEUSDT Technical Analysis – Bullish Reversal Anticipated
🔍 Key Technical Zones:
Support Zone: $0.1990 – $0.2015
Strong bullish reactions noted from this level in previous attempts.
Confluence with volume accumulation on the left (as seen in the Volume Profile).
Signifies a strong demand zone where buyers are stepping in.
Resistance Zone / Target: $0.2220 – $0.2240
Previous structural high and supply zone.
Marked as the first major liquidity area.
Also aligns with imbalance and CHoCH (Change of Character), a common SMC concept.
🔄 Market Structure:
CHoCH (Change of Character) marked multiple times, indicating attempts by bulls to reclaim structure.
Recent price action shows accumulation near support.
Sideways consolidation suggests potential for a bullish breakout.
Liquidity sweep of recent lows could indicate that smart money is accumulating positions before a move higher.
🎯 Trade Setup Idea:
Entry Area: Between $0.2000 – $0.2060 (inside the support zone)
Target: $0.22396 (as marked)
Stop Loss: Below $0.1980 (below the visible support range)
🔧 Indicators and Tools Used:
Volume Profile (VRVP): Shows most volume traded around $0.205 – $0.207, indicating strong positioning from market participants.
Smart Money Concepts (SMC): CHoCH and liquidity concepts signal potential accumulation and reversal.
Price Action Analysis: Clean swing structure with support-resistance rotation visible.
📌 Conclusion:
DOGEUSDT is currently trading in a range-bound structure with a bullish bias from the support zone. If the price sustains above $0.205 and breaks above minor resistance, the upside target of $0.22396 is likely. This setup is supported by strong volume accumulation and smart money structure shifts.

LINK - The sleeping Giant ready to wake!Don't forget to add LINK to your watchlist — it's a solid project with long-term investment potential.
The weekly chart shows that LINK is currently retesting the downtrend line it recently broke — a textbook bullish retest.
The lower trendline now acts as a key support level, and as long as price holds above it, the structure remains healthy.
Currently trading around $17.6, the price hasn’t moved significantly yet —
You’ve got:
✅ A strong fundamental project
✅ A bullish technical setup
✅ Large market cap
✅ Still early entry
What more do you need to enter?
Accumulate now... and thank me later.
Best Regards:
Ceciliones🎯

EUR/USD Technical Analysis📈 EUR/USD Technical Analysis
🔍 1. Market Structure
⚙ Trend Context
• The overall trend since mid-July has been bullish, with higher highs and higher lows forming after a bounce from a key demand zone (around 1.15380).
• However, recent candles show indecision and a potential reversal, suggesting weakening momentum.
⸻
🧱 2. Volume Profile Insight (VRVP)
• High Volume Nodes (HVNs):
• Significant trading activity occurred between 1.172–1.176, now acting as resistance.
• Low Volume Gaps:
• Thin liquidity zones exist between 1.165–1.158, which could result in swift price movement if selling pressure increases.
📘 Educational Insight: Thin volume areas on a profile typically allow for faster price transitions due to lack of order density.
⸻
📊 3. Envelope Indicator – Nadaraya-Watson (8,3)
• A mean-reversion tool estimating dynamic overbought and oversold areas.
• Price recently rejected the upper boundary, reinforcing the bearish outlook.
• The lower envelope, around 1.158–1.160, aligns with the projected bearish target.
⸻
🟫 4. Demand Zone Analysis
• Labeled “DEMAND ZONE” at 1.15380–1.15830
• Previously caused a strong bullish reversal, marking it as an area of institutional interest.
• A re-test of this zone may attract buyers once again, presenting a key support area.
📘 Educational Insight: Demand zones reflect

XAUUSD Price Analysis — Support Zone Reaction & Potential XAUUSD Price Analysis — Support Zone Reaction & Potential Bullish Reversal
🔍 Market Structure Overview
The chart shows a clear bullish market structure characterized by multiple Breaks of Structure (BOS) and a strong upward trend that recently corrected into a key support zone around 3360–3340.
This correction phase may be coming to an end as price reaches a high-probability demand area, with bullish reaction forming at the support level.
🧠 Smart Money Concept (SMC) Breakdown
📌 Break of Structure (BOS) confirms institutional activity and directional bias.
🔄 After a strong uptrend and BOS on July 22–23, a healthy retracement has taken place toward a major demand zone.
The support level is aligning with past consolidation and previous BOS zones, providing confluence for a bullish bounce.
📊 Technical Confluence
✅ Volume Profile (VRVP) shows strong buyer activity at current levels.
✅ The price is reacting within the support box with a small bullish candle, indicating potential accumulation.
✅ A clean liquidity sweep may have occurred just below minor lows, shaking out weak hands before a move upward.
🎯 Forecast
If price holds above the 3360 level, and bullish confirmation continues (e.g., break above minor lower highs), we can expect:
Short-term target: 3400
Major target: 3440 (marked resistance zone)
⚠️ Invalidation: A clean break and close below 3340 may lead to deeper correction or change in structure.
📘 Educational Title Suggestion
"Smart Money Reaction at Demand: XAUUSD Poised for Reversal from Key Support"

XAUUSD Technical Analysis – Resistance Turned Support, 📈 XAUUSD Technical Analysis – Resistance Turned Support, Bullish Continuation Expected
Gold (XAUUSD) has shown strong bullish momentum after breaking above the key resistance zone around $3,400, which now appears to be acting as a new support level. This structure shift signals a classic break-and-retest scenario, commonly observed in bullish continuations.
🔍 Key Observations:
Structure Shift: Previous resistance near $3,400 has been broken with strong bullish candles, suggesting buyer dominance. This level is now expected to serve as support.
Bullish Momentum: The move from the $3,320 support zone to above $3,430 was accompanied by clear trend formation and clean market structure, indicating sustained momentum.
Retest in Progress: Price is currently pulling back toward the new support zone ($3,400). If this area holds, a bullish reaction is expected.
Next Target: If support at $3,400 holds as expected, price could rally back toward the next resistance and projected target of $3,460.
📚 Educational Insight:
This setup illustrates the principle of resistance becoming support (RBS)—a foundational concept in technical analysis. After a breakout, a successful retest of former resistance often provides a high-probability entry point for trend continuation trades.

"BTC/USD Breakout Strategy: Identifying Bullish Momentum BTC/USD Technical Analysis – July 22, 2025
📈 Market Structure Overview:
The chart illustrates a recent Break of Structure (BOS) both to the upside and downside, indicating volatility and a shift in market sentiment. The price action formed a descending channel, followed by a breakout with strong bullish candles, suggesting a momentum reversal.
🧱 Support Zone (Demand Area):
Key Level: $116,400 – $116,900
This zone has acted as a strong demand level, with clear evidence of buying pressure pushing BTC higher after testing this area. The volume profile (VRVP) supports this, showing heightened trading activity at this price.
🔄 Bullish Breakout Confirmation:
A bullish breakout from the descending channel occurred just above the support zone, aligning with the label "Bullish Momentum".
The breakout candle has closed above minor resistance, which increases the probability of a trend reversal.
📍 Price Target:
The projection points toward $120,000, aligning with previous resistance and psychological round-number resistance.
This target is highlighted by an expected bullish leg after a possible retest of the breakout zone around $117,500 – $117,800.
🧭 Key Levels to Watch:
Support: $116,400 – $116,900
Retest Zone (Buy Opportunity): $117,500 – $117,800
Immediate Resistance: $118,400
Major Resistance / Target: $120,000
📊 Summary:
BTC/USD has shown a bullish reversal signal from a well-respected support zone after a descending correction phase. The current price structure, volume buildup, and breakout momentum suggest a high probability of continued upside movement toward the $120,000 mark. A successful retest of the breakout zone would provide a strategic entry for long positions with tight risk management.
