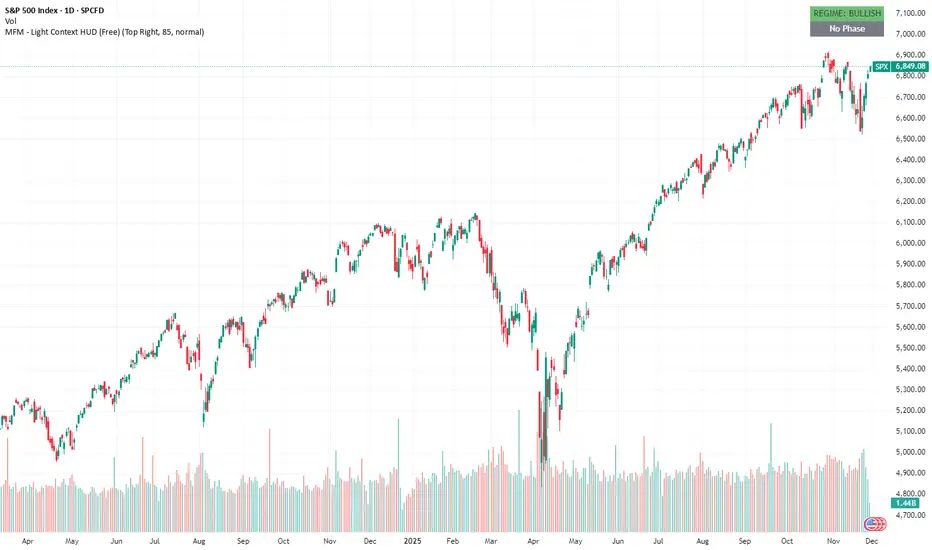
SPX – MFM Light HUD (Free) shows a clean bullish regimeThis post is an educational example of how to interpret the free MFM Light Context HUD. It does not provide trading signals or directional predictions.
The MFM – Light Context HUD (Minimal) gives a simple view of the structural state of the market. On SPX the model shows a clear bullish regime on the weekly momentum ratio. This does not predict direction. It only shows whether the underlying environment is supportive or restrictive.
The phase is currently neutral. That means SPX is not in a volatile phase, not in a compression field, and not in a drift phase. When no phase is active, price tends to behave without strong internal pressure. It is simply the absence of structural imbalance.
What the phases mean
These phases describe structure, not trade signals.
Volatile (Phase 1): fast movement and unstable conditions.
Compression (Phase 2): contracting conditions with slowing momentum.
Drift (Phase 3): more controlled and persistent movement.
Neutral: no clear structural condition.
This is why the HUD is useful. It removes noise and gives a clean top level reading.
You can still use your own strategy or analysis. The HUD just tells you what kind of environment you are operating in.
What you see in this chart
Weekly regime is bullish
No active phase
No signals or forecasts
Only structural context
Why this matters
In strong bullish regimes markets often react differently to pullbacks, volatility spikes or news events. Context does not replace analysis. It frames it.
Disclaimer
The Market Framework Model (MFM) and this indicator are for educational and informational purposes only. Nothing in this script, its visuals, or any documentation should be interpreted as financial advice or as a recommendation to buy or sell any asset.
All examples and historical references are illustrative only and do not imply future results. Trading and investing involve risk, including the potential loss of capital. Users remain fully responsible for their own decisions.
No guarantees are made regarding accuracy, completeness, or reliability. MFM describes structural market context only and should not be used as the sole basis for trading actions.
© 2025 Inratios. Market Framework Model (MFM) is protected via i-Depot (BOIP) – Ref. 155670.
Marketstrcuture
Gbp/Usd Must watch 250 Pips sell!!Based on last week's analysis we talk about GBP/USD
We expect similar move to occur. watch the video to understand my perspective
Thank you! Please follow for more breakdowns!

GBP/JPY Sell setup potential 215 pipsBased on higher timeframe pound yen is forming a downward structure and we can see on H1 And H4 breaking structure to downside , We need to see a clear price retracement to POC level and nice reversal candlestick for confirmation for a downward continuation . look fro nice entry to downside.
Please follow me for more update and comment below
