Gold Pullback Toward Demand ZoneGold price is trading above the trend line, showing bullish momentum. A short-term pullback is expected toward the 4205 target area, which aligns with the nearby demand zone and support level.
Marketstructure

USD/JPY Bearish Breakdown SetupUSD/JPY shows a potential bearish move after rejection from the resistance zone and break of the trend line. Price is expected to retest the support zone before continuing down toward the target level at 1.154.00

Gold Pullback Expected After Hitting Trend Line ResistanceGold price is testing the upper trend line resistance after a strong bullish rally. A potential pullback toward the 4157 target zone is expected before the next move. Key support levels remain below 4100.

Bitcoin Rebound from Support Toward Key Resistance TargetsBitcoin is showing a potential rebound from the support zone near $103,200. Price may target the $104,800 (Target 1) and $105,400 (Target 2) resistance levels if bullish momentum continues. The Fair Value Gap (FVG) suggests possible upward movement after recent correction.

Gold Price Rebound Setup from Support ZoneGold price is consolidating above the support zone near 4,100 after a pullback from the resistance level around 4,140. A potential bullish rebound could target 4,120 first, with an extended move toward 4,135 if momentum strengthens.

ZECUSDT - Testing Support For Potential Relief BouncePrice is reacting to a strong demand zone after forming an M-top pattern on the higher timeframe. Watching for a short-term relief move toward the 0.5–0.618 retracement levels (around 470–490) before deciding whether this becomes a full reversal or just a retest.
If the 450 level holds, continuation to 520–540 is possible. If 450 breaks cleanly, I’ll look for a deeper long setup near 399–371.
Stop loss for the short-term long is below 450.

Title: Gold Faces Rejection at Resistance ZoneGold price faces resistance near the 4,140 level after a strong bullish move. The chart shows price rejecting from the trendline and resistance zone, signaling a possible pullback toward the 4,105 target area, with key support around 4,047.
Title: Gold Rejection at Resistance — Possible Pullback Toward 4105

EUR/USD Bearish Rejection from TrendlineEUR/USD shows rejection from the descending trendline near resistance, signaling potential bearish momentum. Price is expected to drop toward the 1.15300 support and FVG zone for possible reversal or continuation.

When the Data Says EUR/USD Is 89.5% Likely to Go Higher…Most traders stare at price.
We measure the behavior driving it.
What happens when you data-mine market structure itself?
You stop guessing — and start seeing probabilities behind every move.
Structure Lab’s data shows an 89.5% probability that EUR/USD reaches the 50% retracement (EQ) of the prior internal leg — sitting above current price.
Here’s what the data says:
– Swing structure remains bullish (last BOS to the upside)
– Internal structure turned bearish to form the pullback, bottoming Nov 5 in a Phase C configuration (Counter Swing + Pro Internal)
– Now in Phase B (Pro Swing + Counter Internal), pushing higher
Monday printed an inside day — full range inside Friday’s high-low.
Price is drifting lower, stacking buy-side liquidity with descending highs — the kind of structure that often fuels the next impulse.
Three high-probability statistical levels rest above:
1.21%
1.65%
1.78%
(measured from the recent internal low)
Here’s the kicker — 80% of Phase B legs take 5–9 days to complete.
We’re only 2 days in.
The math leans higher.
📊 1-hour timeframe — price as behavior, not noise.
More high-probability setups dropping every week—follow for statistical edges you won't find anywhere else.
Want the full breakdown? Entry trigger, invalidation, and scaling strategy? Drop a "📊" in the comments and I'll share the complete game plan.
Let me know what you want to see more of. 👇

BTCUSD UPDATE Yesterday, BTCUSD hovered near 106,463, staying quiet most of the day.
This morning, the Euro session broke that balance — ran yesterday’s high, triggered stops, and dropped fast. ETF inflows that pushed price earlier in the week slowed down.
Funding turned negative, showing traders are less confident short term.
Now price trades lower, and yesterday’s low is the next level everyone’s watching.
Macro Outlook
Markets are leaning defensive.
Yields up. Dollar steady. Stocks soft.
Bitcoin’s moving with that tone as flows cool off and liquidity thins out.
Until that changes, BTCUSD stays under pressure with weak momentum and cautious buyers.
Market Structure Mapping (MSM — The Framework)
Structure still leans bearish, but there’s no confirmed break yet.
Price is trading away from the last discount pullback, holding below the Euro session high.
Downside focus sits near 104,240, then 101,500, where equal lows and liquidity line up.
If yesterday’s low breaks clean, the bearish leg extends.
For now, price is drifting lower — not broken, just soft.
CORE5 Rule — “Trade what’s confirmed, not what you think.”
— CORE5DAN
Institutional Logic. Modern Technology. Real Freedom.

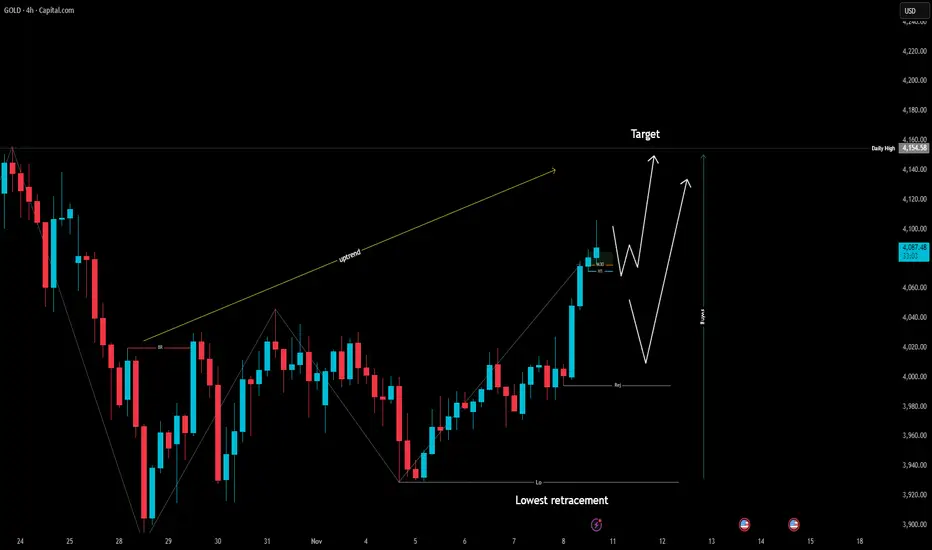
GOLD UPTRENDING GOLD ANALYSIS TODAY
Gold remains in an uptrend within the H4 timeframe after breaking the previous high at 4046.
If bullish momentum continues, the next target is the daily high around 4154.
Focus on buying opportunities as long as the market maintains its uptrend structure.
If the price pulls back, expect a retest of the M30 structure near 4030 — and if that level breaks, price may continue to drop toward the H4 rejection zone around 4000.
For selling opportunities, wait for a confirmed break below the M30 low to validate a potential reversal setup.
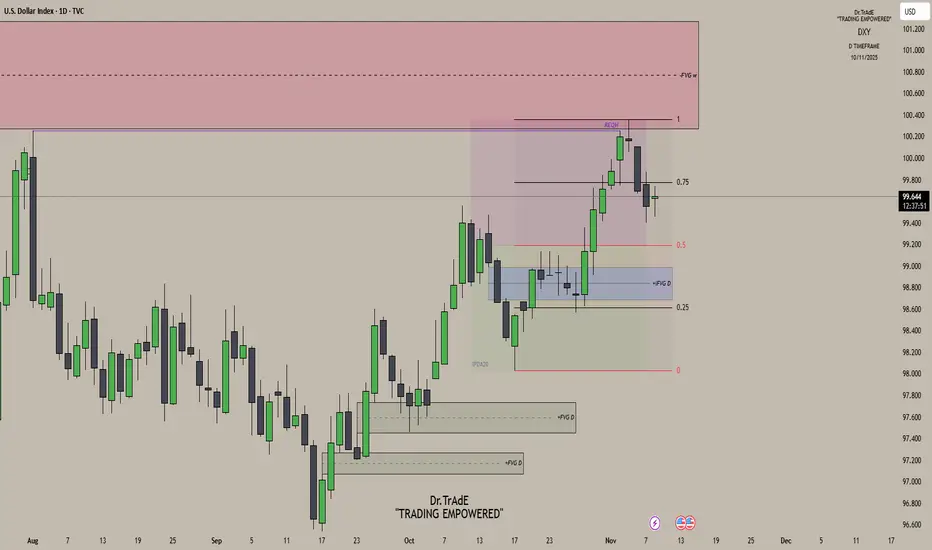
DXY Daily AnalysisLast Week’s Review:
Monday: Bullish delivery as price continued higher.
Tuesday: Price maintained bullish momentum but failed to take out the previous high, leaving equal highs — liquidity resting above.
Wednesday: That liquidity was swept as price reached into the weekly fair value gap, completing delivery to the premium array and initiating bearish distribution.
Current Outlook:
On the daily chart, we’re still trading deep inside premium, and price is showing clear signs of exhaustion after that delivery into the weekly FVG. With bearish distribution now in play, my bias remains bearish. Any short-term push back into the 0.75 quadrant, I’ll treat as a retracement — a chance for price to reprice some lower-timeframe inefficiencies before the next leg lower. On the 4H chart, I’ll be watching for price to trade back into short-term FVGs or inefficiencies that align with this overall bearish narrative.
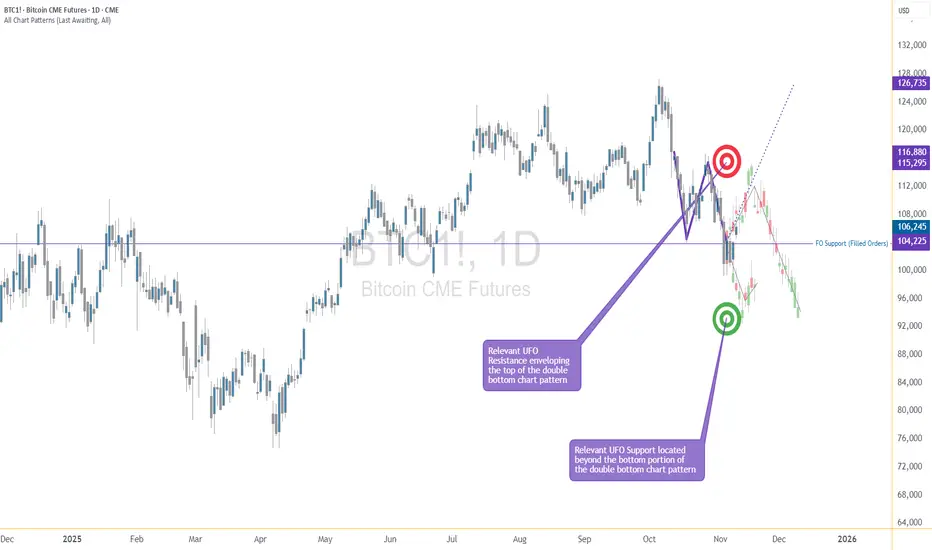
The Pattern That Looked Bullish… Until It Didn’t1. The “Too Good to Be True” Setup
You’ve seen it a hundred times — that shiny W-shaped pattern that screams reversal.
Traders spot it, celebrate it, and rush in before it even completes.
But not every double bottom deserves a standing ovation. Sometimes, what looks like a powerful comeback is actually the calm before another dip.
2. Meet the Real Players: FO vs. UFO
Behind every pattern hides a tug-of-war between two invisible forces:
FO (Filled Orders): Where buyers already did their job. The gas tank’s empty.
UFO (UnFilled Orders): Where fresh buyers are still waiting. That’s where the real fuel sits.
In our current setup, price bounced from an FO zone that already spent its energy.
The next UFO zone — the untouched demand — sits lower.
Translation? The market might need one more leg down to refuel before any real rally begins.
3. The Bear Hiding Inside the Bull
Chart shapes can lie.
Order flow doesn’t tend to.
When price sits on an FO support and the next UFO level is far below, odds tilt toward a break, not a bounce.
It’s like jumping on a trampoline that’s already been stretched too far — it might not spring you up again this time.
4. Rethink “Confirmation”
Pattern traders often buy the moment they spot symmetry. Smart traders wait for liquidity confirmation — the moment unfilled demand actually engages.
If that doesn’t happen, all you’ve got is a good-looking shape on a tired level.
5. The Real Lesson
Patterns attract attention.
Order flow reveals intent.
Patience separates analysis from impulse.
The next time a chart whispers “reversal,” ask yourself: Is it running on new energy or recycled hope?
Want More Depth?
If you’d like to go deeper into the building blocks of trading, check out our From Mystery to Mastery trilogy, three cornerstone articles that complement this one:
🔗 From Mystery to Mastery: Trading Essentials
🔗 From Mystery to Mastery: Futures Explained
🔗 From Mystery to Mastery: Options Explained
When charting futures, the data provided could be delayed. Traders working with the ticker symbols discussed in this idea may prefer to use CME Group real-time data plan on TradingView: www.tradingview.com - This consideration is particularly important for shorter-term traders, whereas it may be less critical for those focused on longer-term trading strategies.
General Disclaimer:
The trade ideas presented herein are solely for illustrative purposes forming a part of a case study intended to demonstrate key principles in risk management within the context of the specific market scenarios discussed. These ideas are not to be interpreted as investment recommendations or financial advice. They do not endorse or promote any specific trading strategies, financial products, or services. The information provided is based on data believed to be reliable; however, its accuracy or completeness cannot be guaranteed. Trading in financial markets involves risks, including the potential loss of principal. Each individual should conduct their own research and consult with professional financial advisors before making any investment decisions. The author or publisher of this content bears no responsibility for any actions taken based on the information provided or for any resultant financial or other losses.
Bitcoin - Deathcross is coming!Bitcoin has shown a strong move over the past week, reaching the predicted downside target.
The price action is currently hovering around key technical levels that influence market sentiment on both higher and lower timeframes.
Recap of Last Week
Last week, it was noted that BTC had made a liquidity sweep, inversed the bullish daily FVG, and formed a fake-out, all pointing toward further downside movement. The target was set just above $103,000, and this was convincingly reached, with a decline of roughly 7–10%. The prediction played out accurately, and the market clearly demonstrated that the bears remain in control.
Daily Timeframe
On the daily timeframe, it’s notable that the major low around $98,000 has not yet been taken out. At the same time, BTC is trading below a strong resistance zone just above the current price.
This area will be difficult to break and could create downward pressure, making a sweep of the $98,000 level more likely. However, if BTC manages to reclaim these resistance zones, sentiment could shift to a more bullish outlook, but for now, the bears are still in charge.
4h Timeframe
On the 4-hour timeframe, there’s a 4h FVG located just above the current price.
From a technical standpoint, this is a logical area for a potential rejection.
The expectation is that BTC will first move up toward this FVG before facing a rejection and then drop again toward the $98,000 zone.
Death Cross
A death cross may form within the next 1–2 weeks, occurring when the 50-day MA crosses below the 200-day MA. This is a well-known bearish signal, but historically, it often appears toward the end of a downtrend. In this cycle, we’ve already seen three death crosses, all of which either marked or came close to marking a bottom.
However, during 2017 and 2021, death crosses also appeared at the end of bull markets — followed by a sharp decline, and then a relief rally that pushed prices back above the death cross level. Therefore, it’s crucial to stay alert to whether this signals the end of the bull market or rather a final shakeout before a new rally.
Conclusion
BTC has reached the expected downside target and is currently trading below strong resistance. It’s likely that BTC will first test the 4h FVG and then move toward the $98,000 zone.
The upcoming death cross could add pressure, but historically, such signals often mark the end of a downward phase. The coming weeks will be crucial in determining whether this is a deeper correction or the start of a new bullish impulse.
-------------------------
Thanks for your support. If you enjoyed this analysis, make sure to follow me so you don't miss the next one. And if you found it helpful, feel free to drop a like 👍 and leave a comment 💬, I’d love to hear your thoughts!

Gold Price Breakout Above Trendline Targets 3980 Gold (XAU/USD) is showing bullish momentum, breaking above the trendline resistance around 4000. Price is currently near 4008, with potential pullback targets around 3980 and 3965 if retracement occurs. Trend remains positive above the rising trendline.

Continuation on #GBPUSD / Sell setup 📌 Market Insight: {#GBPUSD }
⚠️ Risk Assessment: {High}
🚀 Approach:
There is low chance to it goes directly to our entry point but ... lets have it in our watchlist
need LTF entry sign first.

XAU/USD Intraday Plan | Watching 3957–3918 for Buyer ReactionGold remains in consolidation after failing to break above the 4042 resistance yesterday. The rejection from the MA200, followed by a break below the 3989 support level.
Price is now trading around 3982, approaching the First Reaction Zone (3957–3918). If this zone fails to hold, further weakness could expose the Support Zone (3884–3851), followed by the HTF Support Zone (3820–3781) as deeper reaction levels.
To shift momentum back to the upside, buyers need to reclaim 3989 and 4042, with the MA200 continuing to act as a major dynamic resistance.
📌 Key levels to watch:
Resistance:
3989
4042
4090
4142
Support:
3957
3918
3884
3851
🔎 Fundamental Focus:
There are no major economic releases on the calendar today, but traders should remain cautious as political headlines and broader fundamental developments can still drive sharp moves in gold.

US DOLLAR — Structure Shift in Motion🧭 Context
The dollar continues to push higher while major crosses weaken. Risk sentiment remains defensive as traders lean toward safety going into the new week.
📈 Technical POV
We’re trading into the structural pivot at 99.804, not above it yet. The daily chart shows stretched momentum — near +2 deviation — but buyers still control the short-term rhythm. The broader weekly bias remains bearish, so this move likely forms a counter-rally within the larger range.
🌍 Macro View
Currency Index: DXY advancing toward 100.00, driven by steady demand for USD amid uncertain global data.
Central Bank: The Fed’s 25 bps cut came with a neutral tone, signaling a pause — enough to keep the dollar firm.
Yields: U.S. 10-year yields hover near 4%, maintaining the yield advantage over Europe and Japan.
Seasonality: Early November often favors USD flows as funds rebalance into year-end positioning.
📊 Volume / Order Flow
Liquidity behavior remains balanced near current levels. No clear exhaustion yet — market is simply rotating into the key 99.804 zone, waiting for confirmation before expansion.
🎯 Plan
If we close above 99.804, it could unlock a move toward the weekly discount-zone liquidity, potentially sparking strong reactions across major cross pairs. If rejected, expect short-term pullback before any renewed strength.
🧠 CORE5 Note
Professional traders don’t predict — they prepare. Let price prove conviction before you act.
Institutional Logic. Modern Technology. Real Freedom.
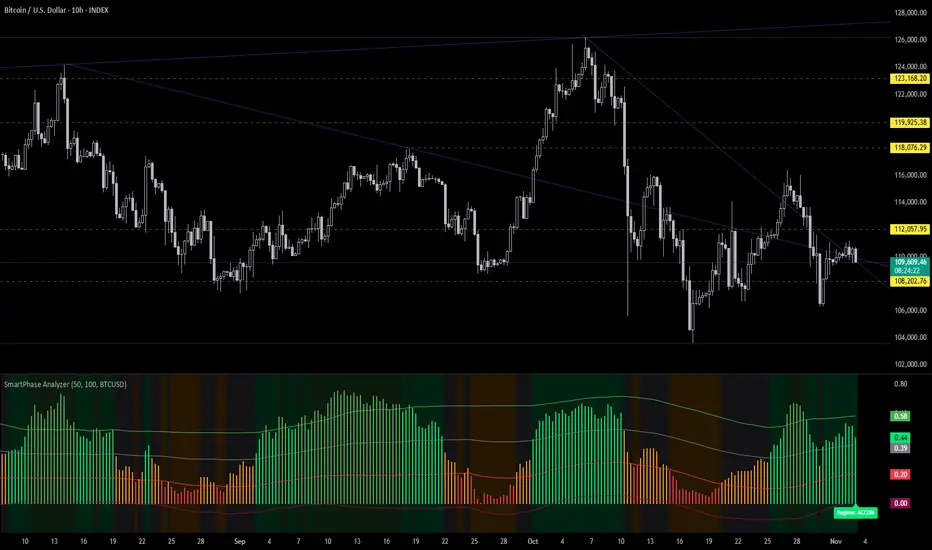
Temporal Drift Alpha | Rotating Volatility | Hidden Rhythm🧠 Deep Dive: Hidden Alpha in Odd Intraday Charts
Been experimenting lately with non-standard intraday timeframes on TradingView — specifically the 10-hour chart — and it’s producing some really interesting results.
My 1D strategies only needed minor calibration to fit intraday conditions (mainly risk and signal sensitivity tweaks), but once adjusted, they started performing significantly better on 10H than on standard 4H / 12H / 1D setups.
Here’s why I think it’s happening 👇
⚙️ 1. Uneven time alignment = session drift
10H doesn’t divide evenly into 24H, so candle start times rotate across the global trading cycle (Asia → London → NY).
That means each bar is pulling from a different combination of regional liquidity and volatility windows — you’re not seeing the same “slice” of the day over and over.
- 06:00 → overlaps Asia close + London open
- 16:00 → overlaps US open
- 20:00 → catches late NY + early Asia handoff
This rotation keeps repeating every couple of days, giving you asynchronous snapshots of how the market behaves between sessions — and that’s where inefficiencies tend to hide.
📊 2. Structural alpha exposure
By breaking away from the standard 8H / 12H / 1D alignment, you end up:
- Capturing transition volatility (session overlaps)
- Avoiding compressed daily smoothing
- Getting more responsive structure shifts for trend/momentum setups
It’s basically giving you a rotating volatility lens. You’re still seeing the full picture, but through different angles each cycle.
🧩 3. Strategy behavior differences
On the 10H:
- Momentum filters trigger cleaner — fewer false breaks
- Mean reversion signals reset faster after exhaustion
- BB, RSI, EMA-type systems react smoother, since the noise from hard session resets (like 00:00 UTC) is reduced
I’m seeing way fewer “dead zones” between signals — and overall smoother PnL curves, even with identical logic.
📈 4. Practical takeaway
Odd-hour timeframes like 10H act like a “rotating frame sampler” for the market.
They shift through liquidity regimes automatically — giving you a natural form of temporal diversification.
If your 1D systems are solid but a bit laggy or overly smoothed, try re-anchoring them on 10H, 14H, or 22H and recalibrating your risk and confirmation filters slightly.
There’s legit structural alpha buried in how these bars cut across the global cycle.
🧠 TL;DR
10H charts = not random noise.
They’re asynchronous time slices that expose unbalanced session transitions — something most backtests miss.
I’ll be running deeper tests on return bias and volatility clustering per candle start hour (06:00, 16:00, 20:00, etc.), but early signs point to repeatable behavior .
This could be one of those tiny structural edges that compounds over time.
Sometimes alpha isn’t in new indicators — it’s in how we slice time. ⏳⚡️
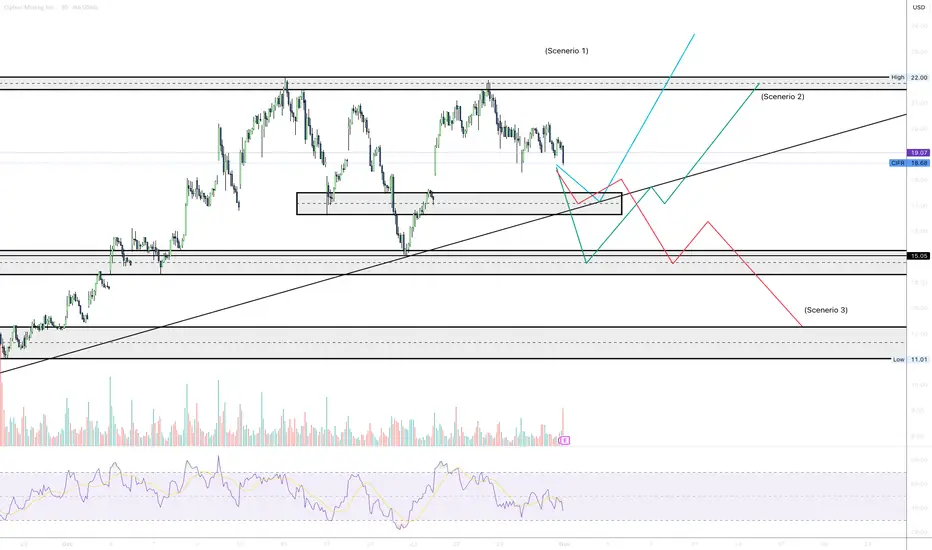
CIFR CHART ANALYSIS - WEEK OF NOVEMBER 3rd 2025 - 4HR TIMEFRAME4HR CHART ANALYSIS. Price continues to be bullish if price stays along the trend-line and stay above strong support (please refer to the chart).
A High Probability end for the Swing Pullback on EUR/USD Hey guys and gals!
Following up on our "A high probability market structure scenario on EUR/USD" you can see that statistical probabilities guided us through the break of the internal low.
So now what?
If you were short, what is a good target/exit?
Where is the Swing pullback likely to end?
We will let probabilities and data guide us.
-------------------------------------------------------------------------------
Of course, the Swing could always extend further, and if it does we have extended analysis for this.
But in any case, we will likely see at least a strong Internal Pullback from these levels where we can further assess.
-------------------------------------------------------------------------------
Thanks for your support. If you enjoyed this analysis, make sure to follow me so you don't miss the next one. And if you found it helpful, feel free to drop a like 👍 and leave a comment 💬, I’d love to hear your thoughts and am open to any questions or requests for analysis.
-------------------------------------------------------------------------------
💸💸💸💸💸💸
👇 👇 👇 👇 👇 👇

A high probability market structure scenario on EUR/USDBased on the Swing and Internal market structure I've identified some meaningful levels that:
1- play off the available liquidity above and below the last few days price action.
2- align with market structure principles and current demand zones (order block)
3- are easily measured based on the swing and internal structure.

Gold ( XAUUSD) UpdateGOLD (XAUUSD) Update 🟡
Price stayed bearish for most of the week as sellers kept control. I let the market play out after Tuesday’s drop since there was no clear daily signal from buyers.
On Thursday, we finally got a bullish engulfing daily close, showing early signs of momentum shift. The 4H structure is starting to turn bullish, and the 1H gave a clean entry during London after price failed to make new lower lows and began forming higher highs.
As long as price holds above the 4000 zone, I’ll stay patient and look for continuation towards 4100 and possibly the previous daily higher high.
