Measurable Data Token Flashes Bullish Signal — 7% Profit PotentiMDT performed nicely the last few days and is already up 3.5% today.
The token flashed a #bullish EMA crossover on the 4H chart. Usually, this crossover signals a continuation of the recently started trend.
Based on the resistance levels, MDT will likely tackle the next resistance at $0.056. This level results in a profit potential of 6-7%, depending on your entry.
If the bullish momentum continues, $0.06 is the next barrier to tear down.
A stop loss could be placed at 0.051
Happy trading!
--
Visit my profile for links and more free trade strategies!
MDT

#MDT/USDT#MDT
The price is moving within a descending channel pattern on the 4-hour frame, which is a retracement pattern
We have a bounce from a major support area in the color EUR at 0.04150
We have a tendency to stabilize above the Moving Average 100
We have a downtrend on the RSI indicator that supports the rise and gives greater momentum and the price is based on it
Entry price is 0.04750
The first target is 0.06000
The second target is 0.06745
The third goal is 0.07700

MDT near to breakout NYSE:MDT 🙌🏼
In the event of a successful breakout from this pattern, a bullish move of approximately 90% is expected 🚀

Measurable Data Token (MDT) — Bullish RSI Signal on the 1D ChartBased on the current oversold RSI, many coins should be ready to bounce and deliver a (small) relief rally.
In this context, MDT is a very interesting signal since the profit potential is quite high.
However, the token is rather volatile. Therefore, you have to be careful with your stop loss.
Based on backtests, the signal has shown extraordinary results. 92% of all historical RSI signals on the daily chart resulted in gains of more than>10% for MDT. Nevertheless, the chart shows that the profit potential could be even higher. In this context, our algorithms have calculated a profit potential of 45% based on the next major resistance.
However, given the current indecisive market, I would be cautious about the calculated profit potential of 45%.
A quick look at other indicators shows that all trend indicators signal a bearish trend. This isn't surprising and similar to many other altcoins. On the contrary, momentum indicators are either neutral or oversold.
Summarized: The oversold RSI and promising backtests provide an interesting entry. At the same time, the high volatility of the token bear some major risks.

Medtronic leverages AI to enhance medical device developmentMedtronic Plc, a leading global medical device manufacturer, increasingly integrates artificial intelligence (AI) into its operations to enhance business efficiency and spearhead new developments. The company has positioned AI as a central element of its research and development strategy, employing machine learning algorithms to expedite the design and testing phases of new medical devices.
The application of such AI solutions spans various functions, from optimising materials and device geometry to validating product performance via virtual simulations. Although Medtronic projects single-digit revenue growth for 2025, the escalating global demand for healthcare products may lead to more substantial growth.
Exploring potential trading opportunities, let's analyse the stock chart of Medtronic Plc (NYSE: MDT) from a technical analysis perspective:
On the Daily (D1) timeframe, Medtronic's stock has established a resistance level at 84.20 USD and support at 81.75 USD. An initial uptrend is evident, indicating the potential for further increases. However, if a downtrend starts, the downside target could be set at 70.10 USD.
If the current uptrend continues and the stock price breaks through the resistance at 84.20 USD, there could be a buying opportunity with a short-term target of 89.30 USD. For those considering a medium-term investment strategy, the stock price might rise to 95.50 USD if the positive momentum persists.
__
Ideas and other content presented on this page should not be considered as guidance for trading or an investment advice. RoboMarkets bears no responsibility for trading results based on trading opinions described in these analytical reviews.
The material presented and the information contained herein is for information purposes only and in no way should be considered as the provision of investment advice for the purposes of Investment Firms Law L. 87(I)/2017 of the Republic of Cyprus or any other form of personal advice or recommendation, which relates to certain types of transactions with certain types of financial instruments.
Risk Warning: CFDs are complex instruments and come with a high risk of losing money rapidly due to leverage. 69.88% of retail investor accounts lose money when trading CFDs with this provider. You should consider whether you understand how CFDs work and whether you can afford to take the high risk of losing your money.

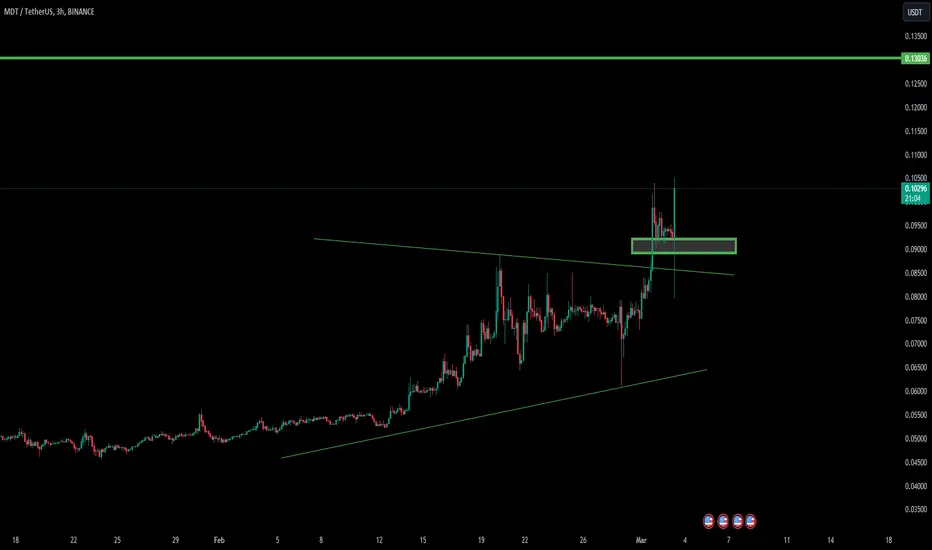
MDT/USDT Breakout alert!! This is bullish momentum for the move!💎 Paradisers, MDT is indeed displaying intriguing movements that demand close attention.
💎 The successful breakout from the descending channel is certainly a bullish signal for the movement. With the price already retesting the trendline, it appears poised for further upward movement towards the next target, which lies within the supply area of 0.09 to 0.0967.
💎 A successful breakout above this supply zone would confirm MDT's return to a bullish trend, potentially leading to significant upward momentum towards our target strong resistance area.
💎 However, if MDT fails to sustain above the supply area and experiences a strong rejection indicated by a bearish candle, there's a possibility of a retracement back to the downside.
💎 In such a scenario, the price could revisit the demand area and even potentially drop to the strong support area around 0.0555.
💎 When MDT reaches the strong support area, it's crucial for it to bounce back and resume its upward trajectory in order to make another attempt at breaking the resistance. Considering MDT's history of bouncing off key support levels, there's a chance it could repeat this pattern and move back towards the upside.
💎 It's important to remain vigilant and monitor MDT's price action closely. A breakdown below the demand area, confirmed by a daily candle close below it, would invalidate the bullish scenario and could lead to further downward movement.
MyCryptoParadise
iFeel the success🌴

Medtronic Beats Fourth-Quarter Estimates But Shares Down 2.44%Medtronic ( NYSE:MDT ), a health tech firm, has beat Wall Street estimates for quarterly profit and revenue in Q4 due to a pickup in surgical volumes at hospitals. The company's financial performance has grown due to a resurgence in demand as people, especially older adults, opted for medical procedures deferred during the COVID-19 pandemic. Medtronic forecasts fiscal 2025 adjusted per-share profit in the range of $5.40 to $5.50, with its midpoint in line with analysts' average estimate of $5.45.
Medtronic ( NYSE:MDT ) joins medical device makers such as Abbott Laboratories and Boston Scientific that have also benefited from soaring demand for non-urgent surgeries. The company took an adjusted charge of $439 million in the fourth quarter, higher than its previously disclosed estimate of between $350 million and $425 million, related to its decision to exit its unprofitable ventilator product line and reorganize the respiratory and patient monitoring businesses.
Sales at the company's diabetes unit, which returned to growth in the U.S. last quarter, rose 10.9% in the quarter ended April 26. However, sales at Medtronic's heart devices unit, its biggest revenue driver, fell 5.2% to $3.13 billion, missing analysts' estimate of $3.14 billion. The second-biggest unit by revenue, neuroscience, which makes medical devices and implants used in the treatment of the spine and musculoskeletal system, posted a 5.6% rise in sales, topping analysts' expectations.
Medtronic ( NYSE:MDT ) reported Q4 worldwide revenue of $8.589 billion, an increase of 0.5% as reported and 5.4% on an organic basis. The organic revenue results reflect broad-based growth across the company, with mid-single digit or higher organic revenue growth in all four segments.
FY24 worldwide revenue of $32.364 billion, an increase of 3.6% as reported and 5.2% on an organic basis, was reported. The company's momentum is building into the new fiscal year, with new product cycles in some of MedTech's most attractive markets and enhanced as AI is applied across the portfolio.
Technical Outlook
Despite profit beat, Medtronic ( NYSE:MDT ) stock is down 2.44% as of the time of writing trading with a Relative Strength Index (RSI) of 52.24 which is poised for a trend reversal in the near to long term. The daily price charts depicts a long wick Doji which means indecision among buyers and sellers.

#MDT/USDT#MDT
The price is moving within a 12-hour downtrend channel that it is firmly committed to, and has just broken through
We have a green support area at 0.0550 and have been bounced from
We have a tendency to stabilize above the Moving Average 100
We have a bearish RSI and are about to break out
Entry price is 0.06100
The first target is 0.07400
The second target is 0.08260
The third goal is 0.09150

LINA ANALYSIS FOR LONG TERM (1W CHART)LINA has experienced a symmetrical triangle breakout on weekly timeframe, indicating more than 200% gain in near future.
Targets 0.01880, 0.03450, 0.07000
Support 0.00740
LLong

LINA BREAKING OUT IN 4H TIMEFRAMELINA broke out from this triangle in 2H timeframe in the chart, BTC being bullish , LINA might give at least 20% from here.
LLong

Alikze »» MDT | Wave 3 or C bullish scenarioIn the weekly time, it is moving in an ascending channel, which after a complex correction at the bottom of the B wave channel has completed the correction, and now the current motivational wave will have the ability to reach the specified goals. Also, it is currently in the middle of the channel, which will be accessible with support of 0.12 targets. Also, a break below the trading area will be a reversal and the chart should be re-examined. If the behavior and structure of the post changes, it will be updated.
»»»«««»»»«««»»»«««
Please support this idea with a LIKE and COMMENT if you find it useful and Click "Follow" on our profile if you'd like these trade ideas delivered straight to your email in the future.
Thanks for your continued support.
Sincerely.❤️
»»»«««»»»«««»»»«««

MDT Will Moon Like FET - DO NOT MISS IT MartyBoots here. I have been trading for 17 years and I am here to share my ideas with you to help the Crypto space. The Bull market is here
MDT has had a very strong breakout , These breakouts can often continue longer than people think. MDT should have a breakout like FET and continue to moon. This has very good market structure and good price action . These structures are how you can make good returns on investment / on your trade
Please watch the video for more information

MDT wants to follow PHBMDT VS PHB
Both coins are AI coins
Both have small MC
Both printed Huge Ascending triangle
Phb pumbed hard recently so all the eyes on MDT now
It looks so obvious it wants to follow it’s sister
Note : MDT above our entry by 60% but will continue pumping hard once it brokes the massive bullish pattern
Best of luck


MDT INCREASE VOLUME TRENDMDT seems to have a new increase volume trend, we will follow to see if it can be confirmed in the next time frames.
MDT can show new gains after this volume confirmation.

MDT LONG TERM ANALYSIS (1W)First of all, you should know that MDT is very volatile and takes time to move up.
Examining the MDT waves, it looks like we have a large diametric on the chart that now has price trying to complete the rising E wave.
We have specified the mid-term targets on the chart, it is better to count more on TP 1.
Closing 1 weekly candle below the green range will violate the analysis.
For risk management, please don't forget stop loss and capital management
Comment if you have any questions
Thank You

Mdt Breakout Alert Mdt/Usdt
Weekly Time-frame
Trendline resistance breakout
Breakout is almost confirmed expecting price to rise 50-100% incoming days
Not financial advice

MDT longNYSE:MDT looks good to claim November high... Wait for confirmations to get a better trade...
#trading
@MeasurableData
#MDT
MLong

AMP 1hr BullishAMP 1hr - Still looking good here. Would like to see an hourly close above 0.00358 and for us to take out the last high at 0.0038 for continuation. If not, I believe we may be range bound between 0.00309-0.00358 before moving higher.

Measurable Data Token - MDTUSDT - Gems Series Greetings,
In the next bull run, we expect Social, Data and AI to be the industries that may perform prominently.
MDT is one of the projects that has the potential.
The coin recently broke up from a converging wedge pattern and is currently consolidating and another move up can be expected soon.
Here is the report on the selection criteria.
1- Project Status = Active
2- Industry = Data
3- Community Involvement = Healthy
4- Prominent Listings = Binance, Coinbase, OKX, Gate.io
5- MarketCap = $35M
6- Coin Supply = Cir: 606M, Tot: 1B
Based on the factors, this coin has a potential for 10x to 50x rally.
Note: This is not financial advise and shall only be used for educational and/or entertainment purpose. Please do your own research before investing. Crypto Markets are highly volatile and you are responsible for the risk of losing your entire investment.

a new wave of growth by forTo date, against the background of a new wave of top growth in the second half of the week, there is a high probability of a new local move on for. The coin is getting closer to the 0.2 level despite minor market pullbacks and is preparing for the 0.25 test, in case of a breakdown of which the road to 0.4-5 will be open. On the weekly chart, after a long accumulation from the main support at 0.15, today there is a complete extinction of the bearish trend on the indicators, which also makes it possible to try to start a bullish trend at the change of the month in order to gain a foothold above 0.25-35 by the opening of a new annual candle.
UFT and vib, whose breakdown potential exceeds for, also look ready for pump.
FLong

#MDT/USDT#MDT
The price has been trading in a descending triangle since the beginning of 2023
The price respected this triangle with great gratitude
Finally, the downtrend of a triangle was broken
We expect an increase of approximately 100% as a first price at 0.0900
From the current price 0.04700
With oversold presence on the MACD indicator
